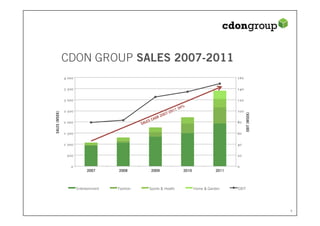
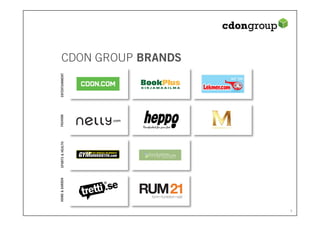
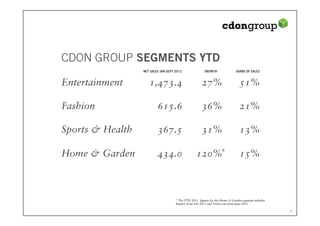
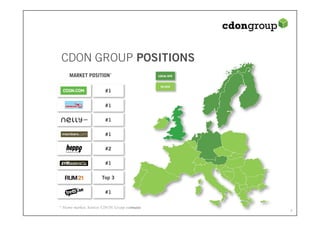
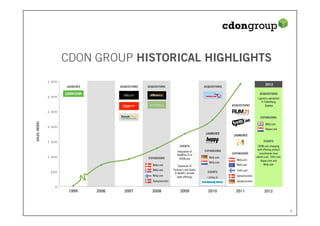
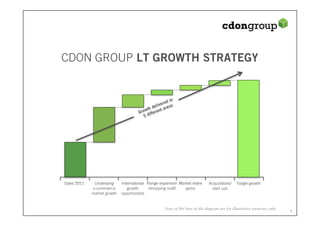
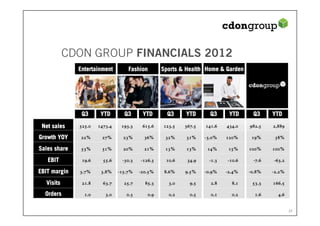
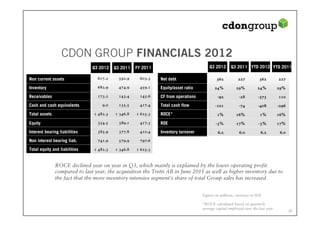
CDON Group AB is the #1 e-commerce group in the Nordics operating 10 brands across 4 segments - Entertainment, Fashion, Sports & Health, and Home & Garden. In the last 12 months, the group generated 4.2 billion SEK in revenues from 225 million visits to its sites and 6.7 million orders shipped to 2.5 million customers. CDON aims to continue its growth through expanding its existing brands internationally, broadening its shopping mall offerings, pursuing acquisitions and startups, and gaining additional market share.
Overview of the services offered by Landstar along with information on the Landstar system. Celebrating 25 years of Excellence in transportation and supply chain solutions!
Kees de Groot (ZenithOptimedia) @ CMC Formats & AudiencesMedia Perspectives
De presentatie die Kees de Groot (ZenithOptimedia) gaf tijdens het Cross Media Café Formats & Audiences op 6 november 2012. Meer info: http://www.immovator.nl/cross-media-cafe-formats-audiences
Q4 year end-2012 assa abloy invetors presentation 7 februaryASSA ABLOY
ASSA ABLOY released its interim report January - December on Thursday 7 February 2013 at 08.00 am (CET). A combined investors’ and analyst meeting and web conference was held at Operaterrassen in Stockholm, Sweden, at 10:00 am (CET). Welcome to visit our Investor pages at http://www.assaabloy.com/investors/
The story. The people. The Group.
Träffa våra varumärken och några av de 1.030 fantastiska människorna och gör CDON Group vad vi är idag.
Oktober 2012.
5. HOME & GARDEN SPORTS & HEALTH FASHION ENTERTAINMENT
CDON GROUP BRANDS
6. CDON GROUP SEGMENTS YTD
NET SALES JAN-SEPT 2012 GROWTH SHARE OF SALES
Entertainment 1,473.4 27% 51%
Fashion 615.6 36% 21%
Sports & Health 367.5 31% 13%
Home & Garden 434.0 120%* 15%
* The YTD 2011 figures for the Home & Garden segment includes
Rum21 from Feb 2011 and Tretti.com from June 2011
7. CDON GROUP POSITIONS
MARKET POSITION
#1
#1
#1
#1
#2
#1
Top 3
#1
* Home market. Source: CDON Group estimates
8. CDON GROUP HISTORICAL HIGHLIGHTS
3 500
2012
LAUNCHES ACQUISITIONS ACQUISITIONS ACQUISITIONS
ACQUISITIONS
3 000 Logistics operations
in Falkenberg,
ACQUISITIONS Sweden
2 500
EXPANSIONS
SALES (MSEK)
Nelly.com
2 000
Heppo.com
LAUNCHES
LAUNCHES
1 500 EVENTS
EVENTS CDON.com shopping
EXPANSIONS mall offering product
Integration of
BookPlus.fi in EXPANSIONS assortments from
1 000 EXPANSIONS CDON.com Nelly.com Lekmer.com, Tretti.com,
Nelly.com Heppo.com and
Nelly.com
Nelly.com Expansion of Nelly.com Nelly.com
Nelly.com Fashion’s and Sports Tretti.com
500 & Health’s private EVENTS
Nelly.com label offerings Gymgrossisten
Listing at
Gymgrossisten Gymgrossisten
0
1999 2006 2007 2008 2009 2010 2011 2012
9. CDON GROUP LT GROWTH STRATEGY
Sales 2011 Underlying International Range expansion Market share Acquisitions/ Target growth
e-commerce growth (shopping mall) gains start ups
market growth opportunities
Sizes of the bars in the diagram are for illustrative purposes only
10. CDON GROUP EXECUTING ON STRATEGY
Broadening Cdon.com into Nordic shopping mall
Expanding Fashion segment geographically
Expanding Gymgrossisten.com
Customer centric approach with control over the
value chain
12. Nelly.com
NELLY.COM UNIQUENESS
800+ brands of Scandinavian and
international fashion
30+ private labels and designer partnerships
New garments added every day
Interaction with passionate customers
13. Nelly.com
VISIT BORÅS
The textile capital of Sweden
17. Nelly.com
VISIT NELLY.COM
The site, thoughts & execution
18. Nelly.com
NELLY.COM WEBSITE
Buy the
Super high full look
definition
photos
Recomm
endations
Share to based on
inspire customer
friends behavior
Catwalk video
and angle
photography
Engaging the
Customer blogging
reviews community
19. Nelly.com
NELLY.COM MARKETING
300,000+
dresses
designed in
45 days
Google
indexed
68,000 sites
2.3 million linking in to
visits to the campaign
campaign
site
25. CDON GROUP FINANCIALS 2012
Q3 2012 Q3 2011 FY 2011 Q3 2012 Q3 2011 YTD 2012 YTD 2011
Non current assets 617.2 592.9 603.3 Net debt 362 227 362 227
Inventory 682.9 474.9 459.1 Equity/asset ratio 24% 29% 24% 29%
Receivables 173.2 143.4 145.6 CF from operations -92 -28 -373 110
Cash and cash equivalents 9.0 135.5 417.4 Total cash flow -101 -74 -408 -296
Total assets 1 482.3 1 346.8 1 625.3 ROCE* 1% 16% 1% 16%
Equity 354.5 389.1 417.3 ROE -3% 17% -3% 17%
Interest bearing liabilities 385.9 377.8 410.4 Inventory turnover 6.2 6.0 6.2 6.0
Non interest bearing liab. 741.9 579.9 797.6
Total equity and liabilities 1 482.3 1 346.8 1 625.3
ROCE declined year on year in Q3, which mainly is explained by the lower operating profit
compared to last year, the acquisition the Tretti AB in June 2011 as well as higher inventory due to
the fact that the more inventory intensive segment’s share of total Group sales has increased
Figures in millions, currency in SEK
*ROCE calculated based on quarterly
average capital employed over the last year