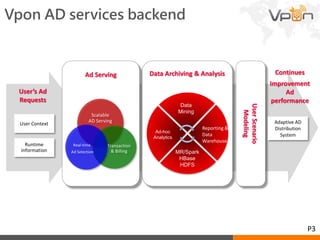
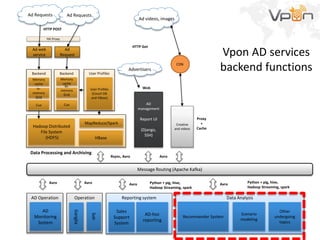
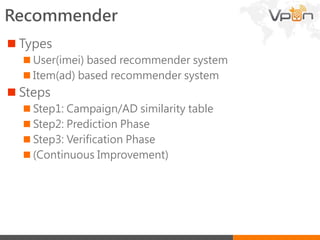
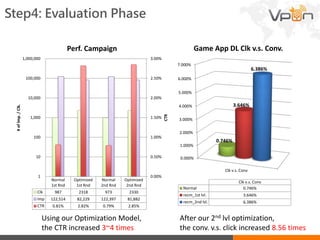
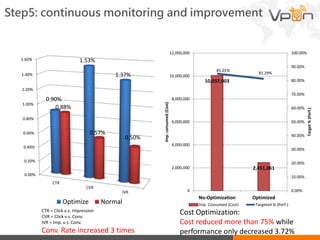
廣告效果導向為基礎的行動廣告系統
Recommender as an example
Steven Chiu
RD department
Vpon Inc.
Outline
 Background, challenges and KPIs
 Basic concept
 Challenges and KPIs
 Vpon Ad service infrastructure
 AD effectiveness related work
 Recommender
 System flows
 Summary
 Q&A
Basic concept
Vpon Ad service infrastructure
Challenges and KPIs
Typical use case
Clicks
Conversions
The media
Landing pages
ADs
Ads on Vpon…
Mainly for Navigation apps, e.g. Navidog
POI (Map)
POI (Banner)
Normal
Full screen ads Video ads
Ads on Vpon…
AD Performance Evaluation
 Click Through
Rate (CTR)
 Conversion Rate
 Goals
To maximize
CTR
To maximize
conversations
Click
Conversion
Impression
Integration
Apps
Placing Ads
• Charged in CPC,
CPM
• Criteria:
• time, locations, app
categories, budget,
Performance reports
Advertisers
app
App reports
app app …
Mobile app users
Mobile app publishers
Advertisers
Ad performance reports
Vpon AD services backend
Data Archiving & Analysis
User Context
Runtime
information
User’s Ad
Requests
Ad Serving
Scalable
AD Serving
Transaction
& Billing
Real-time
Ad Selection
UserScenario
Modeling
Data
Mining
MR/Spark
HBase
HDFS
Ad-hoc
Analytics
Reporting &
Data
Warehouse
Adaptive AD
Distribution
System
Continues
Improvement
Ad
performance
P3
60+ M
Monthly Active Unique Devices
200+ M
of Daily Ad Requests
2+ T
Ad transaction records over time
25+ M
Cell Towers/Wi-Fi AP Location Data
Some numbers for Vpon AD Network
P2
Taipei, Shanghai, HK, Bejing and Tokyo
2 IDCs at Taipei, Shanghai and Some Amazon EC2 nodes
Data Analysis
Ad Requests
Ad web
service
Backend
Memory
cache
In-
memory
Grid
HBase
MapReduce/Spark
HA Proxy
Message Routing (Apache Kafka)
Ad
Request
Cue
Backend
Hadoop Distributed
File System
(HDFS)
User Profiles
Ad Requests
HTTP POST
Avro Avro Avro
Ad videos, images
HTTP Get
Data Processing and Archiving
Creative
and videos
AD
management
Report UI
(Django,
SSH)
Vpon AD services
backend functionsCDN
Recommender System
Other
undergoing
topics
Reporting system
Sales
Support
System
AD-hoc
reporting
Operation
Ganglia
Solr
AD Operation
AD
Monitoring
System
Scenario
modeling
Avro
Web
Proxy
+
Cache
Memory
cache
In-
memory
Grid
Cue
User Profiles
(Couch DB
and HBase)
Rsync, Avro Avro
Python + pig, hive,
Hadoop Streaming, spark
Python + pig, hive,
Hadoop Streaming, spark
Advertisers
Recommender as an example
Design and Implementation
Recommender
 Types
 User(imei) based recommender system
 Item(ad) based recommender system
 Steps
 Step1: Campaign/AD similarity table
 Step2: Prediction Phase
 Step3: Verification Phase
 (Continuous Improvement)
• Serve ads according to users
preference
Recommender flow
Prediction
Machine
Learning
(e.g. recommender)
Evaluation
Data
Selection
• Select user records of the Ad
Click/Conversion action by
different kinds of Apps
• Select users logs of the
Location, Date/Time, Usage
Freq., Area, Movement Speed…
• Identify relation of the conversion
types, App info, Ad info and user
info to best choose configurations
• Campaign/AD similarity calculation
• User preferences
• Advertising in accordance with
the identified targeted users
• Feedback the AD execution
results into the system for
adjusting the modeling adaptively
P5
Ad 1 Ad 2 Ad 3 Ad 4 Ad N
User 1 0 0 1 0 0
User 2 1 1 0 1 0
User 3 1 1 1 1 1
User 4 1 1 0 0 0
User N … … … … …
Step1: Ads' Similarities
Unique
device IDs
from latest
K months
Historical and ongoing ads (App downloads as conversions)
Ad 1 Ad 2 Ad 3 Ad 4 Ad N
User 1 P(1,1) P(1,2) P(1,3) P(1,4) P(1,5)
User 2 P(2,1) P(2,2) P(2,3) P(2,4) P(2,5)
User 3 P(3,1) P(3,2) P(3,3) P(3,4) P(3,5)
User 4 P(4,1) 1P(4,2) P(4,3) P(4,4) P(4,5)
User Z … … … … …
Step2: Users' Preferences
Unique
device IDs
from latest
K months
Historical and ongoing ads (App downloads as conversions)
User 1
User 2
… … … … … …
Step3: Prediction Phase:
ADs sorted by preference
Data Analysis
Ad Requests
Ad web
service
Backend
Memory
cache
In-
memory
Grid
HBase
MapReduce/Spark
HA Proxy
Message Routing (Apache Kafka)
Ad
Request
Cue
Backend
Hadoop Distributed
File System
(HDFS)
User Profiles
Ad Requests
HTTP POST
Avro Avro Avro
Ad videos, images
HTTP Get
Data Processing and Archiving
Creative
and videos
Billing
System
CDN
Recommender System
Other
undergoing
topics
Reporting system
Sales
Support
System
AD-hoc
reporting
Operation
Ganglia
Solr
AD Operation
AD
Monitoring
System
Scenario
modeling
Avro
Billing
Proxy
+
Cache
Memory
cache
In-
memory
Grid
Cue
User Profiles
(Couch DB
and HBase)
Rsync, Avro Avro
Step3: Prediction Phase:
Serving Ads based on
Preferences
user1 ad1,ad2, ad5
user2 ad2,ad4, ad5
user3 ad4,ad5,ad6,ad8
user1
Persisted on Apache CouchDB
Replicated to in-memory grid
Step4: Evaluation Phase
Using our Optimization Model,
the CTR increased 3~4 times
Normal
1st Rnd
Optimized
1st Rnd
Normal
2nd Rnd
Optimized
2nd Rnd
Clk 987 2318 973 2330
Imp 122,514 82,229 122,397 81,882
CTR 0.81% 2.82% 0.79% 2.85%
0.00%
0.50%
1.00%
1.50%
2.00%
2.50%
3.00%
1
10
100
1,000
10,000
100,000
1,000,000
CTR
#ofImp./Clk.
Perf. Campaign
0.000%
1.000%
2.000%
3.000%
4.000%
5.000%
6.000%
7.000%
Clk v.s. Conv
0.746%
3.646%
6.386%
Clk v.s. Conv
Normal 0.746%
recm_1st lvl. 3.646%
recm_2nd lvl. 6.386%
Game App DL Clk v.s. Conv.
After our 2nd lvl optimization,
the conv. v.s. click increased 8.56 times
Step5: continuous monitoring and improvement
10,037,003
2,451,061
85.01%
81.29%
0.00%
10.00%
20.00%
30.00%
40.00%
50.00%
60.00%
70.00%
80.00%
90.00%
100.00%
0
2,000,000
4,000,000
6,000,000
8,000,000
10,000,000
12,000,000
No-Optimization Optimized
Target%(Perf.)
Imp.consumed(Cost)
Imp. Consumed (Cost) Targeted % (Perf.)
0.00%
0.20%
0.40%
0.60%
0.80%
1.00%
1.20%
1.40%
1.60%
CTR
CVR
IVR
0.90%
1.53%
1.37%
0.88%
0.57%
0.50%
Optimize Normal
CTR = Click v.s. Impression
CVR = Click v.s. Conv.
IVR = Imp. v.s. Conv.
Conv. Rate increased 3 times
Cost Optimization:
Cost reduced more than 75% while
performance only decreased 3.72%
Implementation
 Hadoop MapReduce as computing platform
 Using Hadoop streaming with Python
 Map: a list of ad pairs as input for similarity caculation
 Reduce: simply aggregate the map results
 Re-modeling on a daily basis based on results
 Will go on to use Haoop HDFS + Spark + Python for performance
benefit
Summary
 Build the infra. that proves models effective or not as early
as possible
 AB testing for new models
 Automate as much as possible
 Monitoring and measurement
 Computing resource
 Properly manage Product, ad-hoc, analysis jobs
 Optimization does work
 Use Python wherever it fits

Vpon - 廣告效果導向為基礎的行動廣告系統

  • 1.
    廣告效果導向為基礎的行動廣告系統 Recommender as anexample Steven Chiu RD department Vpon Inc.
  • 2.
    Outline  Background, challengesand KPIs  Basic concept  Challenges and KPIs  Vpon Ad service infrastructure  AD effectiveness related work  Recommender  System flows  Summary  Q&A
  • 3.
    Basic concept Vpon Adservice infrastructure Challenges and KPIs
  • 4.
  • 5.
    Ads on Vpon… Mainlyfor Navigation apps, e.g. Navidog POI (Map) POI (Banner) Normal
  • 6.
    Full screen adsVideo ads Ads on Vpon…
  • 7.
    AD Performance Evaluation Click Through Rate (CTR)  Conversion Rate  Goals To maximize CTR To maximize conversations Click Conversion Impression
  • 8.
    Integration Apps Placing Ads • Chargedin CPC, CPM • Criteria: • time, locations, app categories, budget, Performance reports Advertisers app App reports app app … Mobile app users Mobile app publishers Advertisers Ad performance reports
  • 9.
    Vpon AD servicesbackend Data Archiving & Analysis User Context Runtime information User’s Ad Requests Ad Serving Scalable AD Serving Transaction & Billing Real-time Ad Selection UserScenario Modeling Data Mining MR/Spark HBase HDFS Ad-hoc Analytics Reporting & Data Warehouse Adaptive AD Distribution System Continues Improvement Ad performance P3
  • 10.
    60+ M Monthly ActiveUnique Devices 200+ M of Daily Ad Requests 2+ T Ad transaction records over time 25+ M Cell Towers/Wi-Fi AP Location Data Some numbers for Vpon AD Network P2 Taipei, Shanghai, HK, Bejing and Tokyo 2 IDCs at Taipei, Shanghai and Some Amazon EC2 nodes
  • 11.
    Data Analysis Ad Requests Adweb service Backend Memory cache In- memory Grid HBase MapReduce/Spark HA Proxy Message Routing (Apache Kafka) Ad Request Cue Backend Hadoop Distributed File System (HDFS) User Profiles Ad Requests HTTP POST Avro Avro Avro Ad videos, images HTTP Get Data Processing and Archiving Creative and videos AD management Report UI (Django, SSH) Vpon AD services backend functionsCDN Recommender System Other undergoing topics Reporting system Sales Support System AD-hoc reporting Operation Ganglia Solr AD Operation AD Monitoring System Scenario modeling Avro Web Proxy + Cache Memory cache In- memory Grid Cue User Profiles (Couch DB and HBase) Rsync, Avro Avro Python + pig, hive, Hadoop Streaming, spark Python + pig, hive, Hadoop Streaming, spark Advertisers
  • 12.
    Recommender as anexample Design and Implementation
  • 14.
    Recommender  Types  User(imei)based recommender system  Item(ad) based recommender system  Steps  Step1: Campaign/AD similarity table  Step2: Prediction Phase  Step3: Verification Phase  (Continuous Improvement)
  • 15.
    • Serve adsaccording to users preference Recommender flow Prediction Machine Learning (e.g. recommender) Evaluation Data Selection • Select user records of the Ad Click/Conversion action by different kinds of Apps • Select users logs of the Location, Date/Time, Usage Freq., Area, Movement Speed… • Identify relation of the conversion types, App info, Ad info and user info to best choose configurations • Campaign/AD similarity calculation • User preferences • Advertising in accordance with the identified targeted users • Feedback the AD execution results into the system for adjusting the modeling adaptively P5
  • 16.
    Ad 1 Ad2 Ad 3 Ad 4 Ad N User 1 0 0 1 0 0 User 2 1 1 0 1 0 User 3 1 1 1 1 1 User 4 1 1 0 0 0 User N … … … … … Step1: Ads' Similarities Unique device IDs from latest K months Historical and ongoing ads (App downloads as conversions)
  • 17.
    Ad 1 Ad2 Ad 3 Ad 4 Ad N User 1 P(1,1) P(1,2) P(1,3) P(1,4) P(1,5) User 2 P(2,1) P(2,2) P(2,3) P(2,4) P(2,5) User 3 P(3,1) P(3,2) P(3,3) P(3,4) P(3,5) User 4 P(4,1) 1P(4,2) P(4,3) P(4,4) P(4,5) User Z … … … … … Step2: Users' Preferences Unique device IDs from latest K months Historical and ongoing ads (App downloads as conversions)
  • 18.
    User 1 User 2 …… … … … … Step3: Prediction Phase: ADs sorted by preference
  • 19.
    Data Analysis Ad Requests Adweb service Backend Memory cache In- memory Grid HBase MapReduce/Spark HA Proxy Message Routing (Apache Kafka) Ad Request Cue Backend Hadoop Distributed File System (HDFS) User Profiles Ad Requests HTTP POST Avro Avro Avro Ad videos, images HTTP Get Data Processing and Archiving Creative and videos Billing System CDN Recommender System Other undergoing topics Reporting system Sales Support System AD-hoc reporting Operation Ganglia Solr AD Operation AD Monitoring System Scenario modeling Avro Billing Proxy + Cache Memory cache In- memory Grid Cue User Profiles (Couch DB and HBase) Rsync, Avro Avro Step3: Prediction Phase: Serving Ads based on Preferences user1 ad1,ad2, ad5 user2 ad2,ad4, ad5 user3 ad4,ad5,ad6,ad8 user1 Persisted on Apache CouchDB Replicated to in-memory grid
  • 20.
    Step4: Evaluation Phase Usingour Optimization Model, the CTR increased 3~4 times Normal 1st Rnd Optimized 1st Rnd Normal 2nd Rnd Optimized 2nd Rnd Clk 987 2318 973 2330 Imp 122,514 82,229 122,397 81,882 CTR 0.81% 2.82% 0.79% 2.85% 0.00% 0.50% 1.00% 1.50% 2.00% 2.50% 3.00% 1 10 100 1,000 10,000 100,000 1,000,000 CTR #ofImp./Clk. Perf. Campaign 0.000% 1.000% 2.000% 3.000% 4.000% 5.000% 6.000% 7.000% Clk v.s. Conv 0.746% 3.646% 6.386% Clk v.s. Conv Normal 0.746% recm_1st lvl. 3.646% recm_2nd lvl. 6.386% Game App DL Clk v.s. Conv. After our 2nd lvl optimization, the conv. v.s. click increased 8.56 times
  • 21.
    Step5: continuous monitoringand improvement 10,037,003 2,451,061 85.01% 81.29% 0.00% 10.00% 20.00% 30.00% 40.00% 50.00% 60.00% 70.00% 80.00% 90.00% 100.00% 0 2,000,000 4,000,000 6,000,000 8,000,000 10,000,000 12,000,000 No-Optimization Optimized Target%(Perf.) Imp.consumed(Cost) Imp. Consumed (Cost) Targeted % (Perf.) 0.00% 0.20% 0.40% 0.60% 0.80% 1.00% 1.20% 1.40% 1.60% CTR CVR IVR 0.90% 1.53% 1.37% 0.88% 0.57% 0.50% Optimize Normal CTR = Click v.s. Impression CVR = Click v.s. Conv. IVR = Imp. v.s. Conv. Conv. Rate increased 3 times Cost Optimization: Cost reduced more than 75% while performance only decreased 3.72%
  • 22.
    Implementation  Hadoop MapReduceas computing platform  Using Hadoop streaming with Python  Map: a list of ad pairs as input for similarity caculation  Reduce: simply aggregate the map results  Re-modeling on a daily basis based on results  Will go on to use Haoop HDFS + Spark + Python for performance benefit
  • 24.
    Summary  Build theinfra. that proves models effective or not as early as possible  AB testing for new models  Automate as much as possible  Monitoring and measurement  Computing resource  Properly manage Product, ad-hoc, analysis jobs  Optimization does work  Use Python wherever it fits