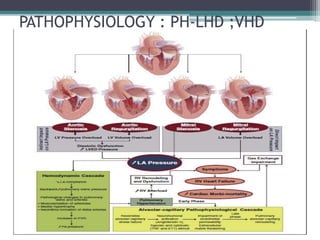
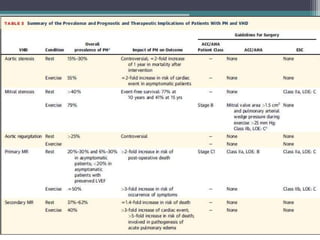
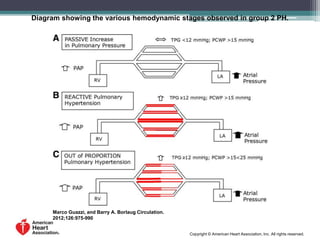
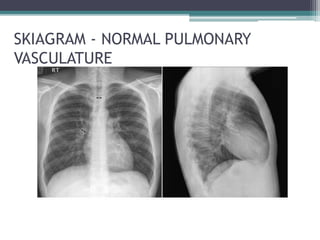
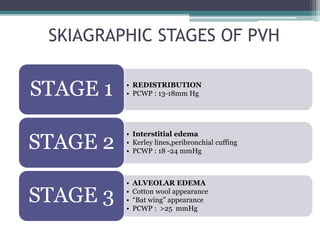
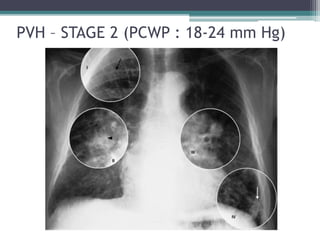
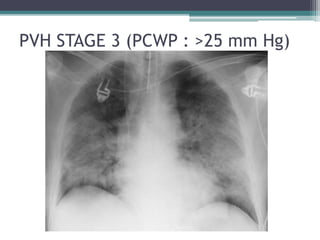
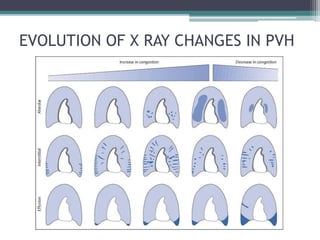
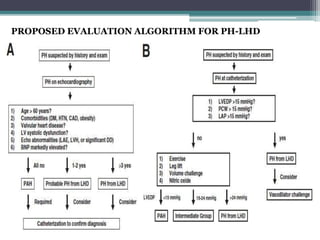
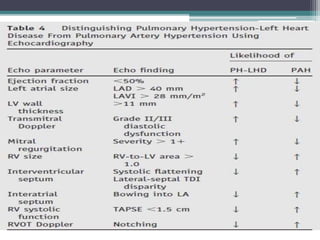
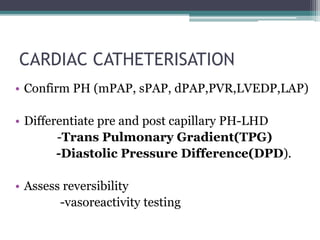
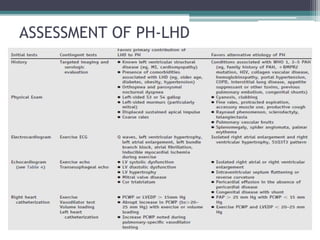
1) Pulmonary venous hypertension (PVH) is classified into 3 stages based on chest x-ray findings and pulmonary capillary wedge pressure (PCWP) levels. Stage 1 is seen at PCWP of 13-18 mmHg and shows redistribution of blood flow. Stage 2 occurs at PCWP of 18-24 mmHg and exhibits interstitial edema and Kerley lines. Stage 3 presents at PCWP over 25 mmHg with alveolar edema and cotton wool appearance.
2) Evaluation of pulmonary hypertension associated with left heart disease (PH-LHD) includes assessing transpulmonary gradient (TPG) and diastolic pressure difference (DPD) via right heart catheterization to determine if the
This presentation is almost a complete Pictoral view of Radiograph chest.
This presentation will help radiologist in daily reporting.
This presentation will help physicians, surgeons, anesthetist and almost all medical professionals in diagnosing commonly presenting cardiac diseases.
This will also help all in preparaing TOACS examination.
This ppt is prepared from content of braunwald, and some latest international journals. In account it make more clear concept about pulmonary hypertension.
it also contain latest ESC 2022 guidelines of pulmonary hypertension.
Novel hemodynamic monitoring tool for major surgery and ICU patients. With minimally invasive doppler probe insertable through regular central line, Nilus is adding right side perspective back into hemodynamic monitoring.
Seminar of U.V. Spectroscopy by SAMIR PANDASAMIR PANDA
Spectroscopy is a branch of science dealing the study of interaction of electromagnetic radiation with matter.
Ultraviolet-visible spectroscopy refers to absorption spectroscopy or reflect spectroscopy in the UV-VIS spectral region.
Ultraviolet-visible spectroscopy is an analytical method that can measure the amount of light received by the analyte.
Multi-source connectivity as the driver of solar wind variability in the heli...Sérgio Sacani
The ambient solar wind that flls the heliosphere originates from multiple
sources in the solar corona and is highly structured. It is often described
as high-speed, relatively homogeneous, plasma streams from coronal
holes and slow-speed, highly variable, streams whose source regions are
under debate. A key goal of ESA/NASA’s Solar Orbiter mission is to identify
solar wind sources and understand what drives the complexity seen in the
heliosphere. By combining magnetic feld modelling and spectroscopic
techniques with high-resolution observations and measurements, we show
that the solar wind variability detected in situ by Solar Orbiter in March
2022 is driven by spatio-temporal changes in the magnetic connectivity to
multiple sources in the solar atmosphere. The magnetic feld footpoints
connected to the spacecraft moved from the boundaries of a coronal hole
to one active region (12961) and then across to another region (12957). This
is refected in the in situ measurements, which show the transition from fast
to highly Alfvénic then to slow solar wind that is disrupted by the arrival of
a coronal mass ejection. Our results describe solar wind variability at 0.5 au
but are applicable to near-Earth observatories.
THE IMPORTANCE OF MARTIAN ATMOSPHERE SAMPLE RETURN.Sérgio Sacani
The return of a sample of near-surface atmosphere from Mars would facilitate answers to several first-order science questions surrounding the formation and evolution of the planet. One of the important aspects of terrestrial planet formation in general is the role that primary atmospheres played in influencing the chemistry and structure of the planets and their antecedents. Studies of the martian atmosphere can be used to investigate the role of a primary atmosphere in its history. Atmosphere samples would also inform our understanding of the near-surface chemistry of the planet, and ultimately the prospects for life. High-precision isotopic analyses of constituent gases are needed to address these questions, requiring that the analyses are made on returned samples rather than in situ.
Cancer cell metabolism: special Reference to Lactate PathwayAADYARAJPANDEY1
Normal Cell Metabolism:
Cellular respiration describes the series of steps that cells use to break down sugar and other chemicals to get the energy we need to function.
Energy is stored in the bonds of glucose and when glucose is broken down, much of that energy is released.
Cell utilize energy in the form of ATP.
The first step of respiration is called glycolysis. In a series of steps, glycolysis breaks glucose into two smaller molecules - a chemical called pyruvate. A small amount of ATP is formed during this process.
Most healthy cells continue the breakdown in a second process, called the Kreb's cycle. The Kreb's cycle allows cells to “burn” the pyruvates made in glycolysis to get more ATP.
The last step in the breakdown of glucose is called oxidative phosphorylation (Ox-Phos).
It takes place in specialized cell structures called mitochondria. This process produces a large amount of ATP. Importantly, cells need oxygen to complete oxidative phosphorylation.
If a cell completes only glycolysis, only 2 molecules of ATP are made per glucose. However, if the cell completes the entire respiration process (glycolysis - Kreb's - oxidative phosphorylation), about 36 molecules of ATP are created, giving it much more energy to use.
IN CANCER CELL:
Unlike healthy cells that "burn" the entire molecule of sugar to capture a large amount of energy as ATP, cancer cells are wasteful.
Cancer cells only partially break down sugar molecules. They overuse the first step of respiration, glycolysis. They frequently do not complete the second step, oxidative phosphorylation.
This results in only 2 molecules of ATP per each glucose molecule instead of the 36 or so ATPs healthy cells gain. As a result, cancer cells need to use a lot more sugar molecules to get enough energy to survive.
introduction to WARBERG PHENOMENA:
WARBURG EFFECT Usually, cancer cells are highly glycolytic (glucose addiction) and take up more glucose than do normal cells from outside.
Otto Heinrich Warburg (; 8 October 1883 – 1 August 1970) In 1931 was awarded the Nobel Prize in Physiology for his "discovery of the nature and mode of action of the respiratory enzyme.
WARNBURG EFFECT : cancer cells under aerobic (well-oxygenated) conditions to metabolize glucose to lactate (aerobic glycolysis) is known as the Warburg effect. Warburg made the observation that tumor slices consume glucose and secrete lactate at a higher rate than normal tissues.
Earliest Galaxies in the JADES Origins Field: Luminosity Function and Cosmic ...Sérgio Sacani
We characterize the earliest galaxy population in the JADES Origins Field (JOF), the deepest
imaging field observed with JWST. We make use of the ancillary Hubble optical images (5 filters
spanning 0.4−0.9µm) and novel JWST images with 14 filters spanning 0.8−5µm, including 7 mediumband filters, and reaching total exposure times of up to 46 hours per filter. We combine all our data
at > 2.3µm to construct an ultradeep image, reaching as deep as ≈ 31.4 AB mag in the stack and
30.3-31.0 AB mag (5σ, r = 0.1” circular aperture) in individual filters. We measure photometric
redshifts and use robust selection criteria to identify a sample of eight galaxy candidates at redshifts
z = 11.5 − 15. These objects show compact half-light radii of R1/2 ∼ 50 − 200pc, stellar masses of
M⋆ ∼ 107−108M⊙, and star-formation rates of SFR ∼ 0.1−1 M⊙ yr−1
. Our search finds no candidates
at 15 < z < 20, placing upper limits at these redshifts. We develop a forward modeling approach to
infer the properties of the evolving luminosity function without binning in redshift or luminosity that
marginalizes over the photometric redshift uncertainty of our candidate galaxies and incorporates the
impact of non-detections. We find a z = 12 luminosity function in good agreement with prior results,
and that the luminosity function normalization and UV luminosity density decline by a factor of ∼ 2.5
from z = 12 to z = 14. We discuss the possible implications of our results in the context of theoretical
models for evolution of the dark matter halo mass function.
This pdf is about the Schizophrenia.
For more details visit on YouTube; @SELF-EXPLANATORY;
https://www.youtube.com/channel/UCAiarMZDNhe1A3Rnpr_WkzA/videos
Thanks...!
3. CASE SCENARIO
• 65 year old female
• DOE FC II – III -6months
• T2DM&HTN – 15 yrs
• O/E – obese,pulse- 98/min irregular,BP-170/100
• JVP –raised,CVS-P2 loud
• ECG- AF
• CXR- cardiomegaly,prominent upper lobe veins
• Echo- EF 56%
• RHC – PAP- 38,PCWP-20
4.
5. *5th WSPH Nice 2013
GROUP 2 - Pulmonary hypertension due to
left heart disease (PH-LHD)
• 2.1 Left ventricular systolic dysfunction
• 2.2 Left ventricular diastolic dysfunction
• 2.3 Valvular disease
• 2.4 Congenital/acquired left heart inflow/outflow
tract obstruction and congenital cardiomyopathies
Journal of the American College of Cardiology Vol. 62, No. 25, 2013
6. INTRODUCTION
• Pulmonary hypertension associated with left
heart disease is the most common form of
pulmonary hypertension.
• Pathophysiology remains poorly understood and
its treatment remains undefined.
• Up to 60% of patients with severe LV systolic
dysfunction and up to 70% of patients with
isolated LV diastolic dysfunction develop PH-
LHD
7. DEFINITION
• The current hemodynamic definition of PH-
LHD combines a resting mean pulmonary artery
pressure (mPAP) >25 mm Hg and a pulmonary
capillary wedge pressure (PCWP)>15mmHg.
24. OBJECTIVES OF FURTHER EVALUATION
• Confirming the group of PH
• Differentiating PAH and HFpEF
• Differentiate pre and post capillary PH
• Assessing pulmonary vascular reactivity to drugs
and exercise
26. Clinical features
Age >65 yrs
Elevated systolic blood pressure
Obesity
Hypertension
Coronary artery disease
Diabetes mellitus
Atrial fibrillation
Symptomatic response to diuretic drugs
Exaggerated increase in systolic blood pressure with
exercise
DIASTOLIC HEART FAILURE - POINTERS
27. DIASTOLIC HEART FAILURE - POINTERS
Echocardiography
• Left atrial enlargement
• Concentric remodeling
• Left ventricular hypertrophy
• Elevated left ventricular filling pressures (grade
II to IV diastolic dysfunction)
28.
29.
30. CARDIAC CATHETERISATION
• Confirm PH (mPAP, sPAP, dPAP,PVR,LVEDP,LAP)
• Differentiate pre and post capillary PH-LHD
-Trans Pulmonary Gradient(TPG)
-Diastolic Pressure Difference(DPD).
• Assess reversibility
-vasoreactivity testing
31. TPG (TRANS PULMONARY GRADIENT)
• TPG = mPAP - PCWP
• “Out of proportion” /reactive PH/ combined
post- and pre-capillary PH is defined as mean
PAP ≥ 25 mm Hg and PVR ≥ 2.5-3Wood units (or a
TPG ≥ 12-15 mm Hg) in the presence of PAWP > 15
mm Hg.
• Both TPG and PVR are flow-dependent and may not
accurately reflect the presence of intrinsic
pulmonary arteriolar remodeling.
32. DIASTOLIC PRESSURE DIFFERENCE (DPD)
• DPD = dPAP – meanPCWP
• DPD is not flow dependent and has been shown to more
accurately identify the presence of pre-capillary
pulmonary arteriolar remodeling.
• In normal subjects,DPD is 1-3 mm Hg.
• Isolated post-capillary (mean PAP ≥ 25mm Hg,
PAWP > 15 mm Hg, and DPG < 7 mm Hg)
• Combined post-capillary and pre-capillaryPH
(mean PAP ≥ 25 mm HG, PAWP > 15 mm Hg, and DPG
≥ 7 mm Hg)
Journal of the American College of Cardiology Vol. 62, No. 25, 2013
33. Current Definition and Classification
of PH-LHD
TERMINOLOGY PCWP DIASTOLIC PAP –
PAWP (DPD)
ISOLATED POST
CAPILLARY
>15 mm Hg <7 mm Hg
COMBINED POST
CAPILLARY AND
PRE CAPILLARY
>15 mm Hg >7 mm Hg
Journal of the American College of Cardiology Vol. 62, No. 25, 2013
Proposed relationship between LV dysfunction and secondary events that may contribute to development of pulmonary hypertension. Increase in pulmonary ET and/or reduction in endothelium-derived NO may cause pathophysiological changes in vessel structure and function, which adversely affect long-term morbidity and mortality. EDP indicates end-diastolic pressure; EC, endothelial cell.
Diagram showing the various hemodynamic stages observed in group 2 PH. A, Passive. The increase in pulmonary artery pressure (PAP) is thought to be exclusively due to downstream left atrial pressure (LAP) elevation and no component of the PH seems to result from abnormalities intrinsic to the arterial wall. B, Reactive. The increase in PAP is due to intrinsic vascular changes in addition to elevated LAP. The TPG is increased and may or may not reverse under pharmacological challenge. C, Out of proportion increase in PH. This condition refers to some cases of TPG increase occurring in the presence of mild or no increase in PCWP. The pathobiological arterial changes of this condition are not well defined, even though some evolving reactive precapillary component is thought to take place earlier in the expected course of the disease. PH indicates pulmonary hypertension; TPG, transpulmonary gradient; PCWP, pulmonary capillary wedge pressure; RV, right ventricle; and LA, left atrium.
Figure 1. Pulmonary occlusive venopathy. A, Septal veins with nearly occluded lumens by fibrous intimal thickening (asterisk), marked lymphatic dilation (arrow), and congested alveolar capillaries. Verhoeff–van Gieson stain; magnification ×50. B, Obstructive fibrous intimal thickening and recanalization channels in a septal vein; pulmonary microvasculopathy. Magnification ×200. C, Focal thickening of alveolar septa by proliferated capillaries. Hematoxylin-eosin stain; magnification ×20. D, Nodular capillary proliferation, hemosiderin-laden alveolar macrophages, and type II pneumocytes (arrows); pulmonary venous disease. Hematoxylin-eosin stain; magnification ×300. Reprinted from Pietra et al,79 with permission from Elsevier. Copyright 2004, American College of Cardiology Foundation.
Distribution of PVR and TPG in a patients with group 2 PH due to HFrEF and HFpEF. Data show a high prevalence of reactive PH, where 80% to 90% of patients with HFrEF and HFpEF displayed PVR >1.7 WU (2 SDs beyond normal), and over half displayed PVR >3 WU or TPG >15 mm Hg. Data adapted from Schwartzenberg et al.23 PVR indicates pulmonary vascular resistance; TPG, transpulmonary gradient; IQR, interquartile range; HFrEF, heart failure with reduced ejection fraction; and HFpEF, heart failure with preserved ejection fraction.