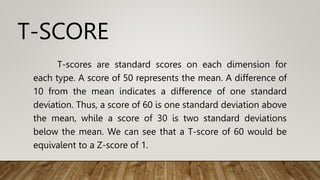
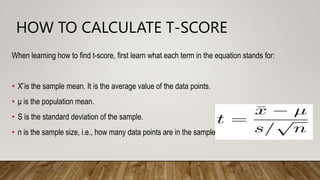
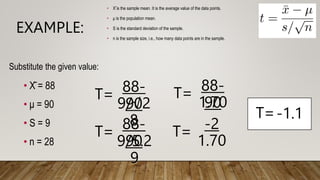
T-SCORE
CARLO ANTHONY D. DALOGDOG
T-SCORE
T-scores are standard scores on each dimension for
each type. A score of 50 represents the mean. A difference of
10 from the mean indicates a difference of one standard
deviation. Thus, a score of 60 is one standard deviation above
the mean, while a score of 30 is two standard deviations
below the mean. We can see that a T-score of 60 would be
equivalent to a Z-score of 1.
A standard deviation is how far
from the population mean a point
would have to be to fall outside of the
middle 68.2% of the data in
a normal (i.e., bell curve) distribution.
On either side of the mean, the first standard deviation contains 34.1% of the data,
the second has 13.6%, and the third has 2.1%. Because those percentages are for one side of
the mean, doubling them gives the total percentage of the data that falls within a given
number of standard deviations bidirectionally. In this figure, μ is the mean and σ means a
standard deviation.
When learning how to find t-score, first learn what each term in the equation stands for:
• X̄ is the sample mean. It is the average value of the data points.
• μ is the population mean.
• S is the standard deviation of the sample.
• n is the sample size, i.e., how many data points are in the sample.
HOW TO CALCULATE T-SCORE
• X̄ is the sample mean. It is the average value of the data points.
• μ is the population mean.
• S is the standard deviation of the sample.
• n is the sample size, i.e., how many data points are in the sample.
EXAMPLE:
Healthy people dream, on average, 90 minutes each night. An
investigator wants to determine if coffee affects this rate. He gives 28 people
2 cups of coffee before bed and monitors their dream states. He finds, on
average, 88 minutes with standard deviation of 9 minutes.
• X̄ is the sample mean. It is the average value of the data points.
• μ is the population mean.
• S is the standard deviation of the sample.
• n is the sample size, i.e., how many data points are in the sample.
EXAMPLE:
Substitute the given value:
• X̄ = 88
• μ = 90
• S = 9
• n = 28
T= 88-
90
9/√2
8
T= 88-
90
9/5.2
9
T= 88-
90
1.70
T= -2
1.70
T=-1.1
STANINE
Stanine is a type of scaled score used in many norm referenced
standardized test. There are nine stanine units or “standard nine-
point scale”, ranging from 9-1.
(9, 8, 7)- above average
(6, 5, 4)- average
(3, 2, 1)- below average
WHY WE CALCULATE A T-
SCORE?
THANK YOU!

Finding the T-SCORE: a sample report.pptx

  • 1.
  • 2.
    T-SCORE T-scores are standardscores on each dimension for each type. A score of 50 represents the mean. A difference of 10 from the mean indicates a difference of one standard deviation. Thus, a score of 60 is one standard deviation above the mean, while a score of 30 is two standard deviations below the mean. We can see that a T-score of 60 would be equivalent to a Z-score of 1.
  • 3.
    A standard deviationis how far from the population mean a point would have to be to fall outside of the middle 68.2% of the data in a normal (i.e., bell curve) distribution. On either side of the mean, the first standard deviation contains 34.1% of the data, the second has 13.6%, and the third has 2.1%. Because those percentages are for one side of the mean, doubling them gives the total percentage of the data that falls within a given number of standard deviations bidirectionally. In this figure, μ is the mean and σ means a standard deviation.
  • 4.
    When learning howto find t-score, first learn what each term in the equation stands for: • X̄ is the sample mean. It is the average value of the data points. • μ is the population mean. • S is the standard deviation of the sample. • n is the sample size, i.e., how many data points are in the sample. HOW TO CALCULATE T-SCORE
  • 5.
    • X̄ isthe sample mean. It is the average value of the data points. • μ is the population mean. • S is the standard deviation of the sample. • n is the sample size, i.e., how many data points are in the sample. EXAMPLE: Healthy people dream, on average, 90 minutes each night. An investigator wants to determine if coffee affects this rate. He gives 28 people 2 cups of coffee before bed and monitors their dream states. He finds, on average, 88 minutes with standard deviation of 9 minutes.
  • 6.
    • X̄ isthe sample mean. It is the average value of the data points. • μ is the population mean. • S is the standard deviation of the sample. • n is the sample size, i.e., how many data points are in the sample. EXAMPLE: Substitute the given value: • X̄ = 88 • μ = 90 • S = 9 • n = 28 T= 88- 90 9/√2 8 T= 88- 90 9/5.2 9 T= 88- 90 1.70 T= -2 1.70 T=-1.1
  • 7.
    STANINE Stanine is atype of scaled score used in many norm referenced standardized test. There are nine stanine units or “standard nine- point scale”, ranging from 9-1. (9, 8, 7)- above average (6, 5, 4)- average (3, 2, 1)- below average
  • 8.
    WHY WE CALCULATEA T- SCORE?
  • 9.