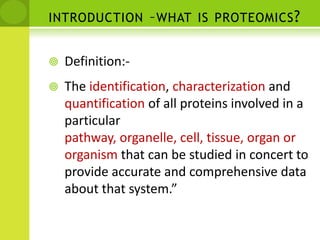
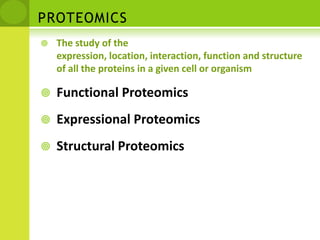
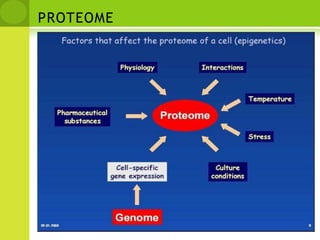
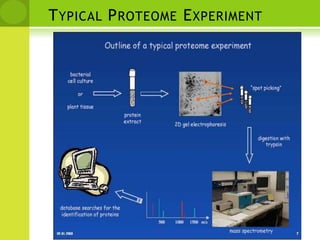
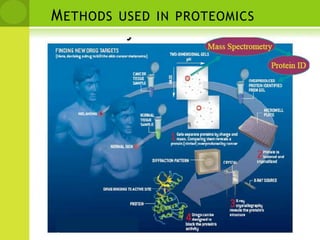
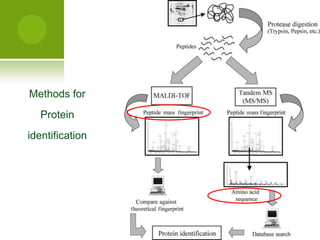
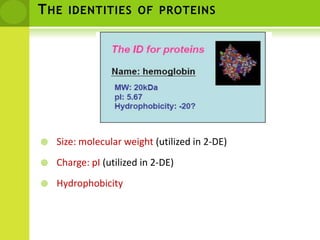
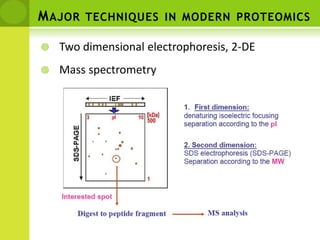
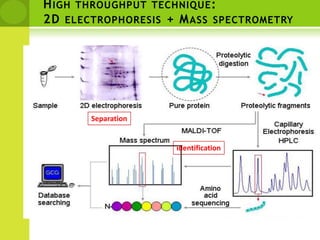
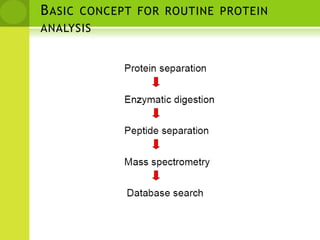
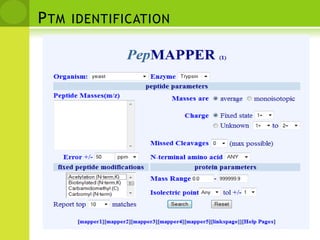
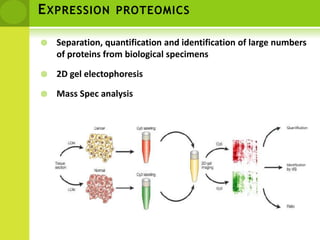
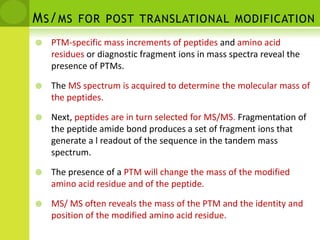
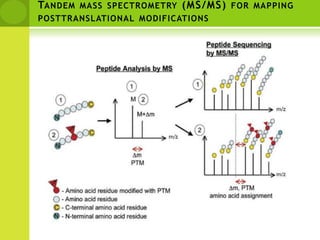
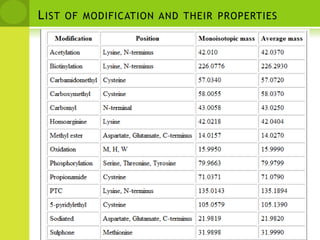
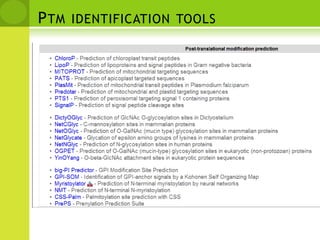
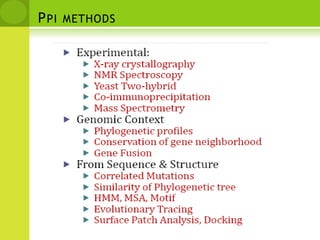
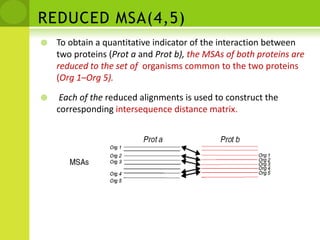
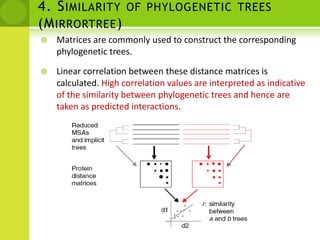
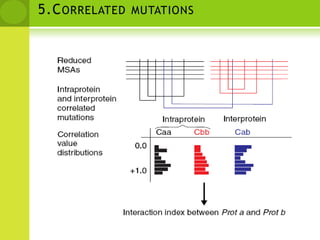
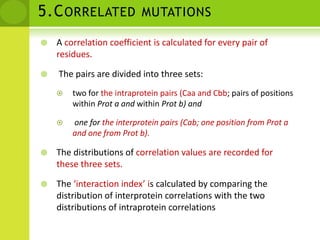
PROTEOMICSMs.ruchiyadavlectureramity institute of biotechnologyamity universitylucknow(up)
introduction –what is proteomics?Definition:-The identification, characterization and quantification of all proteins involved in a particular pathway, organelle, cell, tissue, organ or organism that can be studied in concert to provide accurate and comprehensive data about that system.”
PROTEOMICSThe study of the expression, location, interaction, function and structure of all the proteins in a given cell or organismFunctional ProteomicsExpressional ProteomicsStructural Proteomics
PROTEOMICSFunctional proteomics: What is the function of each product of the 30,000 human geneswhere do protein localize,what do they interact with.( Interactomics)how are they modified (PTM)Structural proteomics:What is the 3D structure of proteins and multi-protein machines?Expression proteomics: What differences in protein expression levels accompany certain  , Aspects of a cell’s physiology? (normal or pathological)
PROTEOME
Typical Proteome Experiment
Methods used in proteomics
Fundamental methods used in proteomics
Methods forProteinidentification
The identities of proteinsSize: molecular weight (utilized in 2-DE)Charge: pI (utilized in 2-DE)Hydrophobicity
Major techniques in modern proteomics Two dimensional electrophoresis, 2-DE Mass spectrometry
Global profiling proteomicsIdentification of protein markers from patient samples
Find the different protein spots on 2-D gels
how is MS used in proteomics ?
Perspective for MS based Proteomics
Principle of mass spectrometry in proteomics
Mass spectrometry:principleMasses of Amino Acid Residues
Peptide FragmentationCollision Induced DissociationH+H...-HN-CH-CO   .  .   .NH-CH-CO-NH-CH-CO-…OHRi-1RiRi+1Prefix FragmentSuffix FragmentPeptides tend to fragment along the backbone . Fragments can also loose neutral chemical groups like NH3 and H2O.
The types of fragment ions observed in an MS/MS spectrum depend on many factors including primary sequence, the amount of internal energy, how the energy was introduced, charge state, etc.Peptide FragmentationFragments will only be detected if they carry at least one charge. If this charge is retained on the N terminal fragment, the ion is classed as either a, b or c.If the charge is retained on the C terminal, the ion type is either x, y or z. A subscript indicates the number of residues in the fragment.
Breaking Protein into Peptides and Peptides into Fragment Ions(ms/ms)Proteases, e.g. trypsin, break protein into peptides.A Tandem Mass Spectrometer further breaks the peptides down into fragment ions and measures the mass of each piece.Mass Spectrometer accelerates the fragmented ions; heavier ions accelerate slower than lighter ones.Mass Spectrometer measure mass/chargeratio of an ion.
N- and C-terminal PeptidesPAGNFAPGNFANPGFC-terminal peptidesN-terminal peptidesANFPGPANFG
Terminal peptides and ion typesPeptideH2OPNGFMass (D)    57  +  97  + 147 + 114  = 415withoutGFN  PeptideH2OPMass (D)    57  +  97  + 147 + 114 – 18 = 397
Peptide FragmentationPeptide: S-G-F-L-E-E-D-E-L-K24
GVDLKL57 Da = ‘G’K  DVG 99 Da = ‘V’H2ODMass Spectramass0The peaks in the mass spectrum:
Prefix and Suffix Fragments.
Fragments with neutral losses(-H2O, -NH3)
Noise and missing peaks.GVDLKPeptide Identification: IntensitymassMS/MS0mass0Protein Identification with MS/MS
Commonly used Mass Spectrometer in ProteomicsMALDI-TOFMatrix Assisted Laser Desorption Ionization Time Of FlightESI tandem MS (with HPLC, LC tandem MS or LC MS/MS)Electro Spray Ionization Mass Spectrometry
Mass spectrometry used to sequence short stretches of polypeptide
Single Stage MSMS
  Tandem Mass Spectrometry(MS/MS)Precursor selection30
 Tandem Mass Spectrometry (MS/MS)Precursor selection + collision induced dissociation(CID)MS/MS
Tandem mass spectrometry
MS FOR PEPTIDE MASS AND SEQUENCE DETECTIONMALDI-TOF
Typical result from MALDI-Tof (spectrum)
High throughput technique:2D electrophoresis + Mass spectrometrySeparationidentification
Basic concept for routine protein analysis
Peptide mass fingerprinting (PMF)
   Principles of Fingerprinting*SequenceMass (M+H)Tryptic Fragmentsacedfhsakdfgeasdfpkivtmeeewendadnfekgwfeacekdfhsadfgeasdfpkivtmeeewenkdadnfeqwfeacedfhsadfgekasdfpkivtmeeewendakdnfegwfe>Protein 1acedfhsakdfqeasdfpkivtmeeewendadnfekqwfe>Protein 2acekdfhsadfqeasdfpkivtmeeewenkdadnfeqwfe>Protein 3acedfhsadfqekasdfpkivtmeeewendakdnfeqwfe4842.054842.054842.05
Principles of FingerprintingSequenceMass (M+H)Mass Spectrum>Protein 1acedfhsakdfqeasdfpkivtmeeewendadnfekqwfe>Protein 2acekdfhsadfqeasdfpkivtmeeewenkdadnfeqwfe>Protein 3acedfhsadfqekasdfpkivtmeeewendakdnfeqwfe4842.054842.054842.05
Data analysis of ms/ms method
Peptide mass fingerprinting (PMF) or mapping
Mass spectrum mappingTop spectrum depicts a theoretical mass spectrum, as might be generated by a sequence search algorithm, matching an actual peptide MS/MS spectrum (bottom).
Computer prog. search databases that contain information
Peptide analysis
Pmf on webMascotwww.matrixscience.comProFoundhttp://129.85.19.192/profound_bin/WebProFound.exeMOWSEhttp://srs.hgmp.mrc.ac.uk/cgi-bin/mowsePeptideSearchhttp://www.narrador.embl-heidelberg.de/GroupPages/Homepage.htmlPeptIdenthttp://us.expasy.org/tools/peptident.html
mascot
mascot
Ptm identification
Expression proteomicsSeparation, quantification and identification of large numbers of proteins from biological specimens2D gel electophoresisMass Spec analysis
Ms/ms for post translational modificationPTM-specific mass increments of peptides and amino acid residues or diagnostic fragment ions in mass spectra reveal the presence of PTMs.The MS spectrum is acquired to determine the molecular mass of the peptides.Next, peptides are in turn selected for MS/MS. Fragmentation of the peptide amide bond produces a set of fragment ions that generate a l readout of the sequence in the tandem mass spectrum.The presence of a PTM will change the mass of the modified amino acid residue and of the peptide. MS/ MS often reveals the mass of the PTM and the identity and position of the modified amino acid residue.
Tandem mass spectrometry (MS/MS) for mapping posttranslational modifications
List of modification and their properties
Ptm identification tools
Protein –protein interaction
Ppi methods
Genomic ContextPhylogenetic profilesConservation of gene neighborhoodGene FusionSimilarity of phylogenetic treesCorrelated mutations
1.Phylogenetic ProfileBased on the pattern of the presence or absence of a given gene in a set of genomesA profile is constructed for each protein (Prot a–Prot d), recording its presence (1) or absence (0) in a set of organismsPairs of proteins with identical (or similar) phylogenetic profiles are predicted to interact (Prot a and Prot c in this case)
2.Gene cluster and gene neighborhood methods,Proteins whose genes are physically close in the genomes of various organisms are predicted to interact.B
3.GENE FUSIONRosetta Stone method: The Rosetta Stone approach infers protein interactions from protein sequences in different genomes . It is based on the observation that some interacting proteins/domains have homologs in other genomes that are fused into one protein chain, a so-called Rosetta Stone protein
REDUCED MSA(4,5)To obtain a quantitative indicator of the interaction between two proteins (Prot a and Prot b), the MSAs of both proteins are reduced to the set of  organisms common to the two proteins (Org 1–Org 5). Each of the reduced alignments is used to construct the corresponding intersequence distance matrix.
4. Similarity of phylogenetic trees (Mirrortree)Matrices are commonly used to construct the corresponding phylogenetic trees. Linear correlation between these distance matrices is calculated. High correlation values are interpreted as indicative of the similarity between phylogenetic trees and hence are taken as predicted interactions.
5.Correlated mutations
5.Correlated mutationsA correlation coefficient is calculated for every pair of residues. The pairs are divided into three sets: two for the intraprotein pairs (Caa and Cbb; pairs of positions within Prot a and within Prot b) and one for the interprotein pairs (Cab; one position from Prot a and one from Prot b).The distributions of correlation values are recorded for these three sets. The ‘interaction index’ is calculated by comparing the distribution of interprotein correlations with the two distributions of intraprotein correlations
6. Classification methods/RDF methodFive different features/domains are used Each interacting protein pair is encoded as a string of 0, 1, and 2. The decision trees are constructed based on the training set of interacting protein pairs .Decisions are made if proteins under the question interact or not (‘‘yes’’ for interacting, ‘‘no’’ for non-interacting).
PPI DATABASE
Protein microarray
types of protein microarraysThree types of protein microarrays are currently used to study the biochemical activities of proteins: Analytical microarrays, Functional microarrays, and Reverse phase microarrays
Analytical microarraysDifferent types of ligands, including antibodies, antigens, DNA or RNA aptamers, carbohydrates or small molecules, with high affinity and specificity, are spotted down onto a derivatized surface. Protein samples from two biological states to be compared are separately labelled with red or green fluorescent dyes, mixed, and incubated with the chips. Spots in red or green colour identify an excess of proteins from one state over the other.These types of microarrays can be used to monitor differential expression profiles and for clinical diagnostics. Examples include profiling responses to environmental stress and healthy versus disease tissues
Functional protein microarraysNative proteins or peptides are individually purified or synthesized using high-throughput approaches and arrayed onto a suitable surface to form the functional protein microarrays. These chips are used to analyse protein activities, binding properties and post-translational modifications. functional protein microarrays can be used to identify the substrates of enzymes of interest. This class of chips is particularly useful in drug and drug-target identification and in building biological networks
Analytical versus functional protein microarrays.
Functional protein microarraysFunctional protein microarrays differ from analytical arrays in that functional protein arrays are composed of arrays containing full-length functional proteins or protein domains.These protein chips are used to study the biochemical activities of an entire proteome in a single experiment. They are used to study numerous protein interactions, such as protein-protein, protein-DNA, protein-RNA, protein-phospholipid, and protein-small molecule interactions
reverse phase protein microarray (RPA)In RPA, cells are isolated from various tissues of interest and are lysed. The lysate is arrayed onto a nitrocellulose slide using a contact pin microarrayer. The slides are then probed with antibodies against the target protein of interest, and the antibodies are typically detected with chemiluminescent, fluorescent, or colorimetric assays.
RPARPAs allow for the determination of the presence of altered proteins that may be the result of disease. Specifically, post-translational modifications, which are typically altered as a result of disease, can be detected using RPAs

Proteomics

  • 1.
    PROTEOMICSMs.ruchiyadavlectureramity institute ofbiotechnologyamity universitylucknow(up)
  • 2.
    introduction –what isproteomics?Definition:-The identification, characterization and quantification of all proteins involved in a particular pathway, organelle, cell, tissue, organ or organism that can be studied in concert to provide accurate and comprehensive data about that system.”
  • 3.
    PROTEOMICSThe study ofthe expression, location, interaction, function and structure of all the proteins in a given cell or organismFunctional ProteomicsExpressional ProteomicsStructural Proteomics
  • 4.
    PROTEOMICSFunctional proteomics: Whatis the function of each product of the 30,000 human geneswhere do protein localize,what do they interact with.( Interactomics)how are they modified (PTM)Structural proteomics:What is the 3D structure of proteins and multi-protein machines?Expression proteomics: What differences in protein expression levels accompany certain , Aspects of a cell’s physiology? (normal or pathological)
  • 5.
  • 6.
  • 7.
    Methods used inproteomics
  • 8.
  • 9.
  • 10.
    The identities ofproteinsSize: molecular weight (utilized in 2-DE)Charge: pI (utilized in 2-DE)Hydrophobicity
  • 11.
    Major techniques inmodern proteomics Two dimensional electrophoresis, 2-DE Mass spectrometry
  • 12.
    Global profiling proteomicsIdentificationof protein markers from patient samples
  • 13.
    Find the differentprotein spots on 2-D gels
  • 14.
    how is MSused in proteomics ?
  • 15.
    Perspective for MSbased Proteomics
  • 16.
    Principle of massspectrometry in proteomics
  • 17.
  • 18.
    Peptide FragmentationCollision InducedDissociationH+H...-HN-CH-CO . . .NH-CH-CO-NH-CH-CO-…OHRi-1RiRi+1Prefix FragmentSuffix FragmentPeptides tend to fragment along the backbone . Fragments can also loose neutral chemical groups like NH3 and H2O.
  • 19.
    The types offragment ions observed in an MS/MS spectrum depend on many factors including primary sequence, the amount of internal energy, how the energy was introduced, charge state, etc.Peptide FragmentationFragments will only be detected if they carry at least one charge. If this charge is retained on the N terminal fragment, the ion is classed as either a, b or c.If the charge is retained on the C terminal, the ion type is either x, y or z. A subscript indicates the number of residues in the fragment.
  • 21.
    Breaking Protein intoPeptides and Peptides into Fragment Ions(ms/ms)Proteases, e.g. trypsin, break protein into peptides.A Tandem Mass Spectrometer further breaks the peptides down into fragment ions and measures the mass of each piece.Mass Spectrometer accelerates the fragmented ions; heavier ions accelerate slower than lighter ones.Mass Spectrometer measure mass/chargeratio of an ion.
  • 22.
    N- and C-terminalPeptidesPAGNFAPGNFANPGFC-terminal peptidesN-terminal peptidesANFPGPANFG
  • 23.
    Terminal peptides andion typesPeptideH2OPNGFMass (D) 57 + 97 + 147 + 114 = 415withoutGFN PeptideH2OPMass (D) 57 + 97 + 147 + 114 – 18 = 397
  • 24.
  • 25.
    GVDLKL57 Da =‘G’K DVG 99 Da = ‘V’H2ODMass Spectramass0The peaks in the mass spectrum:
  • 26.
  • 27.
    Fragments with neutrallosses(-H2O, -NH3)
  • 28.
    Noise and missingpeaks.GVDLKPeptide Identification: IntensitymassMS/MS0mass0Protein Identification with MS/MS
  • 29.
    Commonly used MassSpectrometer in ProteomicsMALDI-TOFMatrix Assisted Laser Desorption Ionization Time Of FlightESI tandem MS (with HPLC, LC tandem MS or LC MS/MS)Electro Spray Ionization Mass Spectrometry
  • 30.
    Mass spectrometry usedto sequence short stretches of polypeptide
  • 31.
  • 32.
    TandemMass Spectrometry(MS/MS)Precursor selection30
  • 33.
    Tandem MassSpectrometry (MS/MS)Precursor selection + collision induced dissociation(CID)MS/MS
  • 34.
  • 35.
    MS FOR PEPTIDEMASS AND SEQUENCE DETECTIONMALDI-TOF
  • 36.
    Typical result fromMALDI-Tof (spectrum)
  • 37.
    High throughput technique:2Delectrophoresis + Mass spectrometrySeparationidentification
  • 38.
    Basic concept forroutine protein analysis
  • 39.
  • 40.
  • 41.
    Principles of Fingerprinting*SequenceMass (M+H)Tryptic Fragmentsacedfhsakdfgeasdfpkivtmeeewendadnfekgwfeacekdfhsadfgeasdfpkivtmeeewenkdadnfeqwfeacedfhsadfgekasdfpkivtmeeewendakdnfegwfe>Protein 1acedfhsakdfqeasdfpkivtmeeewendadnfekqwfe>Protein 2acekdfhsadfqeasdfpkivtmeeewenkdadnfeqwfe>Protein 3acedfhsadfqekasdfpkivtmeeewendakdnfeqwfe4842.054842.054842.05
  • 42.
    Principles of FingerprintingSequenceMass(M+H)Mass Spectrum>Protein 1acedfhsakdfqeasdfpkivtmeeewendadnfekqwfe>Protein 2acekdfhsadfqeasdfpkivtmeeewenkdadnfeqwfe>Protein 3acedfhsadfqekasdfpkivtmeeewendakdnfeqwfe4842.054842.054842.05
  • 43.
    Data analysis ofms/ms method
  • 44.
  • 45.
    Mass spectrum mappingTopspectrum depicts a theoretical mass spectrum, as might be generated by a sequence search algorithm, matching an actual peptide MS/MS spectrum (bottom).
  • 46.
    Computer prog. searchdatabases that contain information
  • 47.
  • 48.
  • 49.
  • 50.
  • 51.
  • 52.
    Expression proteomicsSeparation, quantificationand identification of large numbers of proteins from biological specimens2D gel electophoresisMass Spec analysis
  • 53.
    Ms/ms for posttranslational modificationPTM-specific mass increments of peptides and amino acid residues or diagnostic fragment ions in mass spectra reveal the presence of PTMs.The MS spectrum is acquired to determine the molecular mass of the peptides.Next, peptides are in turn selected for MS/MS. Fragmentation of the peptide amide bond produces a set of fragment ions that generate a l readout of the sequence in the tandem mass spectrum.The presence of a PTM will change the mass of the modified amino acid residue and of the peptide. MS/ MS often reveals the mass of the PTM and the identity and position of the modified amino acid residue.
  • 54.
    Tandem mass spectrometry(MS/MS) for mapping posttranslational modifications
  • 55.
    List of modificationand their properties
  • 56.
  • 57.
  • 58.
  • 59.
    Genomic ContextPhylogenetic profilesConservationof gene neighborhoodGene FusionSimilarity of phylogenetic treesCorrelated mutations
  • 60.
    1.Phylogenetic ProfileBased onthe pattern of the presence or absence of a given gene in a set of genomesA profile is constructed for each protein (Prot a–Prot d), recording its presence (1) or absence (0) in a set of organismsPairs of proteins with identical (or similar) phylogenetic profiles are predicted to interact (Prot a and Prot c in this case)
  • 61.
    2.Gene cluster andgene neighborhood methods,Proteins whose genes are physically close in the genomes of various organisms are predicted to interact.B
  • 62.
    3.GENE FUSIONRosetta Stonemethod: The Rosetta Stone approach infers protein interactions from protein sequences in different genomes . It is based on the observation that some interacting proteins/domains have homologs in other genomes that are fused into one protein chain, a so-called Rosetta Stone protein
  • 63.
    REDUCED MSA(4,5)To obtaina quantitative indicator of the interaction between two proteins (Prot a and Prot b), the MSAs of both proteins are reduced to the set of organisms common to the two proteins (Org 1–Org 5). Each of the reduced alignments is used to construct the corresponding intersequence distance matrix.
  • 64.
    4. Similarity ofphylogenetic trees (Mirrortree)Matrices are commonly used to construct the corresponding phylogenetic trees. Linear correlation between these distance matrices is calculated. High correlation values are interpreted as indicative of the similarity between phylogenetic trees and hence are taken as predicted interactions.
  • 65.
  • 66.
    5.Correlated mutationsA correlationcoefficient is calculated for every pair of residues. The pairs are divided into three sets: two for the intraprotein pairs (Caa and Cbb; pairs of positions within Prot a and within Prot b) and one for the interprotein pairs (Cab; one position from Prot a and one from Prot b).The distributions of correlation values are recorded for these three sets. The ‘interaction index’ is calculated by comparing the distribution of interprotein correlations with the two distributions of intraprotein correlations
  • 67.
    6. Classification methods/RDFmethodFive different features/domains are used Each interacting protein pair is encoded as a string of 0, 1, and 2. The decision trees are constructed based on the training set of interacting protein pairs .Decisions are made if proteins under the question interact or not (‘‘yes’’ for interacting, ‘‘no’’ for non-interacting).
  • 68.
  • 69.
  • 70.
    types of proteinmicroarraysThree types of protein microarrays are currently used to study the biochemical activities of proteins: Analytical microarrays, Functional microarrays, and Reverse phase microarrays
  • 71.
    Analytical microarraysDifferent typesof ligands, including antibodies, antigens, DNA or RNA aptamers, carbohydrates or small molecules, with high affinity and specificity, are spotted down onto a derivatized surface. Protein samples from two biological states to be compared are separately labelled with red or green fluorescent dyes, mixed, and incubated with the chips. Spots in red or green colour identify an excess of proteins from one state over the other.These types of microarrays can be used to monitor differential expression profiles and for clinical diagnostics. Examples include profiling responses to environmental stress and healthy versus disease tissues
  • 72.
    Functional protein microarraysNativeproteins or peptides are individually purified or synthesized using high-throughput approaches and arrayed onto a suitable surface to form the functional protein microarrays. These chips are used to analyse protein activities, binding properties and post-translational modifications. functional protein microarrays can be used to identify the substrates of enzymes of interest. This class of chips is particularly useful in drug and drug-target identification and in building biological networks
  • 73.
    Analytical versus functionalprotein microarrays.
  • 74.
    Functional protein microarraysFunctionalprotein microarrays differ from analytical arrays in that functional protein arrays are composed of arrays containing full-length functional proteins or protein domains.These protein chips are used to study the biochemical activities of an entire proteome in a single experiment. They are used to study numerous protein interactions, such as protein-protein, protein-DNA, protein-RNA, protein-phospholipid, and protein-small molecule interactions
  • 75.
    reverse phase proteinmicroarray (RPA)In RPA, cells are isolated from various tissues of interest and are lysed. The lysate is arrayed onto a nitrocellulose slide using a contact pin microarrayer. The slides are then probed with antibodies against the target protein of interest, and the antibodies are typically detected with chemiluminescent, fluorescent, or colorimetric assays.
  • 76.
    RPARPAs allow forthe determination of the presence of altered proteins that may be the result of disease. Specifically, post-translational modifications, which are typically altered as a result of disease, can be detected using RPAs
  • 78.
  • 79.