Download as PDF, PPTX

![Explanation: propagated
13
A discussion on ODRL action dependencies and how they
a↵ect the policy semantics is included in [13]. Nonetheless, to
the best of our knowledge, the first attempt to analyse how
policies can propagate in manipulation processes is the one
presented in one of our earlier papers [6]. In [6] we introduced
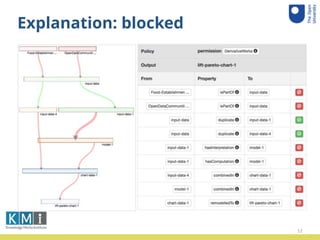
Figure 1: Explanation: propagation trace.](https://image.slidesharecdn.com/enridaga-kcap2017-171205175530/85/Propagating-Data-Policies-A-User-Study-13-320.jpg)

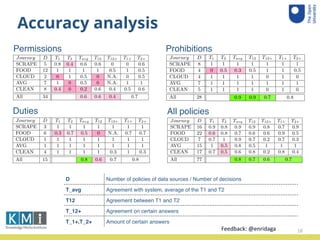


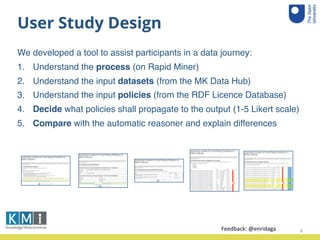
The document summarizes a user study conducted to evaluate a system that propagates data policies in data flows. 10 participant teams were given 5 data journeys involving real datasets and processes to determine what policies should propagate from input to output. The teams used a tool to understand the journeys and compare their decisions to the system. An accuracy analysis was conducted on the results and teams provided feedback through a questionnaire.