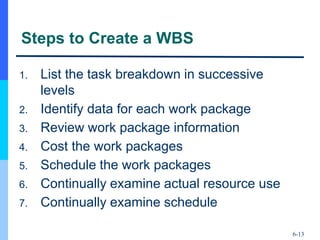
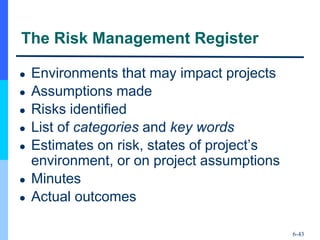
Chapter 6
Project Activity and Risk Planning
6-2
Initial Project Coordination and the
Project Charter
● Early meetings are used to decide on
participating in the project
● Used to “flesh out” the nature of the
project
● Outcomes include:
– Technical scope
– Areas of responsibility
– Delivery dates or budgets
– Risk management group
6-3
Outside Clients
● When it is for outside clients,
specifications cannot be changed without
the client’s permission
● Client may place budget constraints on
the project
● May be competing against other firms
6-4
Project Charter Elements
● Purpose
● Objectives
● Overview
● Schedules
● Resources
● Personnel
● Risk management plans
● Evaluation methods
6-5
Systems Integration
● Performance
● Effectiveness
● Cost
6-6
Starting the Project Plan: The WBS
● What is to be done
● When it is to be started and finished
● Who is going to do it
6-7
Starting the Project Plan: The WBS
Continued
● Some activities must be done
sequentially
● Some activities may be done
simultaneously
● Many things must happen when and how
they are supposed to happen
● Each detail is uncertain and subjected to
risk
6-8
Hierarchical Planning
● Major tasks are listed
● Each major task is broken down into
detail
● This continues until all the activities to be
completed are listed
● Need to know which activities “depend
on” other activities
6-9
A Form to Assist Hierarchical Planning
6-10
Career Day
6-11
The Work Breakdown Structure (WBS)
● A hierarchical planning process
● Breaks tasks down into successively finer
levels of detail
● Continues until all meaningful tasks or
work packages have been identified
● These make tracking the work easier
● Need separate budget/schedule for each
task or work package
6-12
A Visual WBS
6-13
Steps to Create a WBS
1. List the task breakdown in successive
levels
2. Identify data for each work package
3. Review work package information
4. Cost the work packages
5. Schedule the work packages
6. Continually examine actual resource use
7. Continually examine schedule
6-14
Human Resources
● Useful to create a table that shows staff
needed to execute WBS tasks
● One approach is a organizational
breakdown structure
– Organizational units responsible for each
WBS element
– Who must approve changes of scope
– Who must be notified of progress
● WBS and OBS may not be identical
6-15
The Responsibility (RACI) Matrix
● Another approach is the Responsible,
Accountable, Consult, Inform (RACI)
matrix
– Also known as a responsibility matrix, a
linear responsibility chart, an assignment
matrix, a responsibility assignment matrix
● Shows critical interfaces
● Keeps track of who must approve what
and who must be notified
6-16
Sample RACI Matrix
6-17
Agile Project Planning and Management
● When scope cannot be determined in advance,
traditional planning does not work
● Agile project management was developed to
deal with this problem in IT
● Small teams are located at a single site
● Entire team collaborates
● Team deals with one requirement at-a-time with
the scope frozen
Kloppenborg, Contemporary Project Management, 4th Edition. © 2019 Cengage. All Rights Reserved. May not be scanned,
copied or duplicated, or posted to a publicly accessible website, in whole or in part.
Construction Project Life Cycle
EXHIBIT 4.12: Construction Project Life Cycle Model
● Source: Adapted from James D. Stevens, Timothy J. Kloppenborg, and Charles R. Glagola, Quality
Performance Measurements of the EPC Process: The Blueprint (Austin, TX: Construction Industry Institute, 19
94): 16.
Kloppenborg, Contemporary Project Management, 4th Edition. © 2019 Cengage. All Rights Reserved. May not be scanned,
copied or duplicated, or posted to a publicly accessible website, in whole or in part.
Agile Project Life
Cycle Model
6-20
Interface Coordination Through
Integration Management
● Managing a project requires a great deal
of coordination
● Projects typically draw from many parts of
the organization as well as outsiders
● All of these must be coordinated
● The RACI matrix helps the project
manager accomplish this
6-21
Integration Management
● Coordinating the work and timing of
different groups
● Interface coordination is the process of
managing this work across multiple
groups
● Using multidisciplinary teams to plan the
project
– Requires structure
6-22
Managing Projects by Phases and
Phase-Gates
● Break objectives into shorter term sub-
objectives
● Project life cycle is used for breaking a
project up into component phases
● Focus on specific, short-term output
● Lots of feedback between disciplines
THE RISK EVENT GRAPH
7–23
6-24
Parts to Risk Management
● Risk management planning
● Risk identification
● Qualitative risk analysis
● Quantitative risk analysis
● Risk response planning
● Risk monitoring and control
● The risk management register
6-25
Risk Management Planning
● Need to know the risk involved before selecting
a project
● Risk management plan must be carried out
before the project can be formally selected
● At first, focus is on externalities
– Track and estimate project survival
● Project risks take shape during planning
● Often handled by project office
6-26
Risk Identification
● Risk is dependent on technology and
environmental factors
● Delphi method is useful for identifying
project risks
● Other methods include brainstorming,
nominal group techniques, checklists, and
attribute listing
● May also use cause-effect diagrams, flow
charts, influence charts, SWOT analysis
THE RISK BREAKDOWN STRUCTURE
(RBS)
7–27
FIGURE 7.3
PARTIAL RISK PROFILE FOR PRODUCT
DEVELOPMENT PROJECT
7–28
6-29
Qualitative Risk Analysis
● Purpose is to prioritize risks
● A sense of the impact is also needed
● Each objective should be scaled and
weighted
● Construct a risk matrix
● Same approach can be used for
opportunities
DEFINED CONDITIONS FOR IMPACT SCALES OF A
RISK ON MAJOR PROJECT OBJECTIVES
(EXAMPLES FOR NEGATIVE IMPACTS ONLY)
7–30
RISK SEVERITY MATRIX
7–31
User
Backlash
Interface
problems
System
freezing
Hardware
malfunc-
tioning
Likelihood
Impact
Red zone (major risk)
Yellow zone (moderate risk)
Green zone (minor risk)
5
5
4
4
3
3
2
2
1
1
6-32
Risk Matrix
6-33
Quantitative Risk Analysis
1. List ways a project can fail
2. Evaluate severity
3. Estimate likelihood
4. Estimate the inability to detect
5. Find the risk priority number (RPN)
(RPN = S × L × D)
6. Consider ways to reduce the S, L, and
D for each cause of failure
6-34
A FMEA Example
RISK ASSESSMENT FORM
7–35
6-36
Decision Tree Analysis
Kloppenborg, Contemporary Project Management, 4th Edition. © 2019 Cengage. All Rights Reserved. May not be scanned,
copied or duplicated, or posted to a publicly accessible website, in whole or in part.
Cause and Effect Diagram
Kloppenborg, Contemporary Project Management, 4th Edition. © 2019 Cengage. All Rights Reserved. May not be scanned,
copied or duplicated, or posted to a publicly accessible website, in whole or in part.
Common Quantitative Risk Analysis Techniques (1 of 2)
Decision tree analysis A graphic tool depicting alternative choices as
branches, multiple options for each alternative,
& evaluating potential outcomes in terms of
uncertainty and monetary value
Expected monetary value (EV
A) analysis
A statistical technique to calculate present
value of future outcomes to choose the best
alternative
Failure mode and effect
analysis (FMEA)
“A step by step approach for identifying all
possible failures in a design, a manufacturing
or assembly process, or a product or service.”
~Practice Standard for Project Risk
Management (PMI)
Kloppenborg, Contemporary Project Management, 4th Edition. © 2019 Cengage. All Rights Reserved. May not be scanned,
copied or duplicated, or posted to a publicly accessible website, in whole or in part.
Common Quantitative Risk Analysis Techniques (2 of 2)
Sensitivity
analysis
A quantitative what-if risk analysis technique that presents
comparative analyses of various desirable outcomes with
respect to a financial measure or uncertainty…can be used to
determine which risks have the most impact on the project
outcomes or goals.
i.e. Tornado diagram
Simulation A technique that mimics real situations using uncertainties and
assessing their impact on project objectives.
i.e. Monte Carlo
6-40
Risk Response Planning
Threats
– Avoid
– Transfer
– Mitigate
– Accept
Opportunities
– Exploit
– Share
– Enhance
– Accept
Kloppenborg, Contemporary Project Management, 4th Edition. © 2019 Cengage. All Rights Reserved. May not be scanned,
copied or duplicated, or posted to a publicly accessible website, in whole or in part.
Strategies for responding to risks
STRATEGY TYPE OF RISK EXAMPLES
Avoid Threat 1. Change project plan and/or scope
2. Improve project communications
3. Decide not to perform project
Transfer Threat 1. Insurance
2. Fixed-price contract
3. Hire expert
Mitigate Threat 1. Lower probability and/or impact of threat
2. Build in redundancy
3. Use more reliable methods
Accept Threat and opportunity 1. Deal with it if and when it happens
2. Establish triggers and update frequently
3. Establish time and/or cost contingencies
Research Threat and opportunity 1. Get more and/or better information
2. Verify assumptions
3. Use prototype
Exploit Opportunity 1. Assign talented resources to project
2. Give more emphasis to project
Share Opportunity 1. Allocate partial ownership to third party
2. Form joint venture
Enhance Opportunity 1. Increase probability and/or positive impact
2. Identify and maximize key drivers
3. Add more resources
6-42
Risk Monitoring and Control
● Monitoring covered in detail in Chapter 10
● Control covered in Chapter 11
6-43
The Risk Management Register
● Environments that may impact projects
● Assumptions made
● Risks identified
● List of categories and key words
● Estimates on risk, states of project’s
environment, or on project assumptions
● Minutes
● Actual outcomes

Project Planning & Work breakdown Structure.pptx

  • 1.
    Chapter 6 Project Activityand Risk Planning
  • 2.
    6-2 Initial Project Coordinationand the Project Charter ● Early meetings are used to decide on participating in the project ● Used to “flesh out” the nature of the project ● Outcomes include: – Technical scope – Areas of responsibility – Delivery dates or budgets – Risk management group
  • 3.
    6-3 Outside Clients ● Whenit is for outside clients, specifications cannot be changed without the client’s permission ● Client may place budget constraints on the project ● May be competing against other firms
  • 4.
    6-4 Project Charter Elements ●Purpose ● Objectives ● Overview ● Schedules ● Resources ● Personnel ● Risk management plans ● Evaluation methods
  • 5.
  • 6.
    6-6 Starting the ProjectPlan: The WBS ● What is to be done ● When it is to be started and finished ● Who is going to do it
  • 7.
    6-7 Starting the ProjectPlan: The WBS Continued ● Some activities must be done sequentially ● Some activities may be done simultaneously ● Many things must happen when and how they are supposed to happen ● Each detail is uncertain and subjected to risk
  • 8.
    6-8 Hierarchical Planning ● Majortasks are listed ● Each major task is broken down into detail ● This continues until all the activities to be completed are listed ● Need to know which activities “depend on” other activities
  • 9.
    6-9 A Form toAssist Hierarchical Planning
  • 10.
  • 11.
    6-11 The Work BreakdownStructure (WBS) ● A hierarchical planning process ● Breaks tasks down into successively finer levels of detail ● Continues until all meaningful tasks or work packages have been identified ● These make tracking the work easier ● Need separate budget/schedule for each task or work package
  • 12.
  • 13.
    6-13 Steps to Createa WBS 1. List the task breakdown in successive levels 2. Identify data for each work package 3. Review work package information 4. Cost the work packages 5. Schedule the work packages 6. Continually examine actual resource use 7. Continually examine schedule
  • 14.
    6-14 Human Resources ● Usefulto create a table that shows staff needed to execute WBS tasks ● One approach is a organizational breakdown structure – Organizational units responsible for each WBS element – Who must approve changes of scope – Who must be notified of progress ● WBS and OBS may not be identical
  • 15.
    6-15 The Responsibility (RACI)Matrix ● Another approach is the Responsible, Accountable, Consult, Inform (RACI) matrix – Also known as a responsibility matrix, a linear responsibility chart, an assignment matrix, a responsibility assignment matrix ● Shows critical interfaces ● Keeps track of who must approve what and who must be notified
  • 16.
  • 17.
    6-17 Agile Project Planningand Management ● When scope cannot be determined in advance, traditional planning does not work ● Agile project management was developed to deal with this problem in IT ● Small teams are located at a single site ● Entire team collaborates ● Team deals with one requirement at-a-time with the scope frozen
  • 18.
    Kloppenborg, Contemporary ProjectManagement, 4th Edition. © 2019 Cengage. All Rights Reserved. May not be scanned, copied or duplicated, or posted to a publicly accessible website, in whole or in part. Construction Project Life Cycle EXHIBIT 4.12: Construction Project Life Cycle Model ● Source: Adapted from James D. Stevens, Timothy J. Kloppenborg, and Charles R. Glagola, Quality Performance Measurements of the EPC Process: The Blueprint (Austin, TX: Construction Industry Institute, 19 94): 16.
  • 19.
    Kloppenborg, Contemporary ProjectManagement, 4th Edition. © 2019 Cengage. All Rights Reserved. May not be scanned, copied or duplicated, or posted to a publicly accessible website, in whole or in part. Agile Project Life Cycle Model
  • 20.
    6-20 Interface Coordination Through IntegrationManagement ● Managing a project requires a great deal of coordination ● Projects typically draw from many parts of the organization as well as outsiders ● All of these must be coordinated ● The RACI matrix helps the project manager accomplish this
  • 21.
    6-21 Integration Management ● Coordinatingthe work and timing of different groups ● Interface coordination is the process of managing this work across multiple groups ● Using multidisciplinary teams to plan the project – Requires structure
  • 22.
    6-22 Managing Projects byPhases and Phase-Gates ● Break objectives into shorter term sub- objectives ● Project life cycle is used for breaking a project up into component phases ● Focus on specific, short-term output ● Lots of feedback between disciplines
  • 23.
    THE RISK EVENTGRAPH 7–23
  • 24.
    6-24 Parts to RiskManagement ● Risk management planning ● Risk identification ● Qualitative risk analysis ● Quantitative risk analysis ● Risk response planning ● Risk monitoring and control ● The risk management register
  • 25.
    6-25 Risk Management Planning ●Need to know the risk involved before selecting a project ● Risk management plan must be carried out before the project can be formally selected ● At first, focus is on externalities – Track and estimate project survival ● Project risks take shape during planning ● Often handled by project office
  • 26.
    6-26 Risk Identification ● Riskis dependent on technology and environmental factors ● Delphi method is useful for identifying project risks ● Other methods include brainstorming, nominal group techniques, checklists, and attribute listing ● May also use cause-effect diagrams, flow charts, influence charts, SWOT analysis
  • 27.
    THE RISK BREAKDOWNSTRUCTURE (RBS) 7–27 FIGURE 7.3
  • 28.
    PARTIAL RISK PROFILEFOR PRODUCT DEVELOPMENT PROJECT 7–28
  • 29.
    6-29 Qualitative Risk Analysis ●Purpose is to prioritize risks ● A sense of the impact is also needed ● Each objective should be scaled and weighted ● Construct a risk matrix ● Same approach can be used for opportunities
  • 30.
    DEFINED CONDITIONS FORIMPACT SCALES OF A RISK ON MAJOR PROJECT OBJECTIVES (EXAMPLES FOR NEGATIVE IMPACTS ONLY) 7–30
  • 31.
    RISK SEVERITY MATRIX 7–31 User Backlash Interface problems System freezing Hardware malfunc- tioning Likelihood Impact Redzone (major risk) Yellow zone (moderate risk) Green zone (minor risk) 5 5 4 4 3 3 2 2 1 1
  • 32.
  • 33.
    6-33 Quantitative Risk Analysis 1.List ways a project can fail 2. Evaluate severity 3. Estimate likelihood 4. Estimate the inability to detect 5. Find the risk priority number (RPN) (RPN = S × L × D) 6. Consider ways to reduce the S, L, and D for each cause of failure
  • 34.
  • 35.
  • 36.
  • 37.
    Kloppenborg, Contemporary ProjectManagement, 4th Edition. © 2019 Cengage. All Rights Reserved. May not be scanned, copied or duplicated, or posted to a publicly accessible website, in whole or in part. Cause and Effect Diagram
  • 38.
    Kloppenborg, Contemporary ProjectManagement, 4th Edition. © 2019 Cengage. All Rights Reserved. May not be scanned, copied or duplicated, or posted to a publicly accessible website, in whole or in part. Common Quantitative Risk Analysis Techniques (1 of 2) Decision tree analysis A graphic tool depicting alternative choices as branches, multiple options for each alternative, & evaluating potential outcomes in terms of uncertainty and monetary value Expected monetary value (EV A) analysis A statistical technique to calculate present value of future outcomes to choose the best alternative Failure mode and effect analysis (FMEA) “A step by step approach for identifying all possible failures in a design, a manufacturing or assembly process, or a product or service.” ~Practice Standard for Project Risk Management (PMI)
  • 39.
    Kloppenborg, Contemporary ProjectManagement, 4th Edition. © 2019 Cengage. All Rights Reserved. May not be scanned, copied or duplicated, or posted to a publicly accessible website, in whole or in part. Common Quantitative Risk Analysis Techniques (2 of 2) Sensitivity analysis A quantitative what-if risk analysis technique that presents comparative analyses of various desirable outcomes with respect to a financial measure or uncertainty…can be used to determine which risks have the most impact on the project outcomes or goals. i.e. Tornado diagram Simulation A technique that mimics real situations using uncertainties and assessing their impact on project objectives. i.e. Monte Carlo
  • 40.
    6-40 Risk Response Planning Threats –Avoid – Transfer – Mitigate – Accept Opportunities – Exploit – Share – Enhance – Accept
  • 41.
    Kloppenborg, Contemporary ProjectManagement, 4th Edition. © 2019 Cengage. All Rights Reserved. May not be scanned, copied or duplicated, or posted to a publicly accessible website, in whole or in part. Strategies for responding to risks STRATEGY TYPE OF RISK EXAMPLES Avoid Threat 1. Change project plan and/or scope 2. Improve project communications 3. Decide not to perform project Transfer Threat 1. Insurance 2. Fixed-price contract 3. Hire expert Mitigate Threat 1. Lower probability and/or impact of threat 2. Build in redundancy 3. Use more reliable methods Accept Threat and opportunity 1. Deal with it if and when it happens 2. Establish triggers and update frequently 3. Establish time and/or cost contingencies Research Threat and opportunity 1. Get more and/or better information 2. Verify assumptions 3. Use prototype Exploit Opportunity 1. Assign talented resources to project 2. Give more emphasis to project Share Opportunity 1. Allocate partial ownership to third party 2. Form joint venture Enhance Opportunity 1. Increase probability and/or positive impact 2. Identify and maximize key drivers 3. Add more resources
  • 42.
    6-42 Risk Monitoring andControl ● Monitoring covered in detail in Chapter 10 ● Control covered in Chapter 11
  • 43.
    6-43 The Risk ManagementRegister ● Environments that may impact projects ● Assumptions made ● Risks identified ● List of categories and key words ● Estimates on risk, states of project’s environment, or on project assumptions ● Minutes ● Actual outcomes