Download to read offline

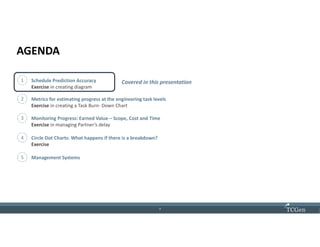

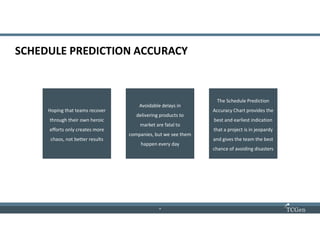
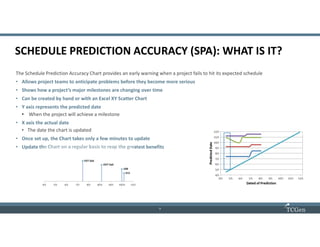
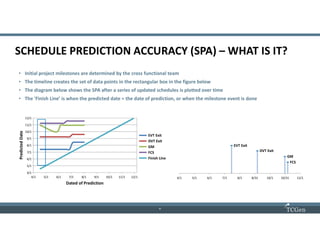
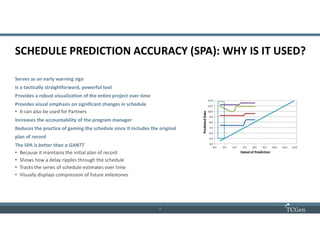
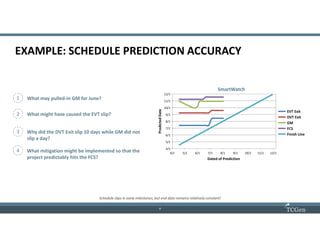
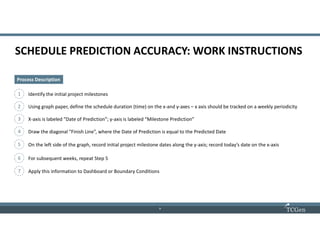


The document presents an overview of schedule prediction accuracy in project management, focusing on the development and monitoring of schedule prediction accuracy charts. It emphasizes the importance of these charts as early warning signs for project delays, allowing teams to anticipate issues and maintain accountability. Key learning points include metrics for estimating progress, risk monitoring, and the effectiveness of management systems in enhancing project performance.