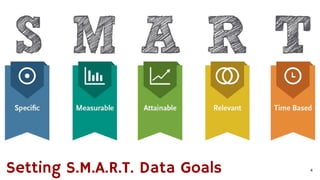
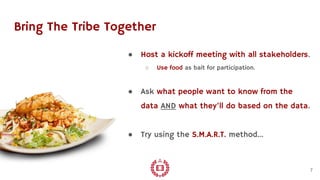
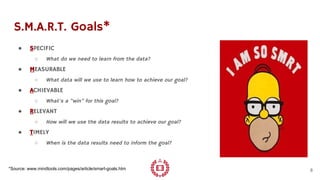
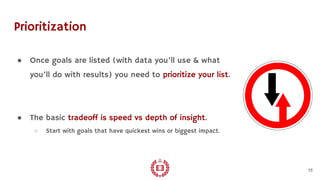
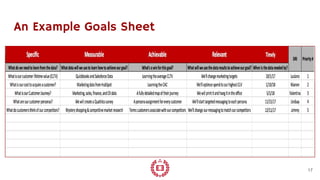
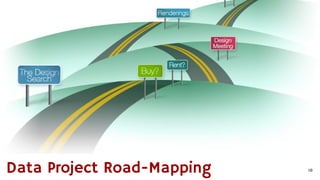
Dawn of the Data Age Lecture Series
Getting To Quick Wins with Data
Hi. I’m Luciano Wheatley Pesci…
Founder & Director, Utah Community Research Group, Univ. of Utah
● Teach microeconomics, statistics, applied research & data analytics, & American economic history.
● Teach data science for Westminster and developed their 3-class MBA emphasis in data science.
Co-Founder and CEO, EMPERITAS
● A Services as a Subscription team of economists and data scientists delivering bi-weekly Customer
Lifetime Value intelligence so our clients can beat their competitors for the most profitable customers.
2
Today’s Lecture Outline
● Teach you how to set reachable data project goals.
● Explain successful data project road-mapping.
● Outline effective data project management methods.
3
4Setting S.M.A.R.T. Data Goals
A Word About Change...
5
The Most Important Step
● Getting aligned on your goals for the data is
the most important step in any data project.
● If you don’t know where you want to end up,
there’s almost no chance of getting there.
6
Bring The Tribe Together
● Host a kickoff meeting with all stakeholders.
○ Use food as bait for participation.
● Ask what people want to know from the
data AND what they’ll do based on the data.
● Try using the S.M.A.R.T. method...
7
S.M.A.R.T. Goals*
● SPECIFIC
○ What do we need to learn from the data?
● MEASURABLE
○ What data will we use to learn how to achieve our goal?
● ACHIEVABLE
○ What’s a “win” for this goal?
● RELEVANT
○ How will we use the data results to achieve our goal?
● TIMELY
○ When is the data results need to inform the goal?
8*Source: www.mindtools.com/pages/article/smart-goals.htm
SPECIFIC: What To Learn
9
● GOALS = What You Want To Learn From Your Data.
○ Each goal should be a single, narrowly defined unknown
you want to learn about using data.
● For example, “what’s our customer lifetime value?”
MEASURABLE: What Data to Use
● Identify the data you have (or that you can get)
for use in reaching your goal.
○ Often this involves multiple data sets.
● For example, “customer lifetime value will
require Salesforce and Quickbooks data.”
10
ACHIEVABLE: Defining a “Win”
● Clearly define the standard of success for each
goal, using the data you’ve identified.
○ The purpose of this step is to create accountability
against hard, prestated, expectations.
● For example, “knowing the average customer
lifetime value will be enough for us right now.”
11
RELEVANT: Ensuring Usefulness
● Nothing’s gained by learning from data that
you can’t act on.
○ Define usefulness before any analysis begins.
● For example, “we’ll use the average
customer lifetime value to change who
we’re marketing to across all channels.”
12
TIMELY: Setting Deadlines
● Deadlines are key to successful data projects.
○ They help avoid mission creep, and keep you from going
too far down the data analysis rabbit hole.
● For example, “to change our marketing targets
we’ll need the average customer lifetime value
before October 1st 2017.”
13
Getting Even S.M.A.R.T.ER
14
Responsibility Matters
● Each goal needs a Directly Responsible
Individual (DRI) assigned to it.
○ “If it’s everyone’s job it’s no one's job.”
● This person may not work alone, but they’re
ultimately responsible for success of the goal.
15
Prioritization
● Once goals are listed (with data you’ll use & what
you’ll do with results) you need to prioritize your list.
● The basic tradeoff is speed vs depth of insight.
○ Start with goals that have quickest wins or biggest impact.
16
An Example Goals Sheet
17
18Data Project Road-Mapping
Planning Is Half The Battle
● SMART goals are so important because all of
the remaining project work depends on them.
● Once you’ve assigned the prioritized goals to
a DRI, the next step is to map out the project.
19
Whiteboards Are Your Friend
● Experiment with various brainstorming method,
just ensure your whole team participates.
○ The 6-3-5 Method* is a popular approach.
● Visualize THEN Explain.
○ Seriously, sketch it out then verbalize a short summary.
20*Source: en.wikipedia.org/wiki/6-3-5_Brainwriting
Be Flexible Enough To Pivot
21
Sprints for 60 Days
● Create a 60-day timeline in 2-week sprints.
○ Gantt charts are great for visualizing this.
● Each sprint needs to make progress.
○ If it can’t be done in 2 weeks, break it into pieces.
○ “Perfect is the enemy of better.”
22
A Fail-Resistant System
● With your prioritized goals and a roadmap, the
next step is to execute on your plan.
○ Executing the project plan is 80% of the actual work.
● You Will Fail. It’s a fact.
○ The key is building a resilient project management
system that allows failures to be known & learned from.
23
24Data Project Management
Transparency & Accountability
● For your data project to succeed, you need to
embrace radical transparency.
● Improves accountability to team & the individual.
○ Requires clear rules & enforcement (radical candor).
25
Task Management Software
26
Trust But Verify (with Stand-Ups)
● Host “stand-up” meetings every two weeks.
○ Short meetings where everyone stands and talks.
● The goal is to get project updates & identify
needs that are holding up progress.
○ If a project pivot is needed, this is when you’ll discover it.
27
Constant Visibility
● Identify one Key Performance Indicator
(KPI) to track for each active project goal.
○ Collect these (quickly) at stand-up meetings.
● Hang a “Goals Board” where everyone
can see it. Update it every two weeks.
28
Test, Validate, Repeat.
● Build a system that outlives any single DRI.
○ Watch for people with a high truck factor.*
● Test & validate continually. If you’re organized
you’ll quickly repeat past work.
○ For example, customer lifetime value changes over time.
29
*The worse it’d be if that person got hit by a truck (in terms of the project success)
the higher their individual truck factor.
In Conclusion: Now You Know...
● How to set reachable data project goals.
● How to create data project roadmaps.
● How to effectively manage a data project.
30
JOIN US FOR THE NEXT LECTURE
How to Interpret Data Like a Pro, September 19th 2017
emperitas.com/lecture

Getting to Quick Wins with Data - Dawn of the Data Age Lecture Series

  • 1.
    Dawn of theData Age Lecture Series Getting To Quick Wins with Data
  • 2.
    Hi. I’m LucianoWheatley Pesci… Founder & Director, Utah Community Research Group, Univ. of Utah ● Teach microeconomics, statistics, applied research & data analytics, & American economic history. ● Teach data science for Westminster and developed their 3-class MBA emphasis in data science. Co-Founder and CEO, EMPERITAS ● A Services as a Subscription team of economists and data scientists delivering bi-weekly Customer Lifetime Value intelligence so our clients can beat their competitors for the most profitable customers. 2
  • 3.
    Today’s Lecture Outline ●Teach you how to set reachable data project goals. ● Explain successful data project road-mapping. ● Outline effective data project management methods. 3
  • 4.
  • 5.
    A Word AboutChange... 5
  • 6.
    The Most ImportantStep ● Getting aligned on your goals for the data is the most important step in any data project. ● If you don’t know where you want to end up, there’s almost no chance of getting there. 6
  • 7.
    Bring The TribeTogether ● Host a kickoff meeting with all stakeholders. ○ Use food as bait for participation. ● Ask what people want to know from the data AND what they’ll do based on the data. ● Try using the S.M.A.R.T. method... 7
  • 8.
    S.M.A.R.T. Goals* ● SPECIFIC ○What do we need to learn from the data? ● MEASURABLE ○ What data will we use to learn how to achieve our goal? ● ACHIEVABLE ○ What’s a “win” for this goal? ● RELEVANT ○ How will we use the data results to achieve our goal? ● TIMELY ○ When is the data results need to inform the goal? 8*Source: www.mindtools.com/pages/article/smart-goals.htm
  • 9.
    SPECIFIC: What ToLearn 9 ● GOALS = What You Want To Learn From Your Data. ○ Each goal should be a single, narrowly defined unknown you want to learn about using data. ● For example, “what’s our customer lifetime value?”
  • 10.
    MEASURABLE: What Datato Use ● Identify the data you have (or that you can get) for use in reaching your goal. ○ Often this involves multiple data sets. ● For example, “customer lifetime value will require Salesforce and Quickbooks data.” 10
  • 11.
    ACHIEVABLE: Defining a“Win” ● Clearly define the standard of success for each goal, using the data you’ve identified. ○ The purpose of this step is to create accountability against hard, prestated, expectations. ● For example, “knowing the average customer lifetime value will be enough for us right now.” 11
  • 12.
    RELEVANT: Ensuring Usefulness ●Nothing’s gained by learning from data that you can’t act on. ○ Define usefulness before any analysis begins. ● For example, “we’ll use the average customer lifetime value to change who we’re marketing to across all channels.” 12
  • 13.
    TIMELY: Setting Deadlines ●Deadlines are key to successful data projects. ○ They help avoid mission creep, and keep you from going too far down the data analysis rabbit hole. ● For example, “to change our marketing targets we’ll need the average customer lifetime value before October 1st 2017.” 13
  • 14.
  • 15.
    Responsibility Matters ● Eachgoal needs a Directly Responsible Individual (DRI) assigned to it. ○ “If it’s everyone’s job it’s no one's job.” ● This person may not work alone, but they’re ultimately responsible for success of the goal. 15
  • 16.
    Prioritization ● Once goalsare listed (with data you’ll use & what you’ll do with results) you need to prioritize your list. ● The basic tradeoff is speed vs depth of insight. ○ Start with goals that have quickest wins or biggest impact. 16
  • 17.
  • 18.
  • 19.
    Planning Is HalfThe Battle ● SMART goals are so important because all of the remaining project work depends on them. ● Once you’ve assigned the prioritized goals to a DRI, the next step is to map out the project. 19
  • 20.
    Whiteboards Are YourFriend ● Experiment with various brainstorming method, just ensure your whole team participates. ○ The 6-3-5 Method* is a popular approach. ● Visualize THEN Explain. ○ Seriously, sketch it out then verbalize a short summary. 20*Source: en.wikipedia.org/wiki/6-3-5_Brainwriting
  • 21.
    Be Flexible EnoughTo Pivot 21
  • 22.
    Sprints for 60Days ● Create a 60-day timeline in 2-week sprints. ○ Gantt charts are great for visualizing this. ● Each sprint needs to make progress. ○ If it can’t be done in 2 weeks, break it into pieces. ○ “Perfect is the enemy of better.” 22
  • 23.
    A Fail-Resistant System ●With your prioritized goals and a roadmap, the next step is to execute on your plan. ○ Executing the project plan is 80% of the actual work. ● You Will Fail. It’s a fact. ○ The key is building a resilient project management system that allows failures to be known & learned from. 23
  • 24.
  • 25.
    Transparency & Accountability ●For your data project to succeed, you need to embrace radical transparency. ● Improves accountability to team & the individual. ○ Requires clear rules & enforcement (radical candor). 25
  • 26.
  • 27.
    Trust But Verify(with Stand-Ups) ● Host “stand-up” meetings every two weeks. ○ Short meetings where everyone stands and talks. ● The goal is to get project updates & identify needs that are holding up progress. ○ If a project pivot is needed, this is when you’ll discover it. 27
  • 28.
    Constant Visibility ● Identifyone Key Performance Indicator (KPI) to track for each active project goal. ○ Collect these (quickly) at stand-up meetings. ● Hang a “Goals Board” where everyone can see it. Update it every two weeks. 28
  • 29.
    Test, Validate, Repeat. ●Build a system that outlives any single DRI. ○ Watch for people with a high truck factor.* ● Test & validate continually. If you’re organized you’ll quickly repeat past work. ○ For example, customer lifetime value changes over time. 29 *The worse it’d be if that person got hit by a truck (in terms of the project success) the higher their individual truck factor.
  • 30.
    In Conclusion: NowYou Know... ● How to set reachable data project goals. ● How to create data project roadmaps. ● How to effectively manage a data project. 30
  • 31.
    JOIN US FORTHE NEXT LECTURE How to Interpret Data Like a Pro, September 19th 2017 emperitas.com/lecture