Download to read offline
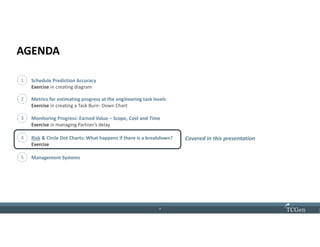
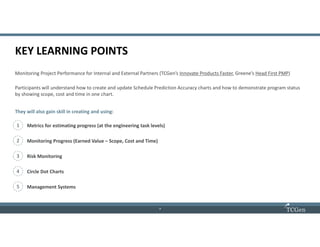
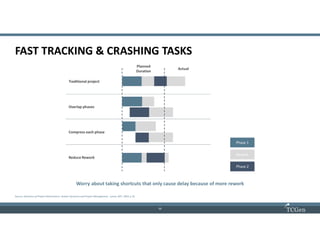
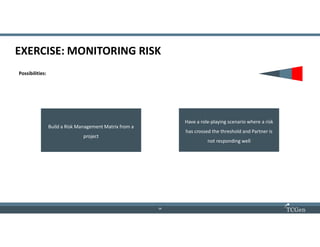


The document outlines a program management presentation focused on risk management techniques, including estimating progress and monitoring project performance. Key learning points include creating metrics for task progress, managing risk through various response strategies, and the importance of effective communication in project teams. Participants will learn to implement risk management matrices, monitor predictive metrics, and ensure timely communication to enhance project execution.