Download as PDF, PPTX
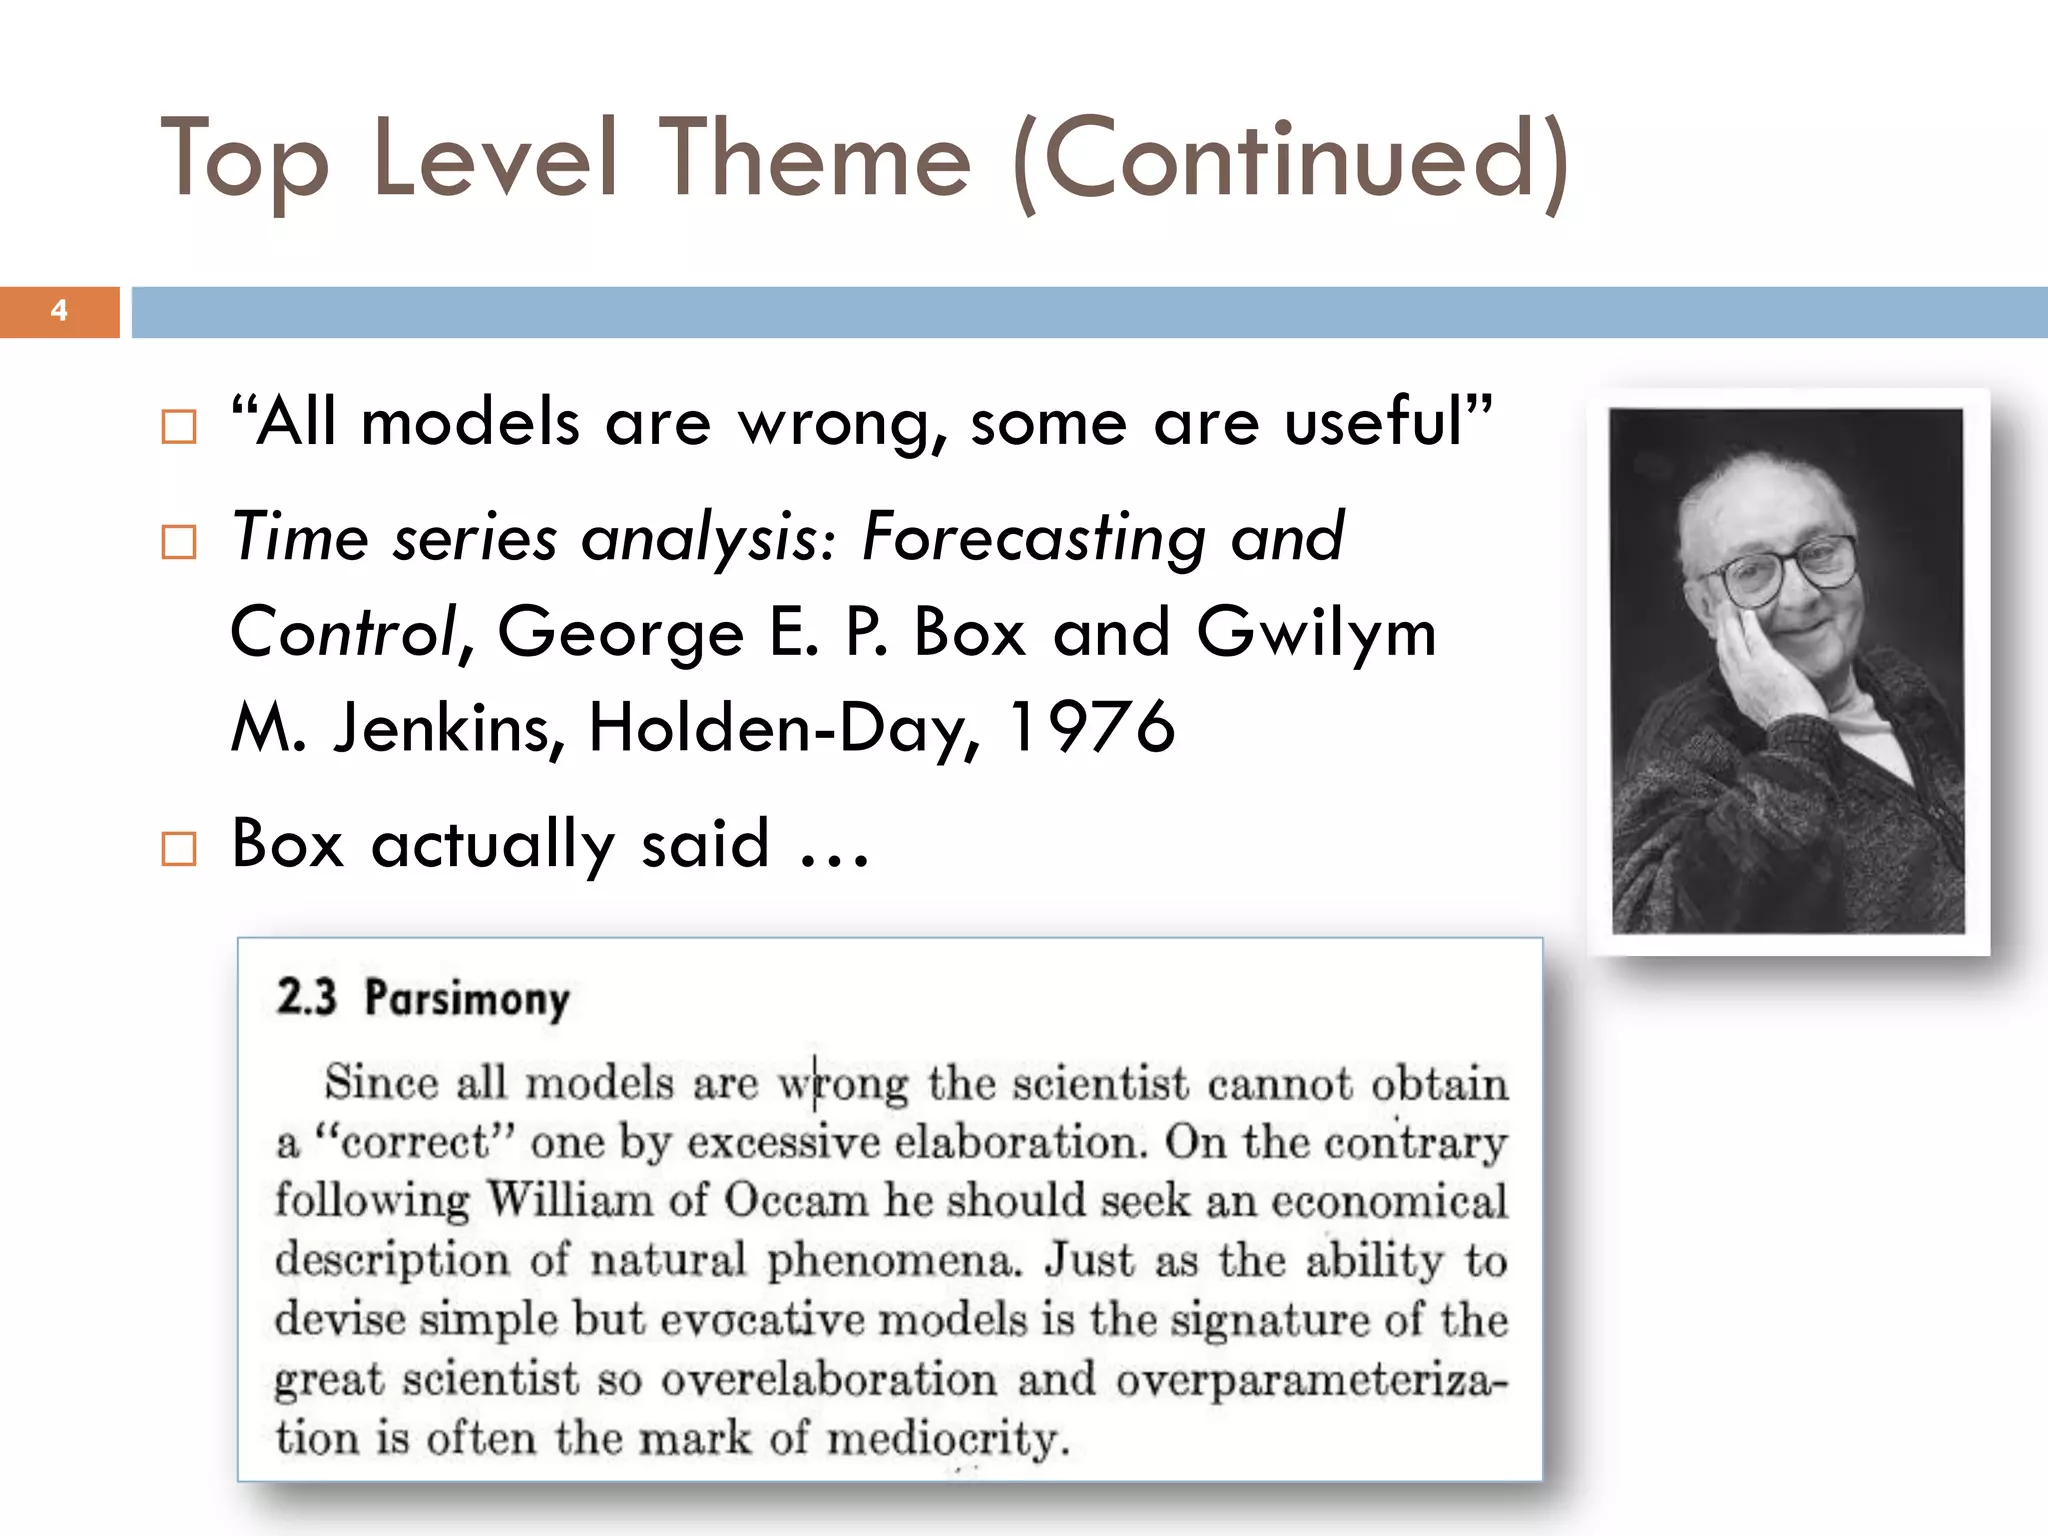

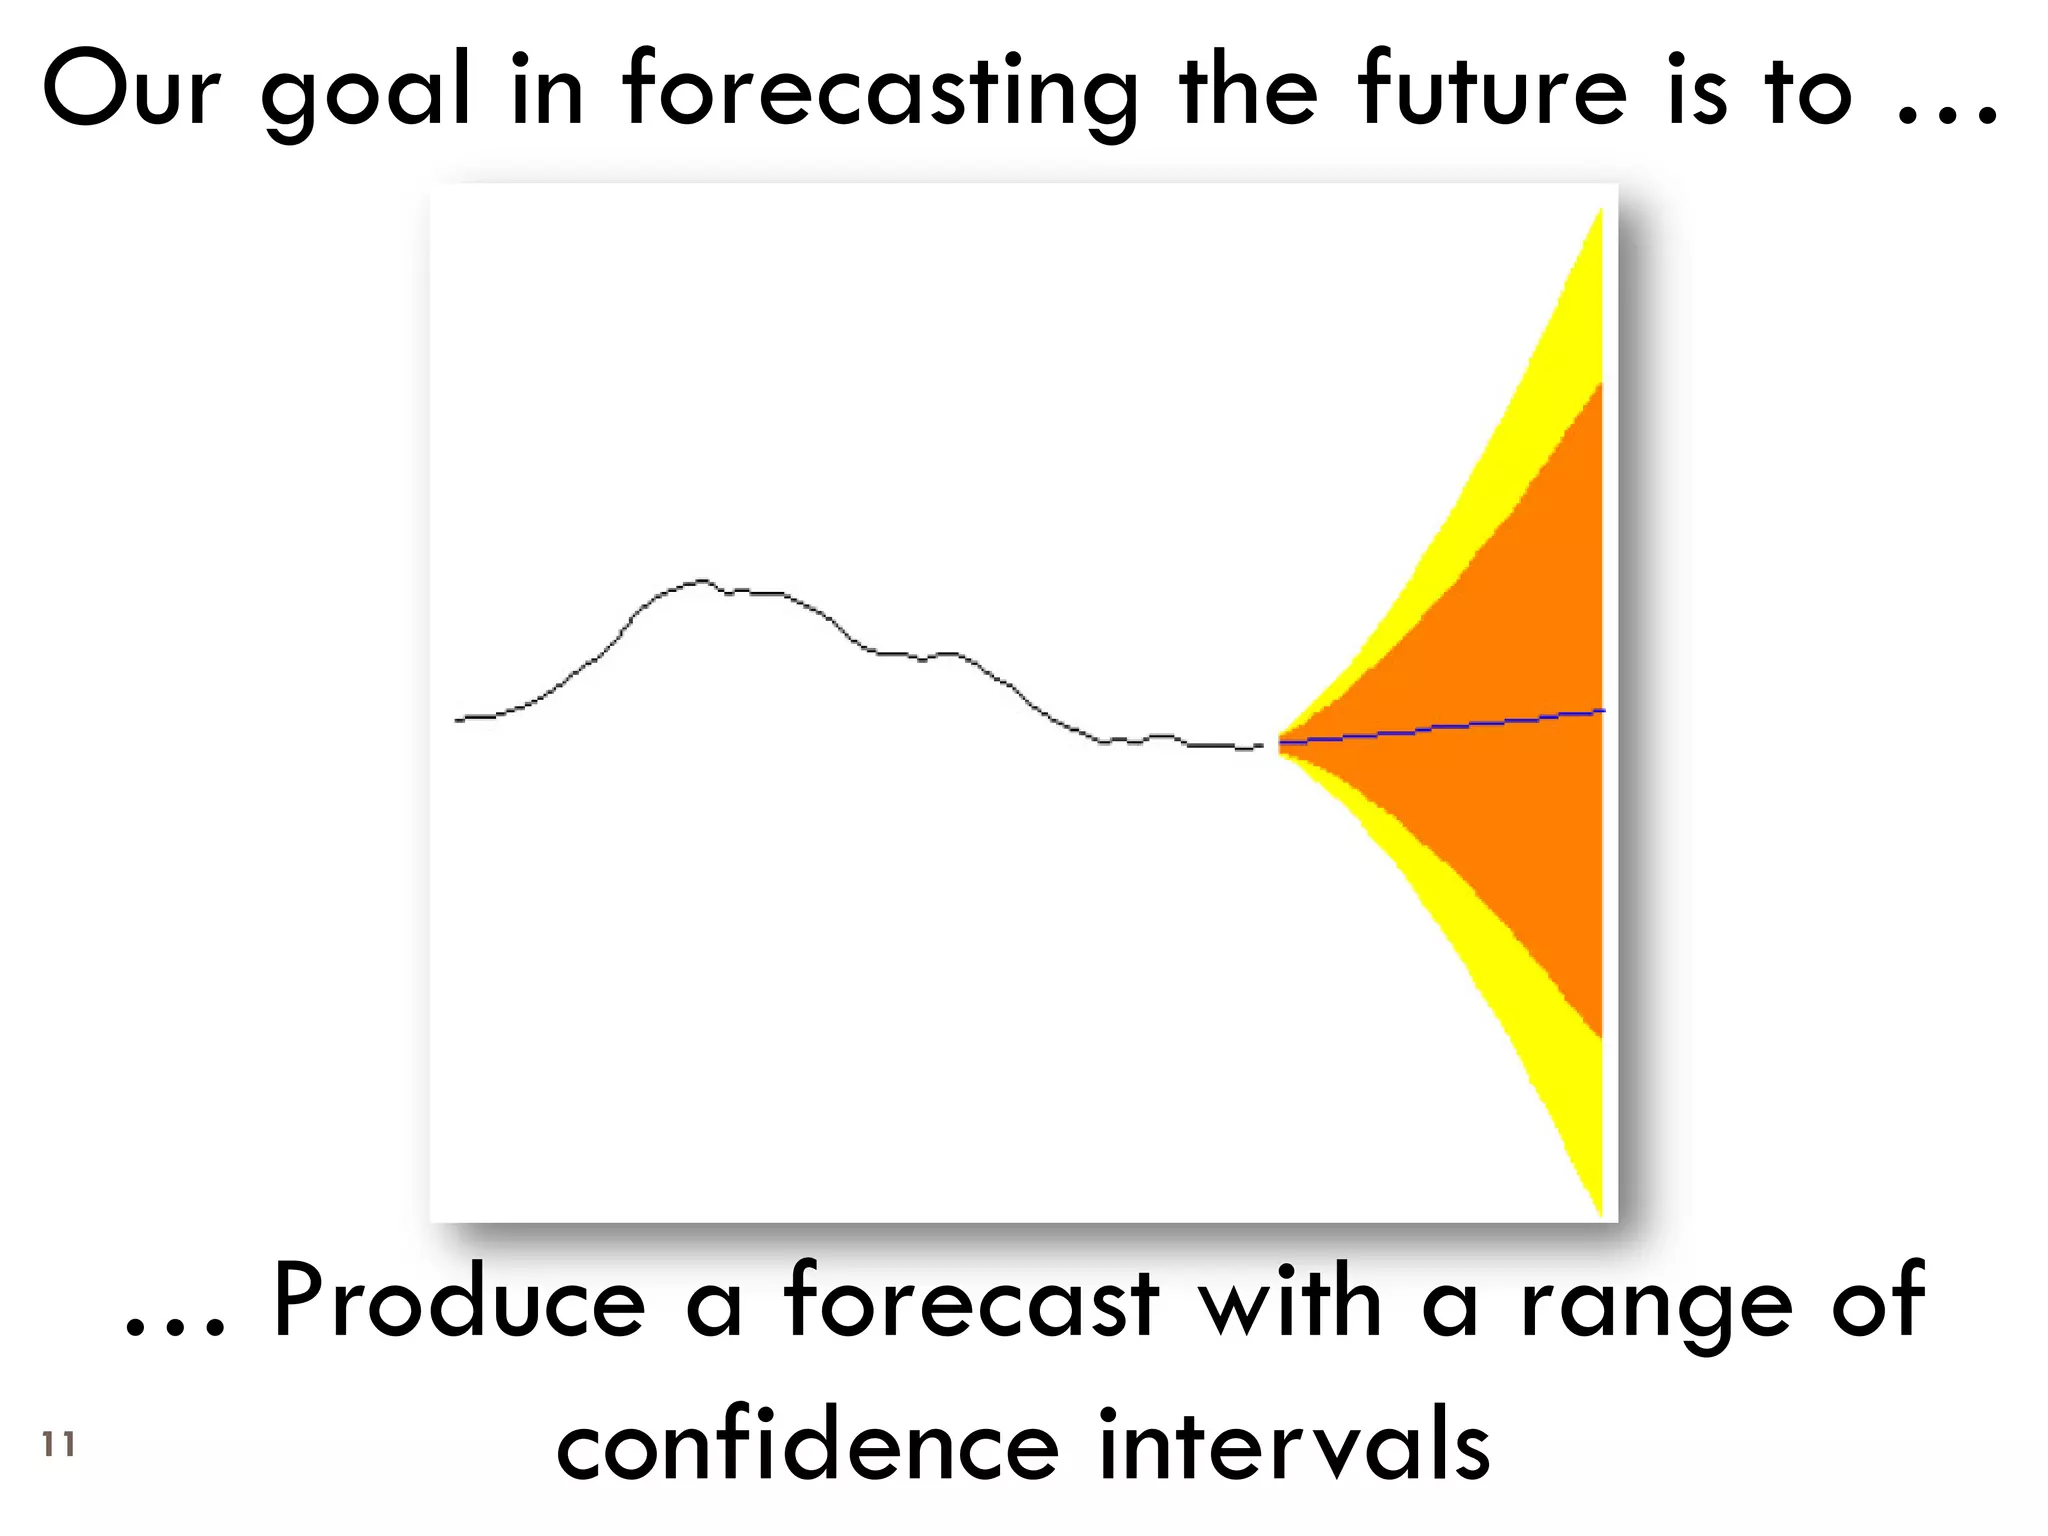


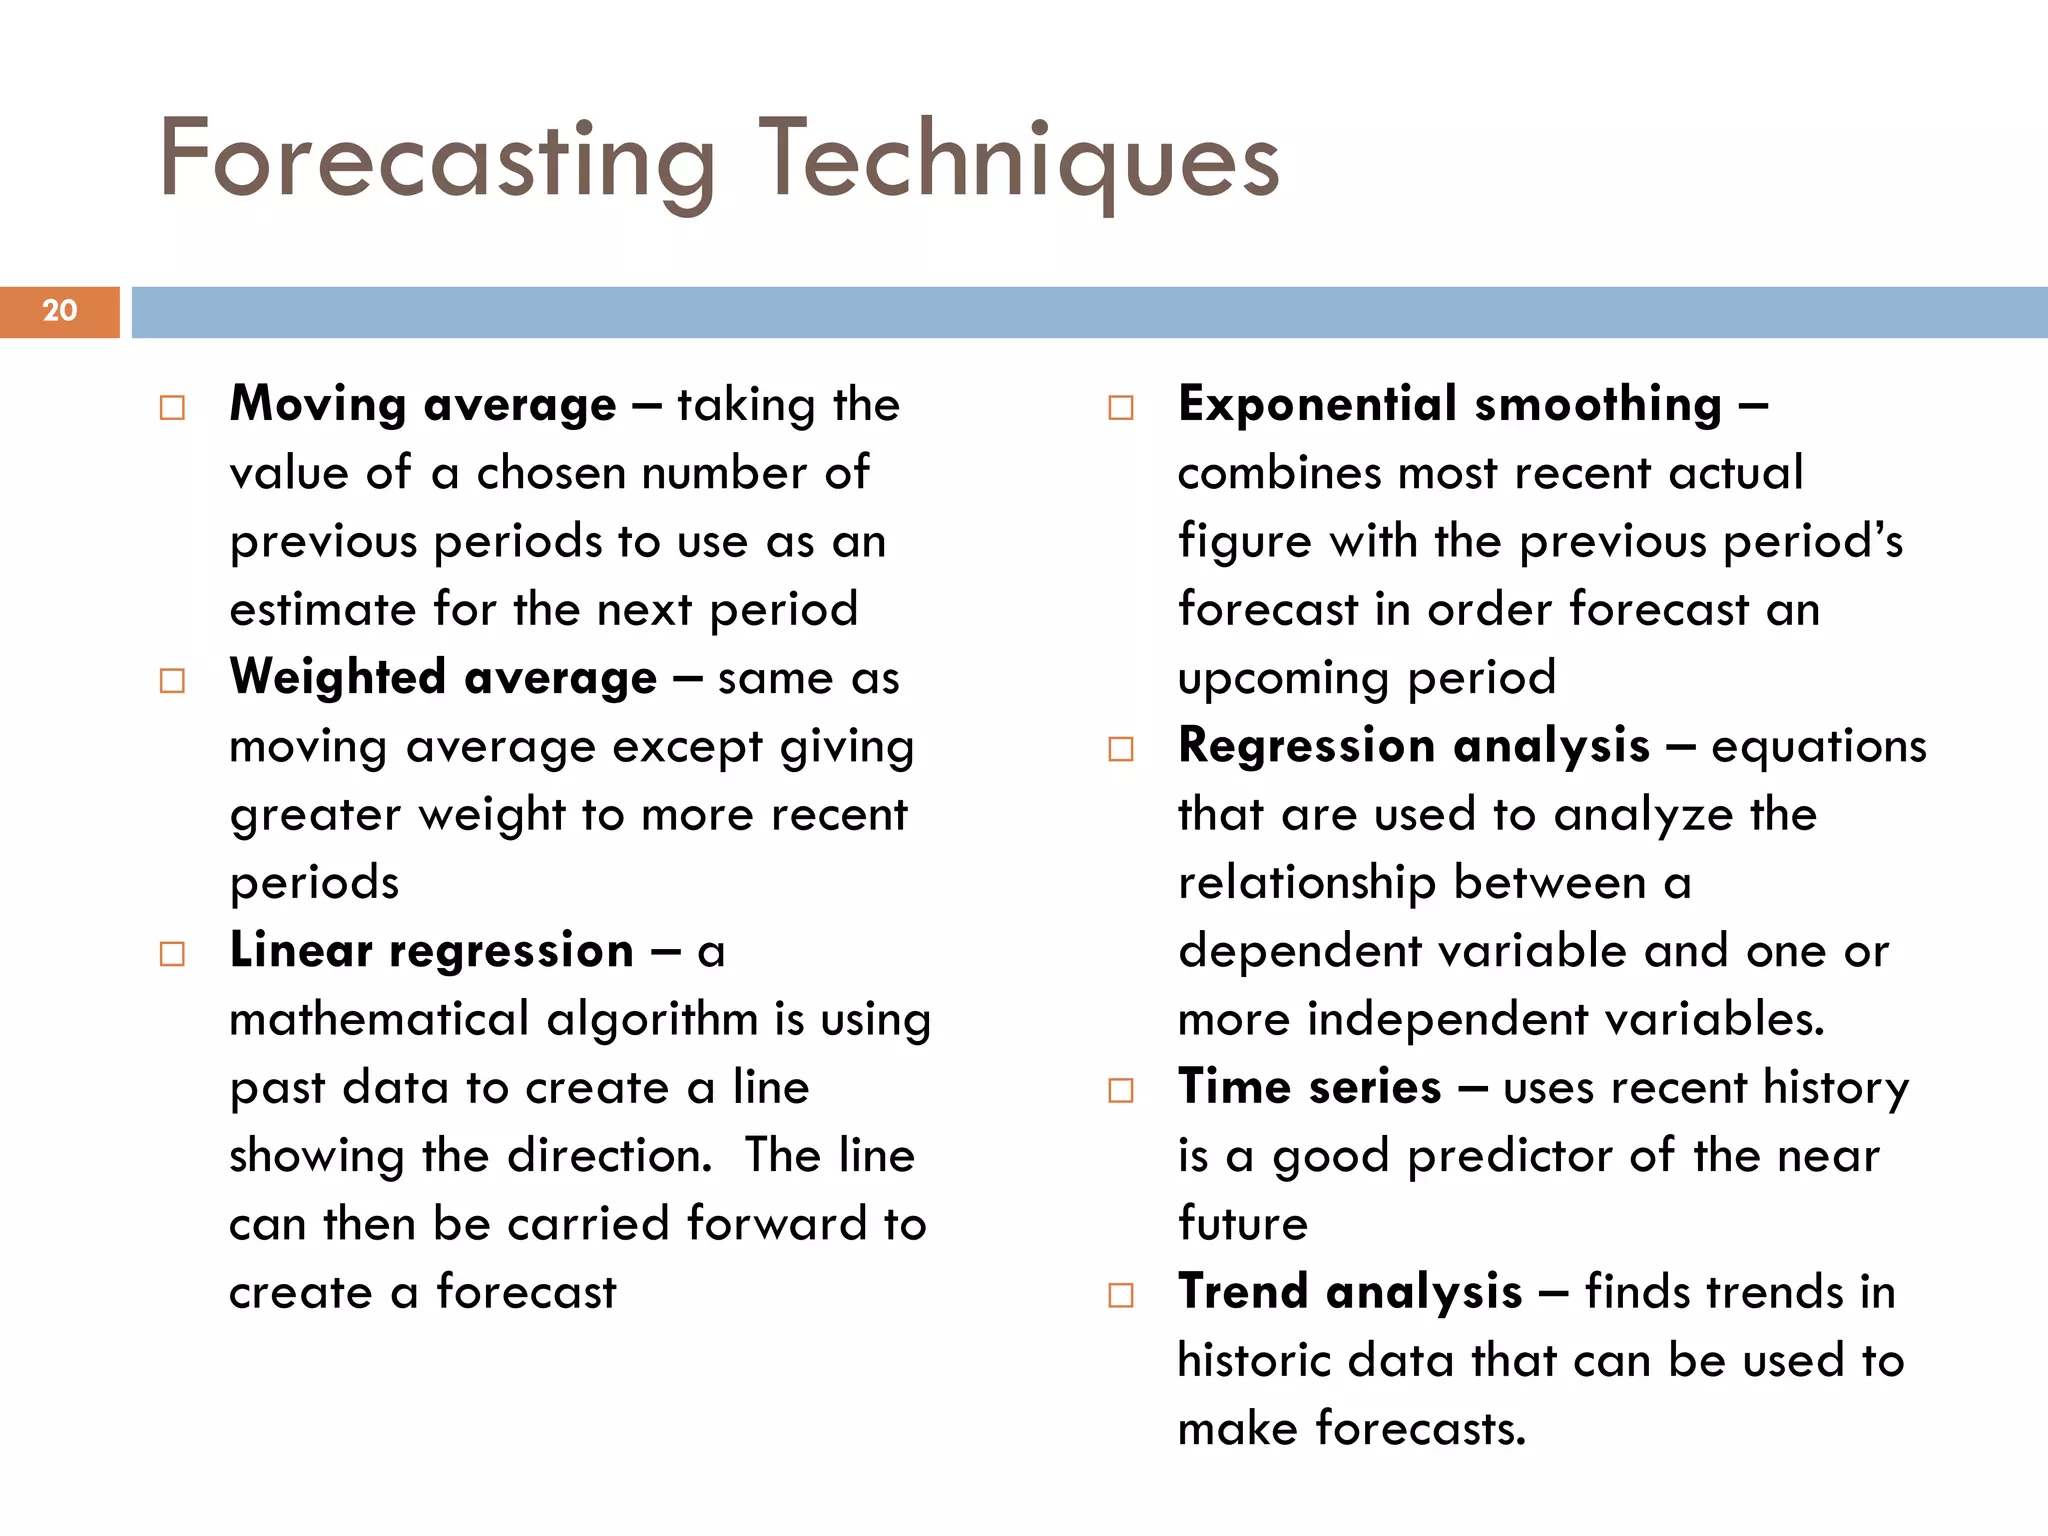
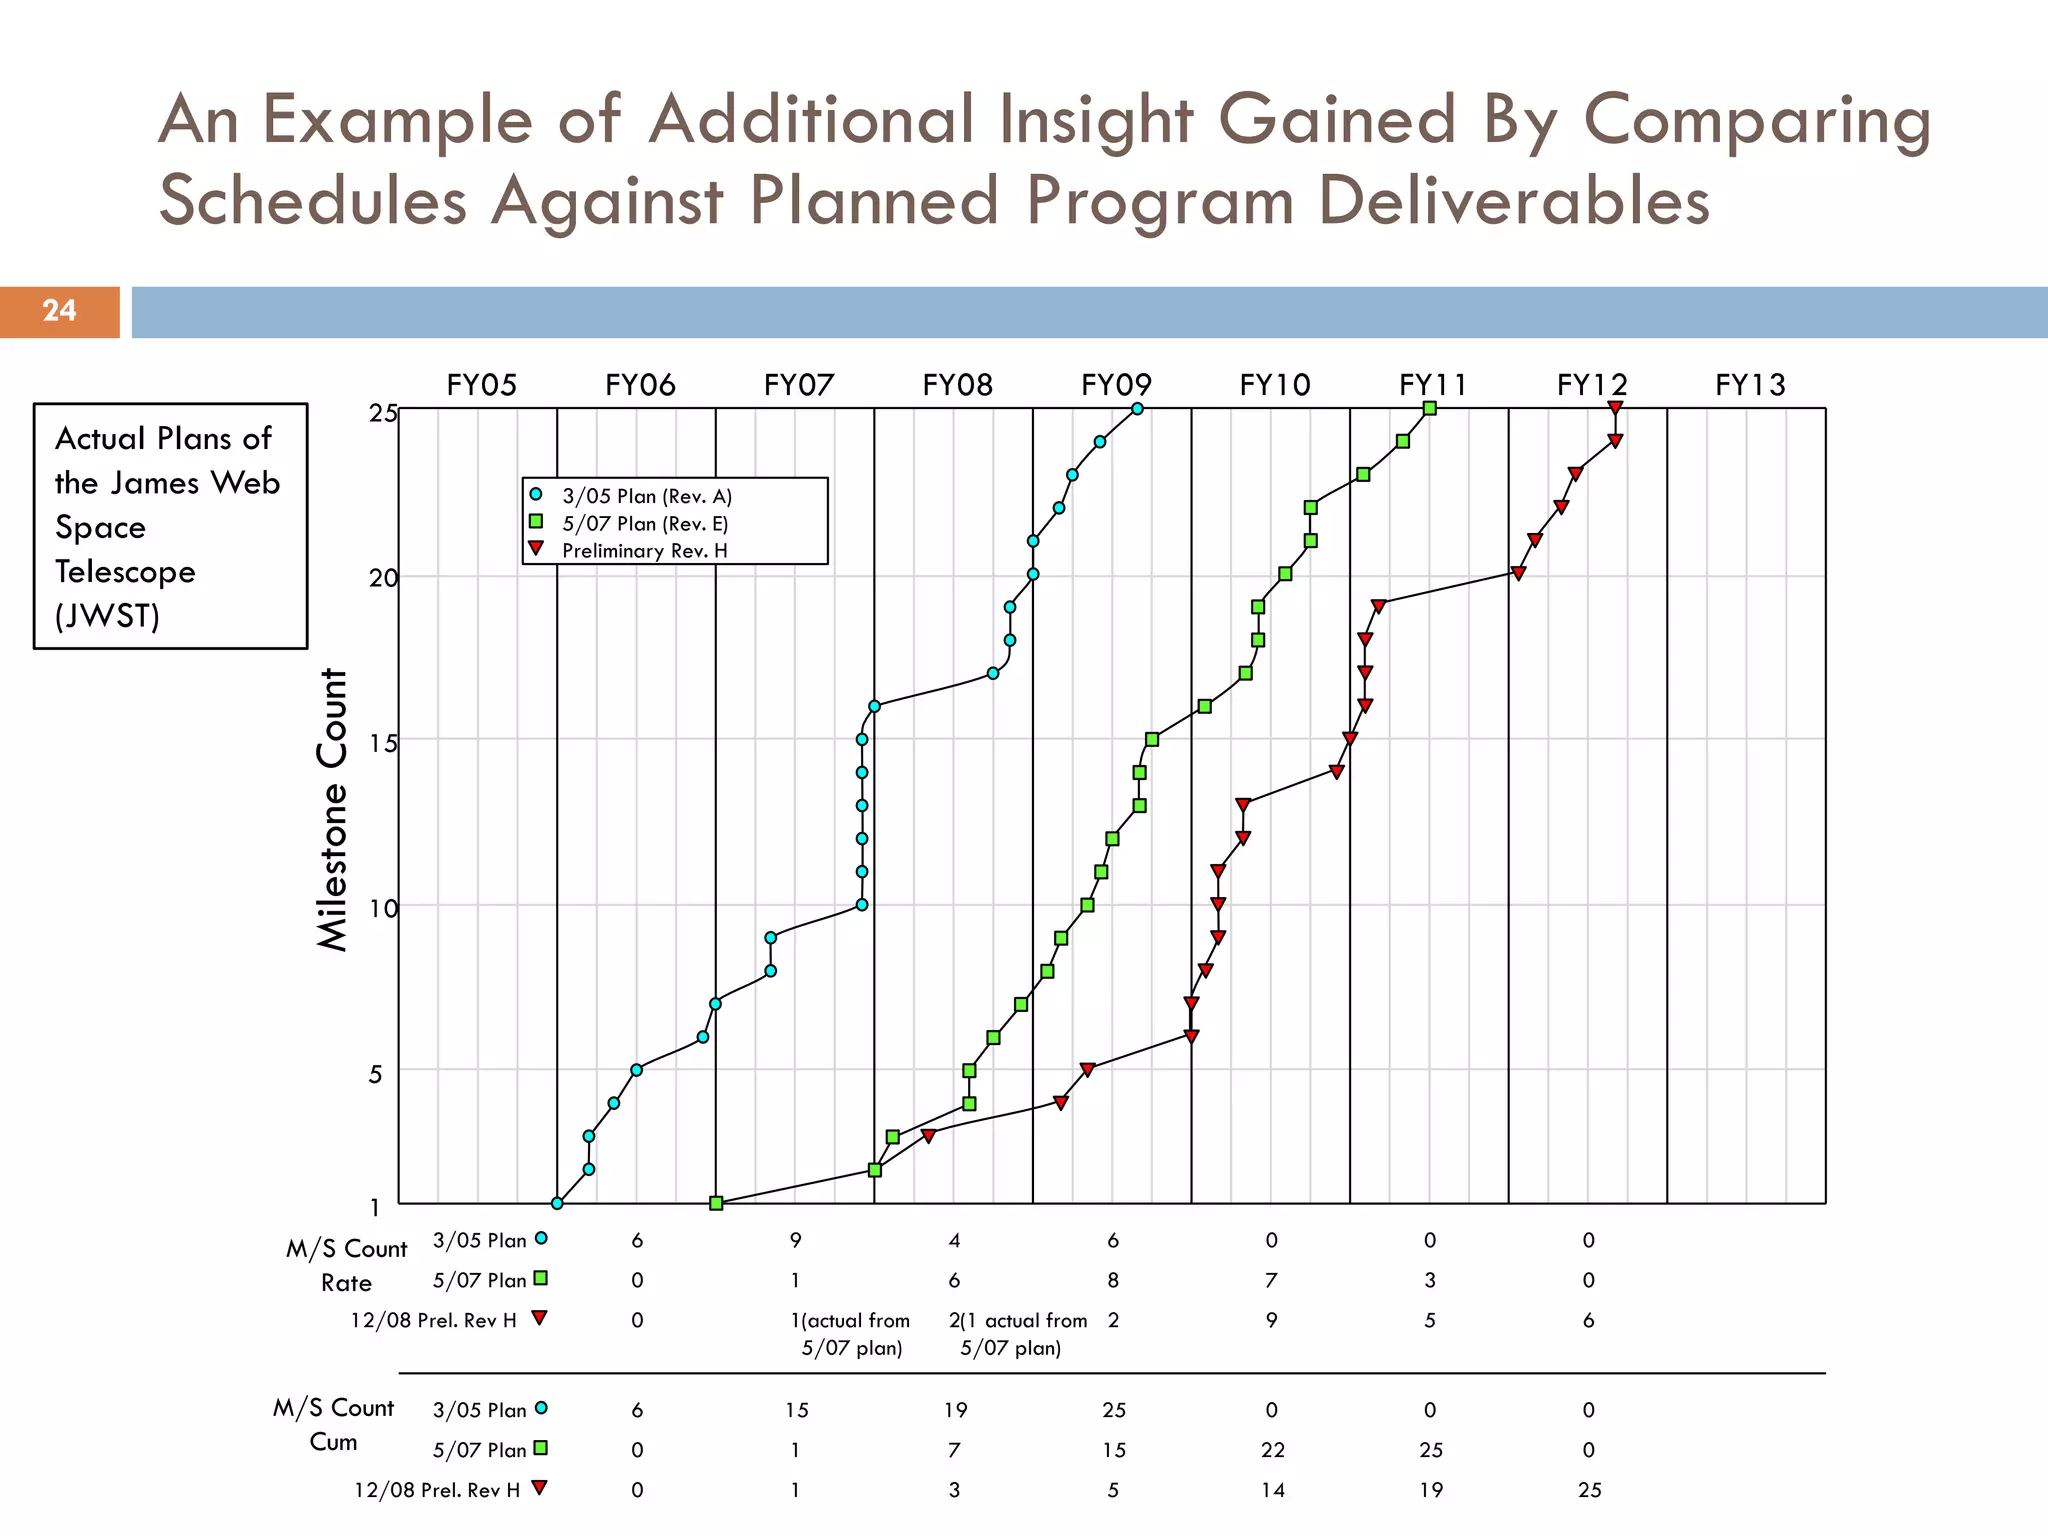
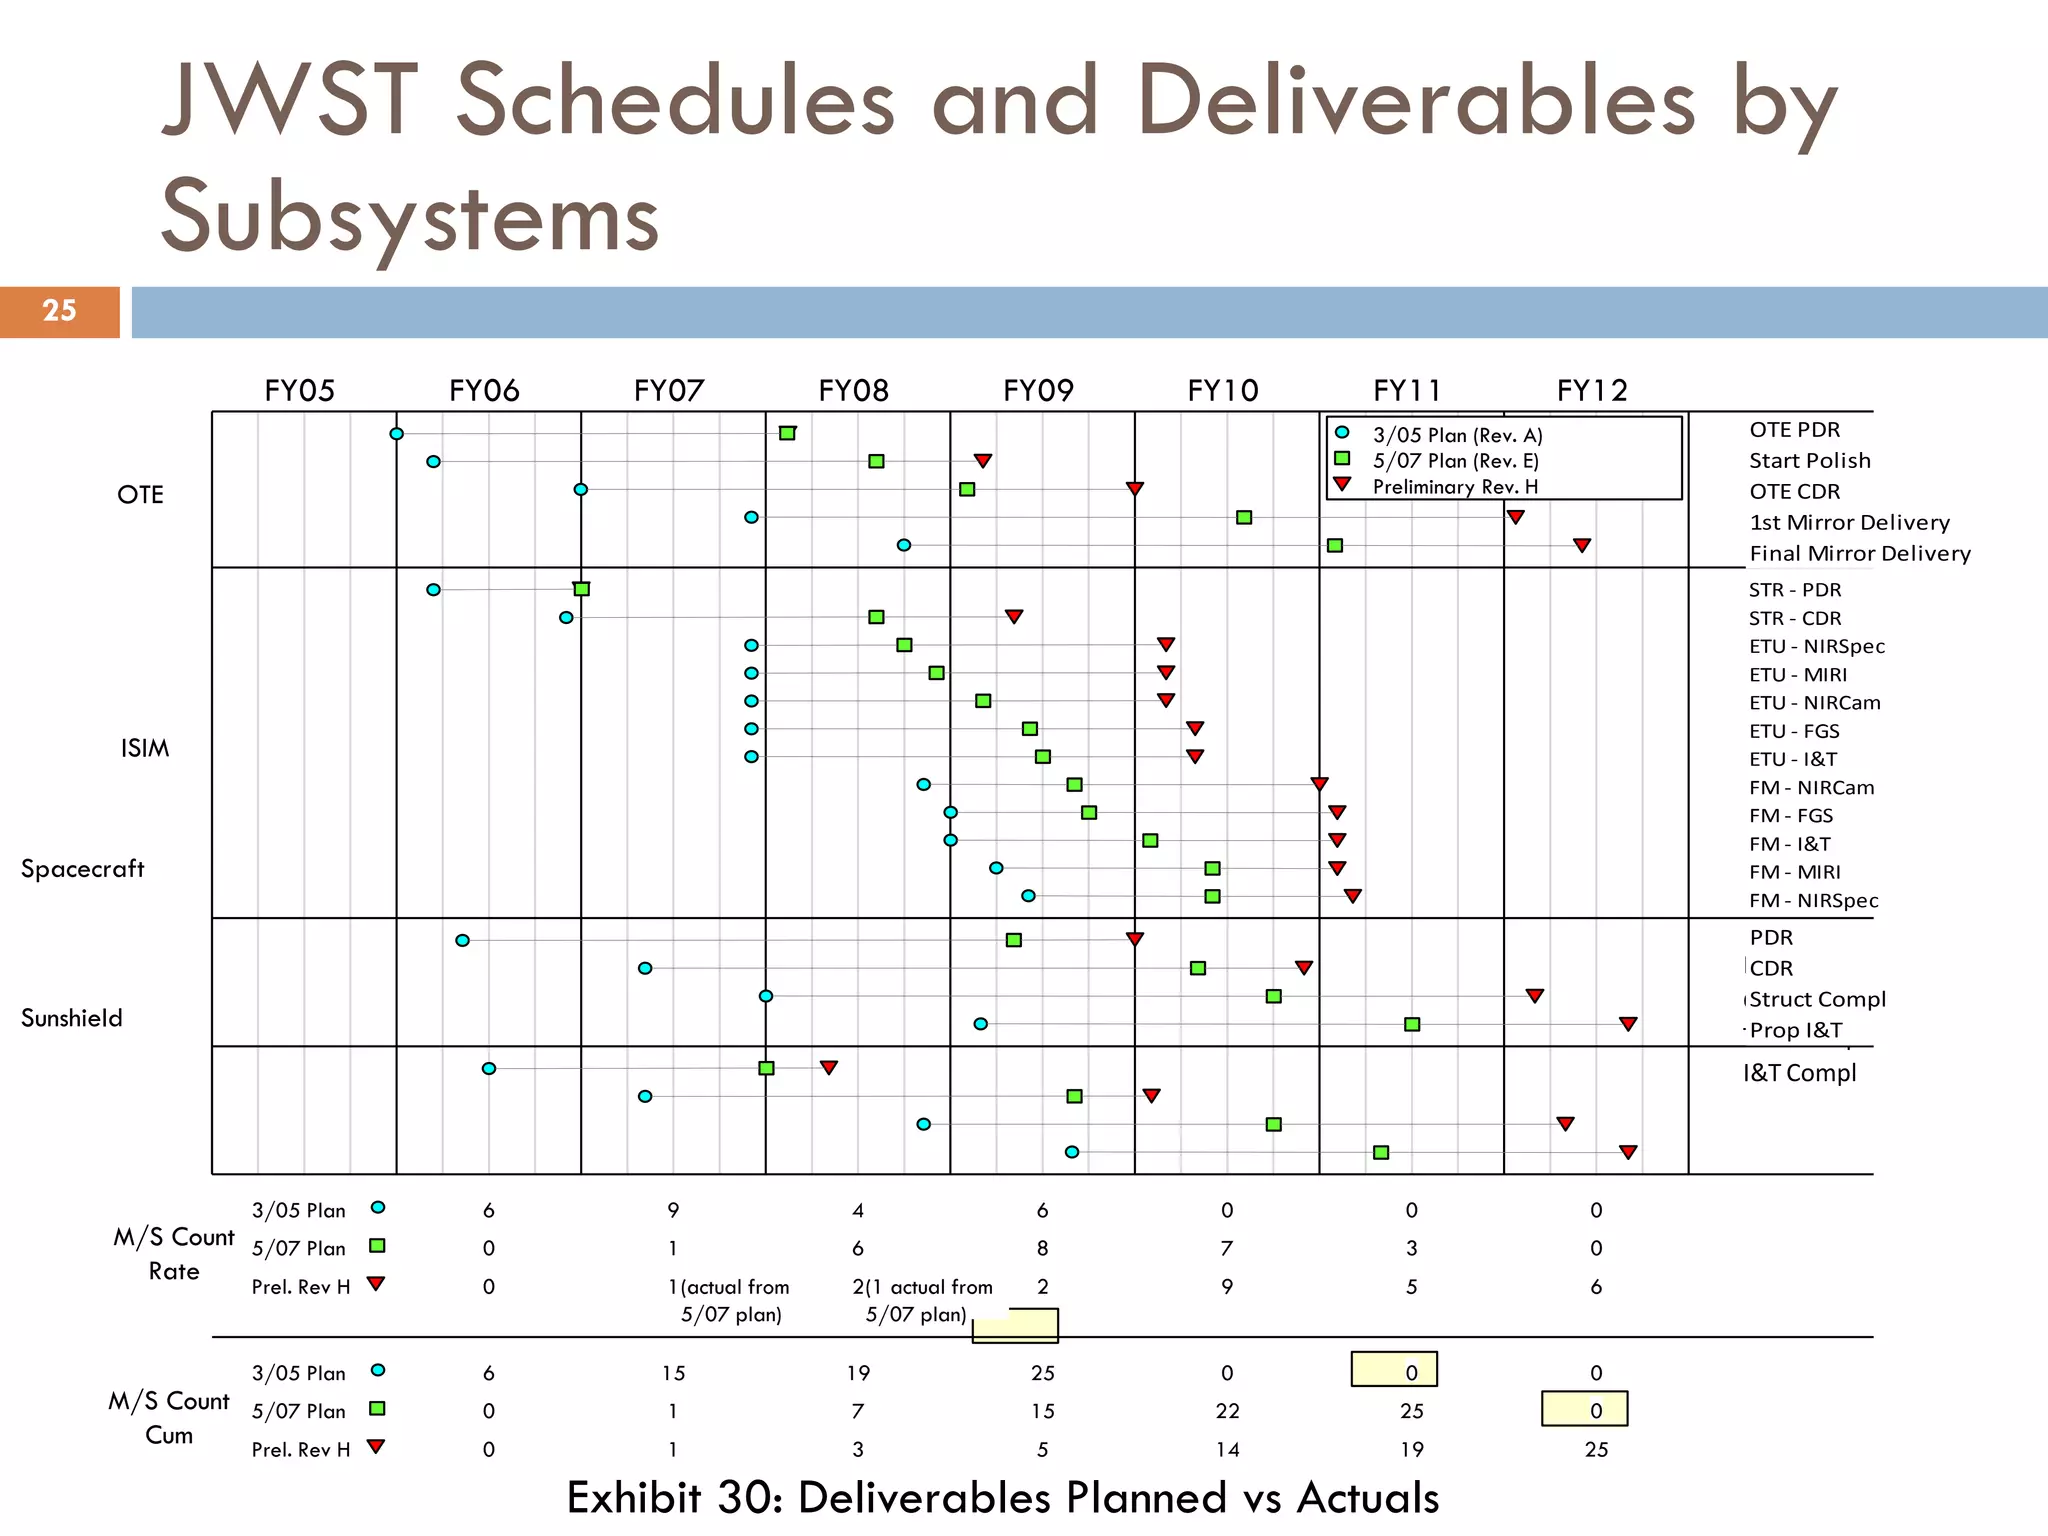
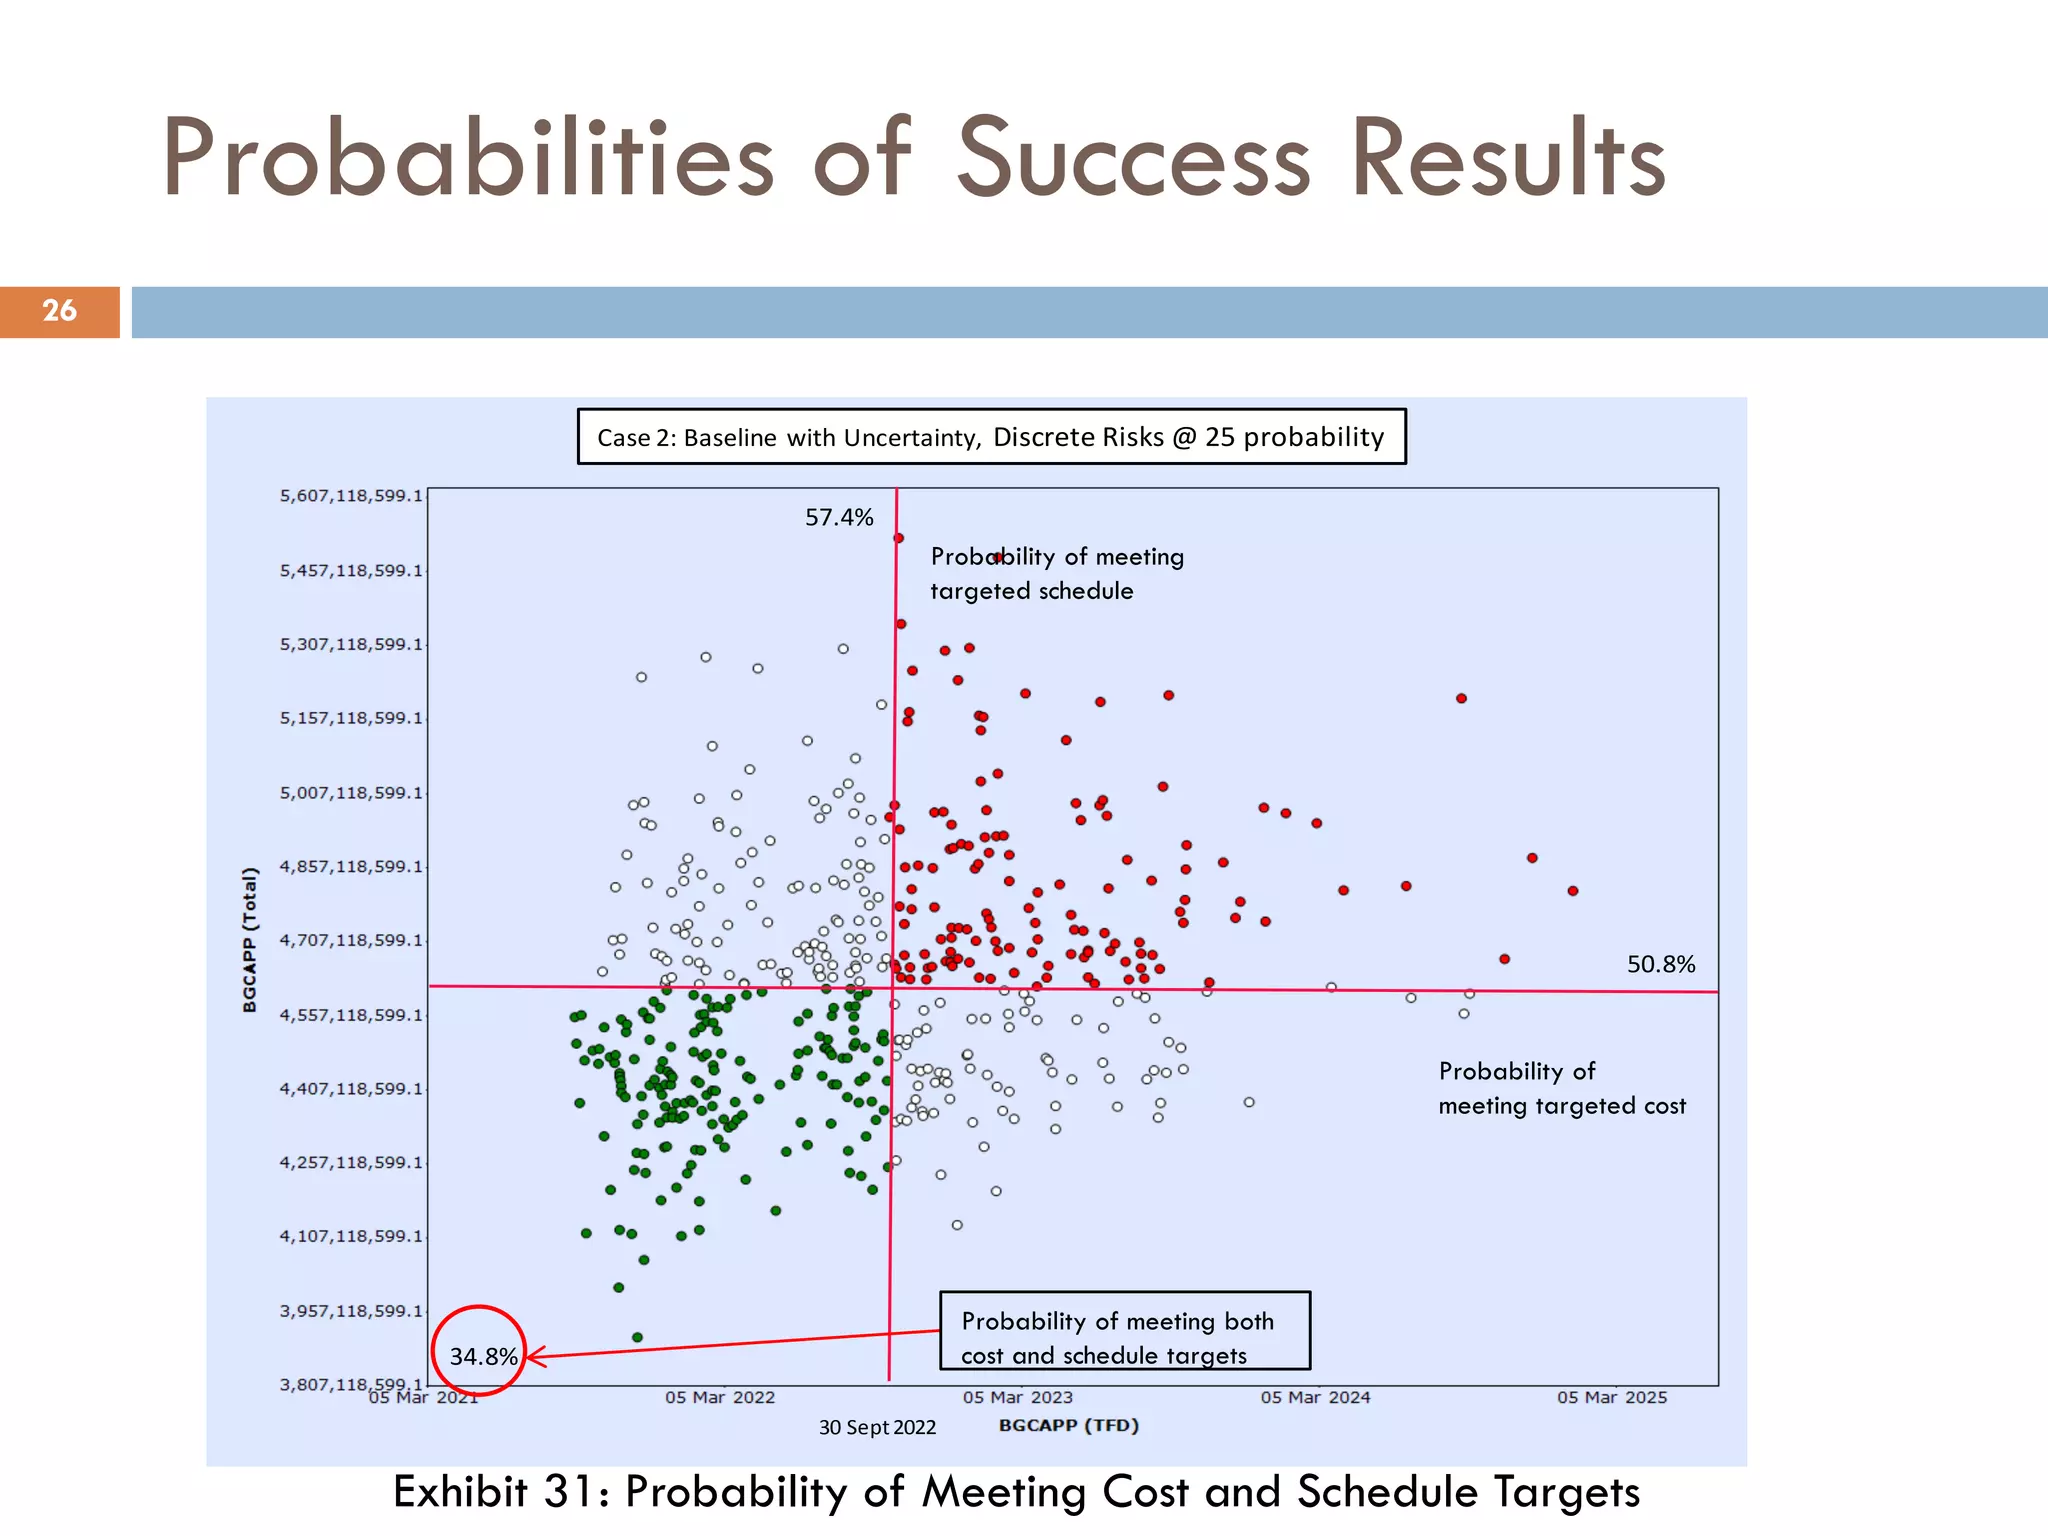
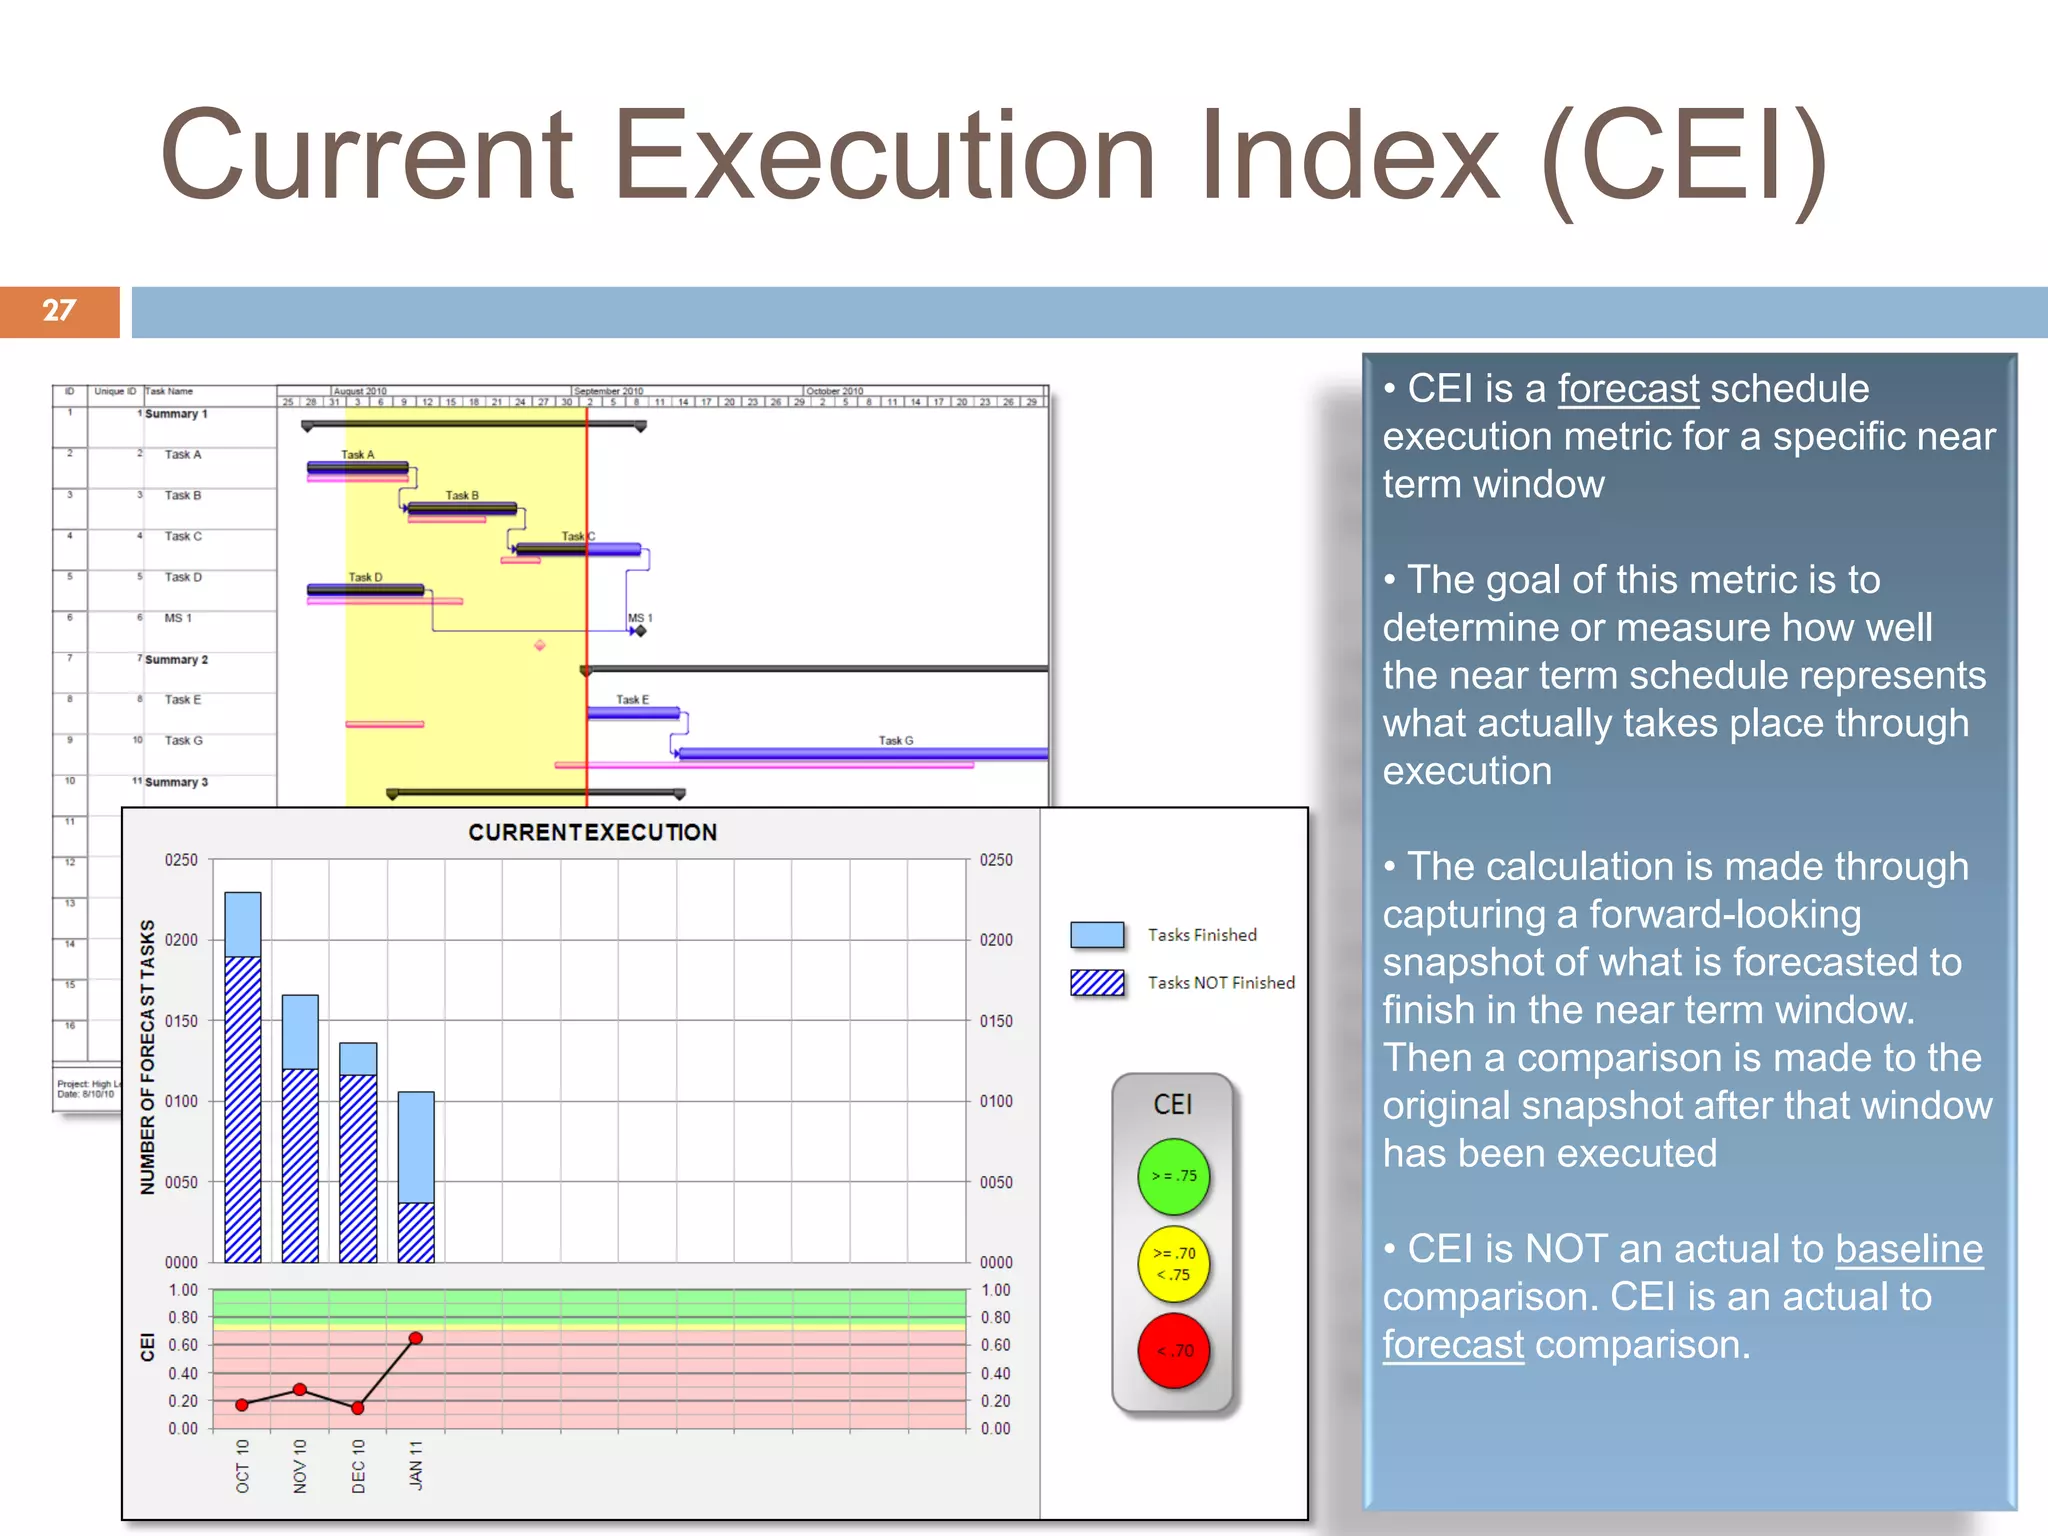


The document discusses probabilistic forecasting of project performance, emphasizing the need to account for uncertainty and risk in project management. It critiques current earned value metrics for failing to provide meaningful insights into future performance, advocating for statistical forecasting and time series analysis to improve decision-making. Key elements for reliable forecasting include providing confidence intervals, capturing performance data accurately, and using consistent methodologies for cost and schedule predictions.


![Project management [module 1]](https://cdn.slidesharecdn.com/ss_thumbnails/projectmanagementmodule1-200621144500-thumbnail.jpg?width=640&height=640&fit=bounds)