Download as PDF, PPTX


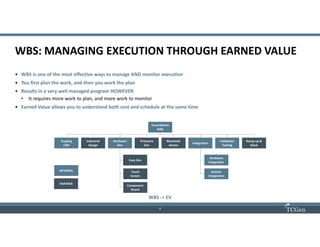
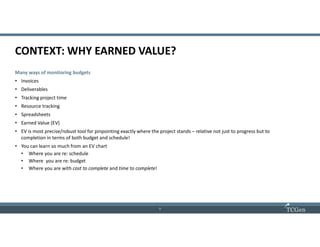
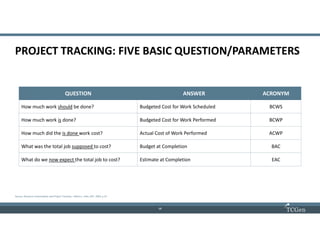
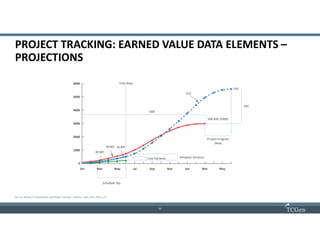
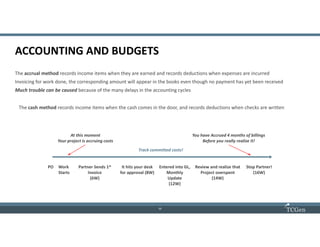
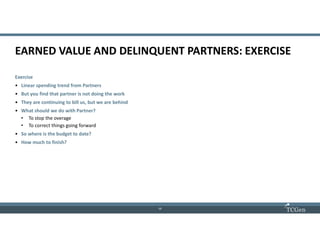


The document outlines effective program management techniques using work breakdown structures (WBS) and earned value (EV) metrics for project performance monitoring. It emphasizes the importance of tracking schedule and cost performance as well as handling partner delays through various exercises and key learning points. Participants will learn to assess project status and manage execution effectively by utilizing WBS and EV tools.


