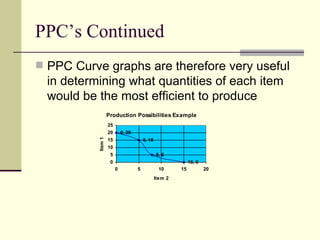
Production Possibility Curves What they represent and how to  create them.
PPC Examples
Production Possibility Curves are: Graphs that visually represent the relationship between two different goods or services As there are limited resources available to produce any given item, an increase in the quantity produced of one item will lead to a corresponding decrease in the quantity produced of the comparison item
PPC’s Continued This relationship is generally not a direct proportion as some resources are better suited to making one item over the other
PPC’s Continued PPC Curve graphs are therefore very useful in determining what quantities of each item would be the most efficient to produce
PPC Example In the previous example, it can be seen that as more of Item 2, lets call that Hats, is produced, less of Item 1, Wheat perhaps, is produced.  However, the relationship between the two items is not constant.  For example, moving from producing 0 Hats to 5 Hats yields a decrease in production of Wheat of 5 units (20 to 15).Yet when we move from producing 5 Hats to 8, we have a decrease in production of Wheat of 10 units (15 to 5)!  Therefore, it can be determined that it is becoming more costly to produce Hats in terms of the loss of Wheat.  This is logical when one considers the production resources used to make the different items.  A farmer equipped to produce wheat will have real difficulty producing hats!

Production Possibility Curves

  • 1.
    Production Possibility CurvesWhat they represent and how to create them.
  • 2.
  • 3.
    Production Possibility Curvesare: Graphs that visually represent the relationship between two different goods or services As there are limited resources available to produce any given item, an increase in the quantity produced of one item will lead to a corresponding decrease in the quantity produced of the comparison item
  • 4.
    PPC’s Continued Thisrelationship is generally not a direct proportion as some resources are better suited to making one item over the other
  • 5.
    PPC’s Continued PPCCurve graphs are therefore very useful in determining what quantities of each item would be the most efficient to produce
  • 6.
    PPC Example Inthe previous example, it can be seen that as more of Item 2, lets call that Hats, is produced, less of Item 1, Wheat perhaps, is produced. However, the relationship between the two items is not constant. For example, moving from producing 0 Hats to 5 Hats yields a decrease in production of Wheat of 5 units (20 to 15).Yet when we move from producing 5 Hats to 8, we have a decrease in production of Wheat of 10 units (15 to 5)! Therefore, it can be determined that it is becoming more costly to produce Hats in terms of the loss of Wheat. This is logical when one considers the production resources used to make the different items. A farmer equipped to produce wheat will have real difficulty producing hats!