- The document provides sales projections for ticket sales, beverages, merchandise, and total sales over two years for a business. It includes metrics like unit volume, price, costs, and net sales on a quarterly basis.
- Key assumptions are provided around what percentage of ticket buyers purchase merchandise and beverages based on industry averages.
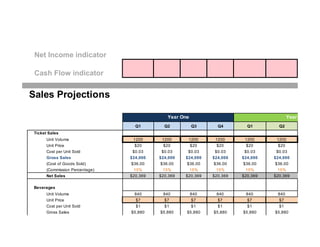
- Total projected net sales for year one are $110,818 and year two are $110,818, for a two year total of $221,635. The projections show stable and consistent sales quarter-over-quarter and year-over-year.
Canadian December retail sales fall 0.5 per cent on weak autos, holiday salespaul young cpa, cga
This presentation looks at retail sales for Canada. The focus is on the segments as well as the provinces.
December 2016 seen weaker sales over the holiday season. It appears more and more people cut back on their spending. Consumer spending is big driver when it comes to GDP growth in Canada. The lower retail sales could impact GDP for the final quarter.
Clinton Global Initiative Hult Prize Finalist Presentation - HarambeeBig Fish Presentations
For this year's Hult Prize, Big Fish Presentations was given the task to design a presentation and coach the Dubai team Harambee to present in front of select judges during the 2014 Clinton Global Initiative in New York City.
For more information on the Hult Prize see here:
http://www.hultprizesix.com/
For more information on Harambee, please see here: https://www.facebook.com/harambeeorganisation
This complete deck is oriented to make sure you do not lag in your presentations. Our creatively crafted slides come with apt research and planning. This exclusive deck with twenty slides is here to help you to strategize, plan, analyse, or segment the topic with clear understanding and apprehension. Utilize ready to use presentation slides on Budget Projection Powerpoint Presentation Slides with all sorts of editable templates, charts and graphs, overviews, analysis templates. It is usable for marking important decisions and covering critical issues. Display and present all possible kinds of underlying nuances, progress factors for an all inclusive presentation for the teams. This presentation deck can be used by all professionals, managers, individuals,internal external teams involved in any company organization.
This deck consists of total of twenty slides. It has PPT slides highlighting important topics of Budget Variance Analysis Powerpoint Presentation Slides. This deck comprises of amazing visuals with thoroughly researched content. Each template is well crafted and designed by our PowerPoint experts. Our designers have included all the necessary PowerPoint layouts in this deck. From icons to graphs, this PPT deck has it all. The best part is that these templates are easily customizable. Just click the DOWNLOAD button shown below. Edit the colour, text, font size, add or delete the content as per the requirement. Download this deck now and engage your audience with this ready made presentation.
Another Sample Leverage Buyout Model Template. In addition, will provide an empty version which allows you to input your own information.
http://flevy.com/browse/business-document/Sample-LBO-Model-Template---2-27
Income statement Functional Format,Linear cost Function,Method of Analyzing cost,Comparison of variable costing , unit cost computation, Illustration of variable costing , evaluation of results. Managerial Accounting
This presentation was delivered at the April 23, 2009 Smart-ups event in Eugene, OR by Dan Vishny (CFO for two start-ups companies). Dan is also known for having one of the top 10 best scores on the CPA exam - for the entire U.S.A.!
As Europe's leading economic powerhouse and the fourth-largest hashtag#economy globally, Germany stands at the forefront of innovation and industrial might. Renowned for its precision engineering and high-tech sectors, Germany's economic structure is heavily supported by a robust service industry, accounting for approximately 68% of its GDP. This economic clout and strategic geopolitical stance position Germany as a focal point in the global cyber threat landscape.
In the face of escalating global tensions, particularly those emanating from geopolitical disputes with nations like hashtag#Russia and hashtag#China, hashtag#Germany has witnessed a significant uptick in targeted cyber operations. Our analysis indicates a marked increase in hashtag#cyberattack sophistication aimed at critical infrastructure and key industrial sectors. These attacks range from ransomware campaigns to hashtag#AdvancedPersistentThreats (hashtag#APTs), threatening national security and business integrity.
🔑 Key findings include:
🔍 Increased frequency and complexity of cyber threats.
🔍 Escalation of state-sponsored and criminally motivated cyber operations.
🔍 Active dark web exchanges of malicious tools and tactics.
Our comprehensive report delves into these challenges, using a blend of open-source and proprietary data collection techniques. By monitoring activity on critical networks and analyzing attack patterns, our team provides a detailed overview of the threats facing German entities.
This report aims to equip stakeholders across public and private sectors with the knowledge to enhance their defensive strategies, reduce exposure to cyber risks, and reinforce Germany's resilience against cyber threats.
Show drafts
volume_up
Empowering the Data Analytics Ecosystem: A Laser Focus on Value
The data analytics ecosystem thrives when every component functions at its peak, unlocking the true potential of data. Here's a laser focus on key areas for an empowered ecosystem:
1. Democratize Access, Not Data:
Granular Access Controls: Provide users with self-service tools tailored to their specific needs, preventing data overload and misuse.
Data Catalogs: Implement robust data catalogs for easy discovery and understanding of available data sources.
2. Foster Collaboration with Clear Roles:
Data Mesh Architecture: Break down data silos by creating a distributed data ownership model with clear ownership and responsibilities.
Collaborative Workspaces: Utilize interactive platforms where data scientists, analysts, and domain experts can work seamlessly together.
3. Leverage Advanced Analytics Strategically:
AI-powered Automation: Automate repetitive tasks like data cleaning and feature engineering, freeing up data talent for higher-level analysis.
Right-Tool Selection: Strategically choose the most effective advanced analytics techniques (e.g., AI, ML) based on specific business problems.
4. Prioritize Data Quality with Automation:
Automated Data Validation: Implement automated data quality checks to identify and rectify errors at the source, minimizing downstream issues.
Data Lineage Tracking: Track the flow of data throughout the ecosystem, ensuring transparency and facilitating root cause analysis for errors.
5. Cultivate a Data-Driven Mindset:
Metrics-Driven Performance Management: Align KPIs and performance metrics with data-driven insights to ensure actionable decision making.
Data Storytelling Workshops: Equip stakeholders with the skills to translate complex data findings into compelling narratives that drive action.
Benefits of a Precise Ecosystem:
Sharpened Focus: Precise access and clear roles ensure everyone works with the most relevant data, maximizing efficiency.
Actionable Insights: Strategic analytics and automated quality checks lead to more reliable and actionable data insights.
Continuous Improvement: Data-driven performance management fosters a culture of learning and continuous improvement.
Sustainable Growth: Empowered by data, organizations can make informed decisions to drive sustainable growth and innovation.
By focusing on these precise actions, organizations can create an empowered data analytics ecosystem that delivers real value by driving data-driven decisions and maximizing the return on their data investment.
Levelwise PageRank with Loop-Based Dead End Handling Strategy : SHORT REPORT ...Subhajit Sahu
Abstract — Levelwise PageRank is an alternative method of PageRank computation which decomposes the input graph into a directed acyclic block-graph of strongly connected components, and processes them in topological order, one level at a time. This enables calculation for ranks in a distributed fashion without per-iteration communication, unlike the standard method where all vertices are processed in each iteration. It however comes with a precondition of the absence of dead ends in the input graph. Here, the native non-distributed performance of Levelwise PageRank was compared against Monolithic PageRank on a CPU as well as a GPU. To ensure a fair comparison, Monolithic PageRank was also performed on a graph where vertices were split by components. Results indicate that Levelwise PageRank is about as fast as Monolithic PageRank on the CPU, but quite a bit slower on the GPU. Slowdown on the GPU is likely caused by a large submission of small workloads, and expected to be non-issue when the computation is performed on massive graphs.
Adjusting primitives for graph : SHORT REPORT / NOTESSubhajit Sahu
Graph algorithms, like PageRank Compressed Sparse Row (CSR) is an adjacency-list based graph representation that is
Multiply with different modes (map)
1. Performance of sequential execution based vs OpenMP based vector multiply.
2. Comparing various launch configs for CUDA based vector multiply.
Sum with different storage types (reduce)
1. Performance of vector element sum using float vs bfloat16 as the storage type.
Sum with different modes (reduce)
1. Performance of sequential execution based vs OpenMP based vector element sum.
2. Performance of memcpy vs in-place based CUDA based vector element sum.
3. Comparing various launch configs for CUDA based vector element sum (memcpy).
4. Comparing various launch configs for CUDA based vector element sum (in-place).
Sum with in-place strategies of CUDA mode (reduce)
1. Comparing various launch configs for CUDA based vector element sum (in-place).
Chatty Kathy - UNC Bootcamp Final Project Presentation - Final Version - 5.23...John Andrews
SlideShare Description for "Chatty Kathy - UNC Bootcamp Final Project Presentation"
Title: Chatty Kathy: Enhancing Physical Activity Among Older Adults
Description:
Discover how Chatty Kathy, an innovative project developed at the UNC Bootcamp, aims to tackle the challenge of low physical activity among older adults. Our AI-driven solution uses peer interaction to boost and sustain exercise levels, significantly improving health outcomes. This presentation covers our problem statement, the rationale behind Chatty Kathy, synthetic data and persona creation, model performance metrics, a visual demonstration of the project, and potential future developments. Join us for an insightful Q&A session to explore the potential of this groundbreaking project.
Project Team: Jay Requarth, Jana Avery, John Andrews, Dr. Dick Davis II, Nee Buntoum, Nam Yeongjin & Mat Nicholas
Opendatabay - Open Data Marketplace.pptxOpendatabay
Opendatabay.com unlocks the power of data for everyone. Open Data Marketplace fosters a collaborative hub for data enthusiasts to explore, share, and contribute to a vast collection of datasets.
First ever open hub for data enthusiasts to collaborate and innovate. A platform to explore, share, and contribute to a vast collection of datasets. Through robust quality control and innovative technologies like blockchain verification, opendatabay ensures the authenticity and reliability of datasets, empowering users to make data-driven decisions with confidence. Leverage cutting-edge AI technologies to enhance the data exploration, analysis, and discovery experience.
From intelligent search and recommendations to automated data productisation and quotation, Opendatabay AI-driven features streamline the data workflow. Finding the data you need shouldn't be a complex. Opendatabay simplifies the data acquisition process with an intuitive interface and robust search tools. Effortlessly explore, discover, and access the data you need, allowing you to focus on extracting valuable insights. Opendatabay breaks new ground with a dedicated, AI-generated, synthetic datasets.
Leverage these privacy-preserving datasets for training and testing AI models without compromising sensitive information. Opendatabay prioritizes transparency by providing detailed metadata, provenance information, and usage guidelines for each dataset, ensuring users have a comprehensive understanding of the data they're working with. By leveraging a powerful combination of distributed ledger technology and rigorous third-party audits Opendatabay ensures the authenticity and reliability of every dataset. Security is at the core of Opendatabay. Marketplace implements stringent security measures, including encryption, access controls, and regular vulnerability assessments, to safeguard your data and protect your privacy.
Techniques to optimize the pagerank algorithm usually fall in two categories. One is to try reducing the work per iteration, and the other is to try reducing the number of iterations. These goals are often at odds with one another. Skipping computation on vertices which have already converged has the potential to save iteration time. Skipping in-identical vertices, with the same in-links, helps reduce duplicate computations and thus could help reduce iteration time. Road networks often have chains which can be short-circuited before pagerank computation to improve performance. Final ranks of chain nodes can be easily calculated. This could reduce both the iteration time, and the number of iterations. If a graph has no dangling nodes, pagerank of each strongly connected component can be computed in topological order. This could help reduce the iteration time, no. of iterations, and also enable multi-iteration concurrency in pagerank computation. The combination of all of the above methods is the STICD algorithm. [sticd] For dynamic graphs, unchanged components whose ranks are unaffected can be skipped altogether.
Algorithmic optimizations for Dynamic Levelwise PageRank (from STICD) : SHORT...
Financial forecast diazcales-2
1. Net Income indicator
Cash Flow indicator
Q1 Q2 Q3 Q4 Q1 Q2
Unit Volume 1200 1200 1200 1200 1200 1200
Unit Price $20 $20 $20 $20 $20 $20
Cost per Unit Sold $0.03 $0.03 $0.03 $0.03 $0.03 $0.03
Gross Sales $24,000 $24,000 $24,000 $24,000 $24,000 $24,000
(Cost of Goods Sold) $36.00 $36.00 $36.00 $36.00 $36.00 $36.00
(Commission Percentage) 15% 15% 15% 15% 15% 15%
Net Sales $20,369 $20,369 $20,369 $20,369 $20,369 $20,369
Unit Volume 840 840 840 840 840 840
Unit Price $7 $7 $7 $7 $7 $7
Cost per Unit Sold $1 $1 $1 $1 $1 $1
Gross Sales $5,880 $5,880 $5,880 $5,880 $5,880 $5,880
Year Two
Sales Projections
Year One
Ticket Sales
Beverages
2. (Cost of Goods Sold) $840 $840 $840 $840 $840 $840
(Commission Percentage) 0% 0% 0% 0% 0% 0%
Net Sales $5,040 $5,040 $5,040 $5,040 $5,040 $5,040
Unit Volume 360 360 360 360 360 360
Unit Price $16 $16 $16 $16 $16 $16
Cost per Unit Sold $3.25 $3.25 $3.25 $3.25 $3.25 $3.25
Gross Sales $5,760 $5,760 $5,760 $5,760 $5,760 $5,760
(Cost of Goods Sold) $1,170 $1,170 $1,170 $1,170 $1,170 $1,170
(Commission Percentage) 50% 50% 50% 50% 50% 50%
Net Sales $2,295 $2,295 $2,295 $2,295 $2,295 $2,295
Total Unit Volume 2,400 2,400 2,400 2,400 2,400 2,400
Total Gross Sales $35,640 $35,640 $35,640 $35,640 $35,640 $35,640
(Total Cost of Goods Sold) $2,046 $2,046 $2,046 $2,046 $2,046 $2,046
(Total Commissions Paid) $5,890 $5,890 $5,890 $5,890 $5,890 $5,890
Total Net Sales $27,704 $27,704 $27,704 $27,704 $27,704 $27,704
Assumptions:
Merchanside (locked) 30% of ticket buyers buy merchandise
Beverages (changeable) 70% of ticket buyers buy an average of 1 beverages
Beverage Industry Average for U.S. Bar & Nightclub (estimate)
65% order drinks most to all the time with males ordering more frequently than females. Surprisingly, Millenni
http://www.nciaa.com/content.aspx?page_id=22&club_id=160641&module_id=29898
Total: All Products/Services
Merchandise
3. The average consumer order 2.3 drinks per occasion with males ordering more than females and Millennials ordering m
4. (1,790,847)
Year One Year Two 2-Year Total
Q3 Q4 Total Total 1 2
1200 1200 4,800 4,800 9,600 $668 $1,200
$20 $20 - - Q2 vs. Q1
$0.03 $0.03 - - 0%
$24,000 $24,000 $96,000 $96,000 $192,000
$36.00 $36.00 Sales growing over time?
15% 15% - - 0%
$20,369 $20,369 $81,478 $81,478 $162,955 points for this dynamic (allocatio
your growth points
840 840 3,360 3,360 6,720 Perfectly Exponential
$7 $7 - Perfectly Linear
$1 $1 - This Forecast
$5,880 $5,880 $23,520 $23,520 $47,040 As a proportion out of 100%
Year OneYear Two
FORECAST SUMMARY
5. $840 $840 points for this dynamic (allocatio
0% 0% - - - your growth points
$5,040 $5,040 $20,160 $20,160 $40,320
YOUR TOTAL POINTS %
Total Points Possible
360 360 1,440 1,440 2,880 Your Total Points
$16 $16 - - -
$3.25 $3.25 - - -
$5,760 $5,760 $23,040 $23,040 $46,080
$1,170 $1,170
50% 50% - - -
$2,295 $2,295 $9,180 $9,180 $18,360
2,400 2,400 9,600 9,600 19,200
$35,640 $35,640 $142,560 $142,560 $285,120
$2,046 $2,046 $8,184 $8,184 $16,368
$5,890 $5,890 $23,558 $23,558 $47,117
$27,704 $27,704 $110,818 $110,818 $221,635
rprisingly, Millennials order less frequently than older consumers
7. 3 4 5 6 7 8
slope
$1,200 $1,200 $1,200 $1,200 $1,200 $1,200 532 7 76.00
Q3 vs. Q2 Q4 vs. Q3 Q1 vs. Q4 Q2 vs. Q1 Q3 vs. Q2 Q4 vs. Q3
0% 0% 0% 0% 0% 0%
LINEST SLOPE L/S
Sales growing over time? 0 44.33333 76 1
overall rate
oints for this dynamic (allocation) 25%
our growth points 0%
Perfectly Exponential L/S = 2
Perfectly Linear L/S = 1
his Forecast L/S = 0.58
As a proportion out of 100% 29%
Year One Year Two
8. oints for this dynamic (allocation) 75%
our growth points 22%
YOUR TOTAL POINTS % 22%
otal Points Possible 20
Your Total Points 4