SlideShare a Scribd company logo
South Dakota Trading Relationships -- 2004 - 2010                                                                                                                                            Mexico
                                                                                                                                                                                                    Domestic
                                                                                                                                                                                                     Canada


                                                                                                                                                              2009-2010 2009-2010      2004-2010 2004-2010
                                                                 2004          2005          2006          2007          2008          2009          2010     Difference % Change      Difference % Change
Mexico
Truck            Exports                                  $102,998,469 $119,812,770 $125,291,929 $115,481,049 $114,883,591 $104,587,675 $169,502,550         $64,914,875     62.1%    $66,504,081       64.6%
                 Imports                                   $98,030,101 $138,772,671 $118,179,973 $17,450,180 $12,141,396 $20,353,912 $40,889,356             $20,535,444    100.9%   -$57,140,745      -58.3%
                 Total Truck Trade with Mexico            $201,028,570 $258,585,441 $243,471,902 $132,931,229 $127,024,987 $124,941,587 $210,391,906         $85,450,319     68.4%     $9,363,336        4.7%
                                                                                                                                                                           #DIV/0!
Rail             Exports                                   $28,009,810   $35,620,533   $45,630,731 $121,160,850 $175,842,233 $128,463,608 $169,188,865       $40,725,257     31.7%   $141,179,055      504.0%
                 Imports                                    $2,255,695     $270,805     $1,965,693   $6,323,621 $11,460,539    $2,326,217   $3,547,870        $1,221,653     52.5%     $1,292,175       57.3%
                 Total Rail Trade with Mexico              $30,265,505   $35,891,338   $47,596,424 $127,484,471 $187,302,772 $130,789,825 $172,736,735       $41,946,910     32.1%   $142,471,230      470.7%
                                                                                                                                                                           #DIV/0!
TOTAL            Exports                                  $131,008,279 $155,433,303 $170,922,660 $236,641,899 $290,725,824 $233,051,283 $338,691,415 $105,640,132            45.3%   $207,683,136      158.5%
                 Imports                                  $105,254,164 $139,043,476 $120,145,666 $23,773,801 $23,601,935 $22,680,129 $44,437,226 $21,757,097                 95.9%   -$55,848,570      -57.8%
                 Total Trade with Mexico                  $231,294,075 $294,476,779 $291,068,326 $260,415,700 $314,327,759 $255,731,412 $383,128,641 $127,397,229            49.8%   $151,834,566       65.6%


Laredo, TX

Truck            Exports                               $91,369,338 $101,696,662 $78,608,592          $72,089,357   $83,013,967   $71,529,260 $125,435,030    $53,905,770     75.4%    $34,065,692       37.3%
                           % of Total Exports to Mexico      88.7%        84.9%        62.7%              62.4%         72.3%         68.4%        74.0%                      5.6%                     -14.7%
                 Imports                                $6,597,587 $22,954,169 $26,714,716           $17,128,852   $10,466,393   $15,298,199 $31,798,261     $16,500,062    107.9%    $25,200,674      382.0%
                          % of Total Imports to Mexico        6.4%        16.5%        22.6%              98.2%         86.2%         75.2%        77.8%                      2.6%                      71.4%
                 Total Truck Trade Thru Laredo          $97,966,925 $124,650,831 $105,323,308        $89,218,209   $93,480,360   $86,827,459 $157,233,291    $70,405,832     81.1%    $59,266,366       60.5%
                            % Total Trade with Mexico        48.7%        48.2%        43.3%              67.1%         73.6%         69.5%        74.7%                      5.2%                      26.0%

Rail             Exports                               $26,592,628       $22,712,509   $28,342,744   $59,407,271   $71,377,170   $54,052,331   $69,278,087   $15,225,756     28.2%    $42,685,459      160.5%
                           % of Total Exports to Mexico      94.9%            63.8%         62.1%         49.0%         40.6%         42.1%         40.9%                    -1.1%                     -54.0%
                 Imports                                  $916,918         $219,578      $686,135             $0     $514,448        $52,167       $43,341       -$8,826    -16.9%      -$873,577      -95.3%
                          % of Total Imports to Mexico       40.6%            81.1%         34.9%          0.0%          4.5%          2.2%          1.2%                    -1.0%                     -39.4%
                 Total Rail Trade Thru Laredo           $27,509,546      $22,932,087   $29,028,879   $59,407,271   $71,891,618   $54,104,498   $69,321,428   $15,216,930     28.1%    $41,811,882      152.0%
                             % Total Trade with Mexico       90.9%            63.9%         61.0%         46.6%         38.4%         41.4%         40.1%                    -1.2%                     -50.8%

TOTAL
                 Exports                               $117,961,966 $124,409,171 $106,951,336 $131,496,628 $154,391,137 $125,581,591 $194,713,117            $69,131,526     55.0% $76,751,151          65.1%
                           % of Total Exports to Mexico      90.0%        80.0%        62.6%        55.6%        53.1%        53.9%        57.5%                              3.6%                     -32.6%
                 Imports                                 $7,514,505 $23,173,747 $27,400,851 $17,128,852 $10,980,841 $15,350,366 $31,841,602                  $16,491,236    107.4% $24,327,097         323.7%
                          % of Total Imports to Mexico        7.1%        16.7%        22.8%        72.0%        46.5%        67.7%        71.7%                              4.0%                      64.5%
                 Total Trade Thru Laredo               $125,476,471 $147,582,918 $134,352,187 $148,625,480 $165,371,978 $140,931,957 $226,554,719            $85,622,762     60.8% $101,078,248         80.6%
                            % Total Trade with Mexico        54.2%        50.1%        46.2%        57.1%        52.6%        55.1%        59.1%                              4.0%                       4.9%
South Dakota Trading Relationships -- 2004 - 2010                                                                                                                                             Mexico
                                                                                                                                                                                                    Domestic
                                                                                                                                                                                                     Canada


                                                                                                                                                              2009-2010 2009-2010      2004-2010 2004-2010
                                                                2004          2005          2006          2007            2008          2009          2010    Difference % Change      Difference % Change
Eagle Pass, TX


Truck            Exports                                     $37,320       $11,348       $31,315     $1,198,139        $53,750      $623,326      $372,307    -$251,019      -40.3%     $334,987      897.6%
                           % of Total Exports to Mexico         0.0%         0.0%          0.0%           1.0%           0.0%          0.6%          0.2%                     -0.4%                      0.2%
                 Imports                                           $0           $0            $0             $0             $0            $0            $0           $0    #DIV/0!            $0     #DIV/0!
                          % of Total Imports to Mexico          0.0%         0.0%          0.0%           0.0%           0.0%          0.0%          0.0%                      0.0%                      0.0%
                 Total Truck Trade Thru Eagle Pass          8,687,358      $11,348       $31,315     $1,198,139        $53,750      $623,326      $372,307    -$251,019      -40.3%     $334,987       -95.7%
                            % Total Trade with Mexico           4.3%         0.0%          0.0%           0.9%           0.0%          0.5%          0.2%                     -0.3%                     -4.1%

Rail             Exports                                    $548,682    $12,166,690    $9,209,231   $52,628,509     $62,113,783   $35,096,585   $43,276,107   $8,179,522     23.3%    $42,727,425     7787.3%
                           % of Total Exports to Mexico         2.0%         34.2%         20.2%         43.4%           35.3%         27.3%         25.6%                   -1.7%                      23.6%
                 Imports                                           $0            $0    $1,135,495    $5,977,132     $10,946,091    $2,274,050    $3,504,529   $1,230,479     54.1%     $3,504,529    #DIV/0!
                          % of Total Imports to Mexico          0.0%          0.0%         57.8%         94.5%           95.5%         97.8%         98.8%                    1.0%                      98.8%
                 Total Rail Trade Thru Eagle Pass            $548,682   $12,166,690   $10,344,726   $58,605,641     $73,059,874   $37,370,635   $46,780,636   $9,410,001     25.2%    $46,231,954     8426.0%
                             % Total Trade with Mexico          1.8%         33.9%         21.7%         46.0%           39.0%         28.6%         27.1%                   -1.5%                      25.3%

TOTAL
                 Exports                                    $586,002    $12,178,038    $9,240,546   $53,826,648     $62,167,533   $35,719,911   $43,648,414   $7,928,503     22.2%    $43,062,412     7348.5%
                           % of Total Exports to Mexico        0.4%           7.8%          5.4%         22.7%           21.4%         15.3%         12.9%                   -2.4%                      12.4%
                 Imports                                          $0             $0    $1,135,495    $5,977,132     $10,946,091    $2,274,050    $3,504,529   $1,230,479     54.1%     $3,504,529    #DIV/0!
                          % of Total Imports to Mexico         0.0%           0.0%          0.9%         25.1%           46.4%         10.0%          7.9%                   -2.1%                       7.9%
                 Total Trade Thru Eagle Pass                $586,002    $12,178,038   $10,376,041   $59,803,780     $73,113,624   $37,993,961   $47,152,943   $9,158,982     24.1%    $46,566,941     7946.5%
                            % Total Trade with Mexico          0.3%           4.1%          3.6%         23.0%           23.3%         14.9%         12.3%                   -2.5%                      12.1%

Del Rio, TX

Truck            Exports                                           $0      $18,650             $0     $156,930               $0            $0            $0          $0    #DIV/0!            $0     #DIV/0!
                           % of Total Exports to Mexico         0.0%         0.0%           0.0%         0.1%             0.0%          0.0%          0.0%                     0.0%                      0.0%
                 Imports                                           $0           $0             $0           $0               $0            $0            $0          $0    #DIV/0!            $0     #DIV/0!
                          % of Total Imports to Mexico          0.0%         0.0%           0.0%         0.0%             0.0%          0.0%          0.0%                     0.0%                      0.0%
                 Total Truck Trade Thru Del Rio                    $0      $18,650             $0     $156,930               $0            $0            $0          $0    #DIV/0!            $0     #DIV/0!
                            % Total Trade with Mexico           0.0%         0.0%           0.0%         0.1%             0.0%          0.0%          0.0%                     0.0%                      0.0%

Rail             Exports                                           $0            $0                                                                                  $0    #DIV/0!            $0     #DIV/0!
                           % of Total Exports to Mexico         0.0%          0.0%                   #DIV/0!         #DIV/0!       #DIV/0!       #DIV/0!                   #DIV/0!                   #DIV/0!
                 Imports                                           $0            $0                                                                                  $0    #DIV/0!            $0     #DIV/0!
                          % of Total Imports to Mexico          0.0%          0.0%                   #DIV/0!         #DIV/0!       #DIV/0!       #DIV/0!                   #DIV/0!                   #DIV/0!
                 Total Rail Trade Thru Del Rio                     $0            $0                                                                                  $0    #DIV/0!            $0     #DIV/0!
                             % Total Trade with Mexico          0.0%          0.0%                             $0         0.0%          0.0%          0.0%                     0.0%                      0.0%

TOTAL
                 Exports                                           $0      $18,650             $0     $156,930               $0            $0            $0          $0    #DIV/0!            $0     #DIV/0!
                           % of Total Exports to Mexico         0.0%         0.0%           0.0%         0.1%             0.0%          0.0%          0.0%                     0.0%                      0.0%
                 Imports                                           $0           $0             $0           $0               $0            $0            $0          $0    #DIV/0!            $0     #DIV/0!
                          % of Total Imports to Mexico          0.0%         0.0%           0.0%         0.0%             0.0%          0.0%          0.0%                     0.0%                      0.0%
                 Total Trade Thru Del Rio                          $0      $18,650             $0     $156,930               $0            $0            $0          $0    #DIV/0!            $0     #DIV/0!
                            % Total Trade with Mexico           0.0%         0.0%           0.0%         0.1%             0.0%          0.0%          0.0%                     0.0%                      0.0%
South Dakota Trading Relationships -- 2004 - 2010                                                                                                                                       Mexico
                                                                                                                                                                                              Domestic
                                                                                                                                                                                               Canada


                                                                                                                                                          2009-2010 2009-2010    2004-2010 2004-2010
                                                               2004          2005          2006         2007          2008          2009         2010     Difference % Change    Difference % Change

GPITC
                                                                   0
Truck           Exports                                  $91,406,658 $101,726,660 $78,639,907     $73,444,426   $83,067,717   $72,152,586 $125,807,337   $53,654,751    74.4%   $34,400,679       37.6%
                          % of Total Exports to Mexico        88.7%        84.9%        62.8%          63.6%         72.3%         69.0%        74.2%                    5.2%                    -14.5%
                Imports                                   $6,597,587 $22,954,169 $26,714,716      $17,128,852   $10,466,393   $15,298,199 $31,798,261    $16,500,062   107.9%   $25,200,674      382.0%
                         % of Total Imports to Mexico          6.4%        16.5%        22.6%          98.2%         86.2%         75.2%        77.8%                    2.6%                     71.4%
                Total Truck Trade Thru GPITC             $98,004,245 $124,680,829 $105,354,623    $90,573,278   $93,534,110   $87,450,785 $157,605,598   $70,154,813    80.2%   $59,601,353       60.8%
                           % Total Trade with Mexico          48.8%        48.2%        43.3%          68.1%         73.6%         70.0%        74.9%                    4.9%                     26.2%

Rail            Exports                                  $27,141,310   $34,879,199   $37,551,975 $112,035,780 $133,490,953    $89,148,916 $112,554,194   $23,405,278    26.3%   $85,412,884      314.7%
                          % of Total Exports to Mexico        96.9%         97.9%         82.3%        92.5%        75.9%          69.4%        66.5%                   -2.9%                    -30.4%
                Imports                                    $916,918      $219,578     $1,821,630   $5,977,132 $11,460,539      $2,326,217   $3,547,870    $1,221,653    52.5%    $2,630,952      286.9%
                         % of Total Imports to Mexico          0.0%         81.1%         92.7%        94.5%       100.0%         100.0%       100.0%                    0.0%                    100.0%
                Total Rail Trade Thru GPITC              $28,058,228   $35,098,777   $39,373,605 $118,012,912 $144,951,492    $91,475,133 $116,102,064   $24,626,931    26.9%   $88,043,836      313.8%
                            % Total Trade with Mexico         92.7%         97.8%         82.7%        92.6%        77.4%          69.9%        67.2%                   -2.7%                    -25.5%

TOTAL
                Exports                               $118,547,968 $136,605,859 $116,191,882 $185,480,206 $216,558,670 $161,301,502 $238,361,531         $77,060,029    47.8% $119,813,563       101.1%
                          % of Total Exports to Mexico      90.5%        87.9%        68.0%        78.4%        74.5%        69.2%        70.4%                          1.2%                    -20.1%
                Imports                                 $7,514,505 $23,173,747 $28,536,346 $23,105,984 $21,926,932 $17,624,416 $35,346,131               $17,721,715   100.6% $27,831,626        370.4%
                         % of Total Imports to Mexico        7.1%        16.7%        23.8%        97.2%        92.9%        77.7%        79.5%                          1.8%                     72.4%
                Total Trade Thru GPITC                $126,062,473 $159,779,606 $144,728,228 $208,586,190 $238,485,602 $178,925,918 $273,707,662         $94,781,744    53.0% $147,645,189       117.1%
                           % Total Trade with Mexico        54.5%        54.3%        49.7%        80.1%        75.9%        70.0%        71.4%                          1.5%                     16.9%
South Dakota Trading Relationships -- 2004 - 2010                                                                                                                   Mexico
                                                                                                                                                                     Domestic
                                                                                                                                                                      Canada


2010         Leading Exports from South Dakota to Mexico (Surface          2010    2010         Leading Exports from South Dakota to Mexico (Surface         2010
             Transportation)

                                                                                                Transportation)
Rank                                                                      Export   Rank         Coahuila                                                   Export
1       2    Meat and Edible Offal                                  $116,801,275   1       23   Food Residues and Waste                                  $161,505
2       23   Food Residues and Waste                                 $97,613,845   2       84   Computer-Related Machinery and Parts                      $71,396
3       15   Animal or Vegetable Fats and Oils                       $66,011,144   3        1   Live Animals                                              $71,000
4       41   Raw Hides and Skins                                     $15,832,022   4       95   Toys; Games and Sport Equipment                           $33,408
5       76   Aluminum and Articles                                   $12,626,413   5       12   Oil Seeds and Oleaginous Fruits                           $25,331
6       84   Computer-Related Machinery and Parts                     $9,426,086   6       39   Plastics and Articles                                     $22,602
7       5    Products of Animal Origin                                $5,626,056   7
8       12   Oil Seeds and Oleaginous Fruits                          $3,555,351   8
9       10   Cereals                                                  $2,293,853   9
10      48   Paper and Paperboard                                     $2,007,496   10

 2010        Leading Imports to South Dakota from Mexico (Surface           2010    2010        Leading Exports from South Dakota to Mexico (Surface         2010
Rank                                                                      Import   Rank         Nuevo Leon                                                  Export
1       87   Vehicles Other than Railway                             $25,848,454   1        2   Meat and Edible Offal                                  $35,989,616
2       84   Computer-Related Machinery and Parts                    $11,060,873   2       84   Computer-Related Machinery and Parts                    $3,829,079
3       48   Paper and Paperboard                                     $4,791,617   3       48   Paper and Paperboard                                    $1,777,111
4       94   Furniture; Lamps and Prefabricated Buildings             $1,043,929   4        5   Products of Animal Origin                               $1,417,409
5       73   Articles of Iron and Steel                                $667,085    5       10   Cereals                                                 $1,092,991
6       5    Products of Animal Origin                                 $365,289    6       15   Animal or Vegetable Fats and Oils                        $673,804
7       98   Special Classification Provisions                         $189,021    7       44   Wood and Articles                                        $131,144
8       85   Electrical Machinery; Equipment and Parts                 $179,022    8       23   Food Residues and Waste                                  $125,848
9       39   Plastics and Articles                                       $80,430   9       95   Toys; Games and Sport Equipment                            $57,366
10      72   Iron and Steel                                              $73,441   10      39   Plastics and Articles                                      $47,769

                                                                                    2010        Leading Exports from South Dakota to Mexico (Surface         2010
                                                                                   Rank         Tamaulipas                                                  Export
                                                                                   1        2   Meat and Edible Offal                                   $1,258,724
                                                                                   2       23   Food Residues and Waste                                  $384,283
                                                                                   3        5   Products of Animal Origin                                $223,191
                                                                                   4       41   Raw Hides and Skins                                        $49,010
                                                                                   5       12   Oil Seeds and Oleaginous Fruits                            $13,677
                                                                                   6       87   Vehicles Other than Railway                                 $4,850
                                                                                   7
                                                                                   8
                                                                                   9
                                                                                   10
South Dakota Trading Relationships -- 2004 - 2010                                                                                              Mexico
                                                                                                                                                   Domestic
                                                                                                                                                    Canada


                                                                                                                                     Rail Truck
                                                                                                                                 Change Change
                                                                         Rail Truck        Domestic --                             2002-  2002-
        2002                    Domestic -- 2007                      Change Change                2015                             2015   2015
Exports      Rail Truck         Exports            Rail Truck                           Exports            Rail    Truck
Colorado       0    137 9%      Colorado             3    249    8%       0%     82%    Colorado              3      254    6%   #DIV/0!     86%
Montana        0    108 7%      Montana             17    191    7%   #DIV/0!    77%    Montana              21      161    4%   #DIV/0!     49%
Nebraska       0    409 27%     Nebraska             1    843   27%   #DIV/0!   106%    Nebraska              1    1,451   35%   #DIV/0!    255%
New Mexico     0     27 2%      New Mexico           4     26    1%   #DIV/0!    -4%    New Mexico            4       26    1%   #DIV/0!     -3%
Oklahoma       0     55 4%      Oklahoma             2    128    4%   #DIV/0!   133%    Oklahoma              2    1,083   26%   #DIV/0!   1869%
North Dakota   1    199 13%     North Dakota         0    645   21%    -100%    224%    North Dakota       -         135    3%    -100%     -32%
South Dakota                    South Dakota                                            South Dakota
Texas          0    452 30%     Texas              145   476 20% #DIV/0!          5%    Texas              155       454 15% #DIV/0!         1%
Wyoming        0    122 8%      Wyoming              0   372 12% #DIV/0!        205%    Wyoming            -         382   9% #DIV/0!      213%
Total ($m)     1 1,509          Total ($m)         173 2,930 100% 17187%         94%    Total ($m)         186     3,946 100% 18473%       161%
                  1,510                                3,103                    105%                               4,132                   174%

Imports      Rail Truck         Imports            Rail Truck                           Imports           Rail    Truck
Colorado       0    187   10%   Colorado                  227    7%   #DIV/0!    21%    Colorado           -         261   4%    #DIV/0!    39%
Montana       40    146   10%   Montana              4    114    4%     -90%    -22%    Montana               2      164   3%      -94%     12%
Nebraska       0    720   40%   Nebraska                1,783   54%   #DIV/0!   148%    Nebraska           -       2,338  38%    #DIV/0!   225%
New Mexico     0      0    0%   New Mexico                       0%   #DIV/0! #DIV/0!   New Mexico         -           2   0%    #DIV/0! #DIV/0!
North Dakota   0    513   28%   North Dakota              745   22%   #DIV/0!    45%    Oklahoma             12    1,791  30%    #DIV/0!   249%
Oklahoma       0     26    1%   Oklahoma                   86    3%   #DIV/0!   231%    North Dakota       -         104   2%    #DIV/0!   299%
South Dakota                    South Dakota                                            South Dakota                        0
Texas          0    106   6%    Texas                           0% #DIV/0!      -100%   Texas              116       970 18%     #DIV/0!   815%
Wyoming        0     64   4%    Wyoming              22   335 11% #DIV/0!        423%   Wyoming             26       297   5%    #DIV/0!   364%
Total ($m)    40 1,762          Total ($m)           26 3,290 100%   -35%         87%   Total ($m)         156     5,926 100%      291%    236%
                  1,802                                 3,316                     84%                              6,083                   238%

TOTAL        Rail Truck         TOTALS             Rail Truck                           TOTALS            Rail    Truck
Colorado       0    324 10%     Colorado             3    476    7%   #DIV/0!    47%    Colorado              3      515   5%    #DIV/0!    59%
Montana       40    254 9%      Montana             21    305    5%     -48%     20%    Montana              23      324   3%      -42%     28%
Nebraska       0 1,129 34%      Nebraska             1 2,626    41%   #DIV/0!   133%    Nebraska              1    3,789  37%    #DIV/0!   236%
New Mexico     0     27 1%      New Mexico           4     26    0%   #DIV/0!    -4%    New Mexico            4       28   0%    #DIV/0!     4%
North Dakota   0    568 17%     North Dakota         2    873   14%   #DIV/0!    54%    North Dakota        14     2,874  28%    #DIV/0!   406%
Oklahoma       1    225 7%      Oklahoma             0    731   11%    -100%    225%    Oklahoma           -         238   2%     -100%      6%
South Dakota                    South Dakota                                            South Dakota                        0
Texas          0    558 17%     Texas              145   476 10% #DIV/0!        -15%    South Dakota       271     1,425 17%     #DIV/0!   155%
Wyoming        0    186 6%      Wyoming             22   707 11% #DIV/0!        280%    Texas               26       679   7%    #DIV/0!   265%
Total ($m)    41 3,271          Total ($m)         199 6,220 100%  385%          90%    Total ($m)         342     9,872 100%    #DIV/0!   202%
                  3,312                                6,419                     94%                              10,214                   208%
South Dakota Trading Relationships -- 2004 - 2010                                                                                                                                  Mexico
                                                                                                                                                                                          Domestic
                                                                                                                                                                                           Canada


                                                                                                                                                             2009-2010 2009-2010      2004-2010 2004-2010
                                                                       2004         2005         2006         2007         2008         2009         2010    Difference % Change      Difference % Change
Canada
Truck              Exports                                   $223,756,926.00 $289,146,722 $362,179,714 $492,820,413 $458,625,817 $314,362,860 $365,384,613 $51,021,753      16.2%   $141,627,687     63.3%
                   Imports                                   $285,791,567.00 $325,748,601 $335,625,432 $352,771,656 $326,494,603 $226,884,296 $257,678,166 $30,793,870      13.6%   -$28,113,401     -9.8%
                   Total Truck Trade with Canada             $509,548,493.00 $614,895,323 $697,805,146 $845,592,069 $785,120,420 $541,247,156 $623,062,779 $81,815,623      15.1%   $113,514,286     22.3%
                                                                                                                                                                         #DIV/0!
Rail               Exports                                    $14,565,826.00 $18,090,204 $13,981,968 $13,037,193 $44,973,379 $47,262,688 $35,363,107 -$11,899,581          -25.2%    $20,797,281     142.8%
                   Imports                                    $91,626,462.00 $107,475,220 $101,342,612 $88,754,772 $101,777,066 $72,433,998 $87,758,398 $15,324,400         21.2%    -$3,868,064      -4.2%
                   Total Rail Trade with Canada              $106,192,288.00 $125,565,424 $115,324,580 $101,791,965 $146,750,445 $119,696,686 $123,121,505 $3,424,819        2.9%    $16,929,217      15.9%
                                                                                                                                                                         #DIV/0!
TOTAL              Exports                                   $238,322,752.00 $307,236,926 $376,161,682 $505,857,606 $503,599,196 $361,625,548 $400,747,720 $39,122,172      10.8%   $162,424,968     68.2%
                   Imports                                   $377,418,029.00 $433,223,821 $436,968,044 $441,526,428 $428,271,669 $299,318,294 $345,436,564 $46,118,270      15.4%   -$31,981,465     -8.5%
                   Total Trade with Canada                   $615,740,781.00 $740,460,747 $813,129,726 $947,384,034 $931,870,865 $660,943,842 $746,184,284 $85,240,442      12.9%   $130,443,503     21.2%


Raymond, MT

Truck              Exports                                         $917,406     $757,092    $2,671,443   $2,079,077   $4,567,837   $2,460,923   $2,945,323    $484,400     19.7%      $2,027,917     221.0%
                             % of Total Exports to Canada              0.4%         0.3%         0.7%         0.4%         1.0%         0.8%         0.8%                   0.0%                       0.4%
                   Imports                                       $2,364,561    $2,713,700   $3,037,268   $4,504,015   $5,029,431   $2,301,453   $2,428,305    $126,852      5.5%        $63,744        2.7%
                             % of Total Imports to Canada              0.8%         0.8%         0.9%         1.3%         1.5%         1.0%         0.9%                  -0.1%                       0.1%
                   Total Truck Trade Thru Raymond                 $3,281,967   $3,470,792   $5,708,711   $6,583,092   $9,597,268   $4,762,376   $5,373,628    $611,252     12.8%      $2,091,661      63.7%
                                % Total Trade with Canada              0.6%         0.6%         0.8%         0.8%         1.2%         0.9%         0.9%                   0.0%                       0.2%

Rail               Exports                                               $0            $0                                                                          $0    #DIV/0!             $0    #DIV/0!
                             % of Total Exports to Canada              0.0%         0.0%         0.0%         0.0%         0.0%         0.0%         0.0%                    0.0%                      0.0%
                   Imports                                               $0            $0                                                                          $0    #DIV/0!             $0    #DIV/0!
                             % of Total Imports to Canada              0.0%         0.0%         0.0%         0.0%         0.0%         0.0%         0.0%                    0.0%                      0.0%
                   Total Truck Trade Thru Raymond                         $0           $0                        $0           $0           $0           $0         $0    #DIV/0!             $0    #DIV/0!
                                % Total Trade with Canada              0.0%         0.0%         0.0%         0.0%         0.0%         0.0%         0.0%                    0.0%                      0.0%

TOTAL
                   Exports                                        $917,406      $757,092    $2,671,443   $2,079,077   $4,567,837   $2,460,923   $2,945,323    $484,400     19.7%      $2,027,917     221.0%
                             % of Total Exports to Canada             0.4%          0.2%         0.7%         0.4%         0.9%         0.7%         0.7%                   0.1%                       0.4%
                   Imports                                       $2,364,561    $2,713,700   $3,037,268   $4,504,015   $5,029,431   $2,301,453   $2,428,305    $126,852      5.5%        $63,744        2.7%
                             % of Total Imports to Canada             0.6%          0.6%         0.7%         1.0%         1.2%         0.8%         0.7%                  -0.1%                       0.1%
                   Total Trade Thru Raymond                      $3,281,967    $3,470,792   $5,708,711   $6,583,092   $9,597,268   $4,762,376   $5,373,628    $611,252     12.8%      $2,091,661      63.7%
                                % Total Trade with Canada             0.5%          0.5%         0.7%         0.7%         1.0%         0.7%         0.7%                   0.0%                       0.2%
South Dakota Trading Relationships -- 2004 - 2010                                                                                                                                   Mexico
                                                                                                                                                                                          Domestic
                                                                                                                                                                                           Canada


                                                                                                                                                               2009-2010 2009-2010    2004-2010 2004-2010
                                                                   2004          2005          2006          2007          2008          2009          2010    Difference % Change    Difference % Change
Sweet Grass, MT


Truck             Exports                                   $26,178,994    $51,689,683   $56,045,215   $60,933,584   $67,825,266    $7,977,495   $10,002,061   $2,024,566   25.4% -$16,176,933       -61.8%
                            % of Total Exports to Canada          11.7%         17.9%         15.5%         12.4%         14.8%          2.5%          2.7%                  0.2%                     -9.0%
                  Imports                                    $17,294,411   $16,033,922   $11,695,223   $17,181,498   $26,079,519   $19,992,081   $23,570,227   $3,578,146   17.9%   $6,275,816        36.3%
                            % of Total Exports to Canada           6.1%          4.9%          3.5%          4.9%          8.0%          8.8%          9.1%                  0.3%                      3.1%
                  Total Truck Trade Thru Sweet Grass          43,473,405   $67,723,605   $67,740,438   $78,115,082   $93,904,785   $27,969,576   $33,572,288   $5,602,712   20.0% -$9,901,117        -22.8%
                               % Total Trade with Canada           8.5%         11.0%          9.7%          9.2%         12.0%          5.2%          5.4%                  0.2%                     -3.1%

Rail              Exports                                     $105,216              $0       $30,141       $22,255            $0       $67,159       $20,745     -$46,414   -69.1%      -$84,471     -80.3%
                            % of Total Exports to Canada          0.7%           0.0%          0.2%          0.2%          0.0%          0.1%          0.1%                  -0.1%                    -0.7%
                  Imports                                    $8,934,857     $9,552,766   $14,152,046   $14,561,532   $21,061,188    $8,053,836    $9,469,980   $1,416,144    17.6%     $535,123        6.0%
                             % of Total Exports to Canada         9.8%           8.9%         14.0%         16.4%         20.7%         11.1%         10.8%                  -0.3%                     1.0%
                  Total Rail Trade Thru Sweet Grass          $9,040,073     $9,552,766   $14,182,187   $14,583,787   $21,061,188    $8,120,995    $9,490,725   $1,369,730    16.9%     $450,652        5.0%
                               % Total Trade with Canada          8.5%           7.6%         12.3%         14.3%         14.4%          6.8%          7.7%                   0.9%                    -0.8%

TOTAL
                  Exports                                   $26,284,210    $51,689,683   $56,075,356   $60,955,839 $67,825,266      $8,044,654   $10,022,806   $1,978,152   24.6% -$16,261,404       -61.9%
                            % of Total Exports to Canada         11.0%          16.8%         14.9%         12.0%        13.5%           2.2%          2.5%                  0.3%                     -8.5%
                  Imports                                   $26,229,268    $25,586,688   $25,847,269   $31,743,030 $47,140,707     $28,045,917   $33,040,207   $4,994,290   17.8%   $6,810,939        26.0%
                            % of Total Imports to Canada          6.9%           5.9%          5.9%          7.2%        11.0%           9.4%          9.6%                  0.2%                      2.6%
                  Total Trade Thru Sweet Grass              $52,513,478    $77,276,371   $81,922,625   $92,698,869 $114,965,973    $36,090,571   $43,063,013   $6,972,442   19.3% -$9,450,465        -18.0%
                               % Total Trade with Canada          8.5%          10.4%         10.1%          9.8%        12.3%           5.5%          5.8%                  0.3%                     -2.8%

Portal, ND

Truck             Exports                                   $17,603,171    $21,743,768   $32,937,774   $47,127,269 $57,402,547     $31,854,074   $50,923,036 $19,068,962    59.9%    $33,319,865     189.3%
                            % of Total Exports to Canada          7.9%           7.5%          9.1%          9.6%        12.5%          10.1%         13.9%                  3.8%                      6.1%
                  Imports                                   $28,285,335    $35,069,472   $37,339,843   $50,677,165 $48,134,984     $42,205,560   $48,687,792 $6,482,232     15.4%    $20,402,457      72.1%
                            % of Total Imports to Canada         12.6%          10.8%          0.0%         14.4%        14.7%          18.6%         18.9%                  0.3%                      6.3%
                  Total Truck Trade Thru Portal             $45,888,506    $56,813,240   $70,277,617   $97,804,434 $105,537,531    $74,059,634   $99,610,828 $25,551,194    34.5%    $53,722,322     117.1%
                               % Total Trade with Canada          9.0%           9.2%         10.1%         11.6%        13.4%          13.7%         16.0%                  2.3%                      7.0%

Rail              Exports                                    $8,039,014    $13,692,901    $7,620,481    $6,675,889   $35,762,942   $23,146,695   $23,297,650 $15,677,169     0.7%    $15,258,636     189.8%
                            % of Total Exports to Canada         55.2%          75.7%         54.5%         51.2%         79.5%         49.0%         65.9%                 16.9%                     10.7%
                  Imports                                    $8,136,062    $18,407,215   $23,104,947   $12,963,837    $9,524,628   $17,161,200   $21,163,730 -$1,941,217    23.3%    $13,027,668     160.1%
                             % of Total Imports to Canada         8.9%          17.1%         22.8%         14.6%          9.4%         23.7%         24.1%                  0.4%                     15.2%
                  Total Rail Trade Thru Portal              $16,175,076    $32,100,116   $30,725,428   $19,639,726   $45,287,570   $40,307,895   $44,461,380 $13,735,952    10.3%    $28,286,304     174.9%
                               % Total Trade with Canada         15.2%          25.6%         26.6%         19.3%         30.9%         33.7%         36.1%                  2.4%                     20.9%

TOTAL
                  Exports                                   $25,642,185    $35,436,669 $40,558,255 $53,803,158 $93,165,489 $55,000,769 $74,220,686 $19,219,917              34.9%    $48,578,501     189.4%
                            % of Total Exports to Canada         10.8%          11.5%        10.8%        10.6%        18.5%        15.2%        18.5%                       3.3%                      7.8%
                  Imports                                   $36,421,397    $53,476,687 $60,444,790 $63,641,002 $57,659,612 $59,366,760 $69,851,522 $10,484,762              17.7%    $33,430,125      91.8%
                            % of Total Imports to Canada          9.7%          12.3%        13.8%        14.4%        13.5%        19.8%        20.2%                       0.4%                     10.6%
                  Total Trade Thru Portal                   $62,063,582    $88,913,356 $101,003,045 $117,444,160 $150,825,101 $114,367,529 $144,072,208 $29,704,679         26.0%    $82,008,626     132.1%
                               % Total Trade with Canada         10.1%          12.0%        12.4%        12.4%        16.2%        17.3%        19.3%                       2.0%                      9.2%
South Dakota Trading Relationships -- 2004 - 2010                                                                                                                                     Mexico
                                                                                                                                                                                            Domestic
                                                                                                                                                                                             Canada


                                                                                                                                                               2009-2010 2009-2010      2004-2010 2004-2010
                                                                   2004          2005          2006          2007          2008          2009          2010    Difference % Change      Difference % Change

Wild Horse
                                                                       0
Truck             Exports                                             $0           $0            $0            $0            $0            $0            $0           $0    #DIV/0!            $0    #DIV/0!
                            % of Total Exports to Canada           0.0%         0.0%          0.0%         19.4%          0.0%          0.0%          0.0%                      0.0%                     0.0%
                  Imports                                             $0      $58,816       $68,260        $8,506      $229,654      $253,232      $246,317       -$6,915      -2.7%     $246,317    #DIV/0!
                            % of Total Imports to Canada           0.0%         0.0%          0.0%         19.0%          0.1%          0.1%          0.1%                      0.0%                     0.1%
                  Total Truck Trade Thru GPITC                        $0      $58,816       $68,260        $8,506      $229,654      $253,232      $246,317       -$6,915      -2.7%     $246,317    #DIV/0!
                               % Total Trade with Canada           0.0%         0.0%          0.0%         19.3%          0.0%          0.0%          0.0%                      0.0%                     0.0%

Rail              Exports                                             $0            $0            $0            $0            $0            $0            $0          $0    #DIV/0!            $0    #DIV/0!
                            % of Total Exports to Canada           0.0%          0.0%          0.0%         11.0%          0.0%          0.0%          0.0%                     0.0%                     0.0%
                  Imports                                             $0            $0            $0            $0            $0            $0            $0          $0    #DIV/0!            $0    #DIV/0!
                             % of Total Imports to Canada          0.0%          0.0%          0.0%         22.4%          0.0%          0.0%          0.0%                     0.0%                     0.0%
                  Total Rail Trade Thru GPITC                         $0            $0            $0            $0            $0            $0            $0          $0    #DIV/0!            $0    #DIV/0!
                               % Total Trade with Canada           0.0%          0.0%          0.0%         17.7%          0.0%          0.0%          0.0%                     0.0%                     0.0%

TOTAL
                  Exports                                             $0           $0            $0            $0            $0            $0            $0           $0    #DIV/0!            $0    #DIV/0!
                            % of Total Exports to Canada           0.0%         0.0%          0.0%          0.0%          0.0%          0.0%          0.0%                      0.0%                     0.0%
                  Imports                                             $0      $58,816       $68,260        $8,506      $229,654      $253,232      $246,317       -$6,915      -2.7%     $246,317    #DIV/0!
                            % of Total Imports to Canada           0.0%         0.0%          0.0%          0.0%          0.1%          0.1%          0.1%                      0.0%                     0.1%
                  Total Trade Thru GPITC                              $0      $58,816       $68,260        $8,506      $229,654      $253,232      $246,317       -$6,915      -2.7%     $246,317    #DIV/0!
                               % Total Trade with Canada           0.0%         0.0%          0.0%          0.0%          0.0%          0.0%          0.0%                      0.0%                     0.0%

GPITC
                                                             #DIV/0!
Truck             Exports                                    $44,699,571 $74,190,543 $91,654,432 $110,139,930 $129,795,650 $42,292,492 $63,870,420 $21,577,928                51.0%    $19,170,849     42.9%
                            % of Total Exports to Canada          20.0%        25.7%        25.3%        22.3%        28.3%        13.5%        17.5%                          4.0%                    -2.5%
                  Imports                                    $46,497,152 $51,919,302 $51,774,769 $69,946,246 $79,011,994 $64,911,796 $75,449,659 $10,537,863                  16.2%    $28,952,507     62.3%
                            % of Total Imports to Canada          16.3%        15.9%        15.4%        19.8%        24.2%        28.6%        29.3%                          0.7%                    13.0%
                  Total Truck Trade Thru GPITC               $91,196,723 $126,109,845 $143,429,201 $180,086,176 $208,807,644 $107,204,288 $139,320,079 $32,115,791            30.0%    $48,123,356     52.8%
                               % Total Trade with Canada          17.9%        20.5%        20.6%        21.3%        26.6%        19.8%        22.4%                          2.6%                     4.5%

Rail              Exports                                     $8,144,230   $13,692,901    $7,650,622    $6,698,144   $35,762,942   $23,213,854   $23,318,395    $104,541       0.5%    $15,174,165     186.3%
                            % of Total Exports to Canada           3.6%          4.7%          2.1%          1.4%          7.8%          7.4%          6.4%                   -1.0%                      2.7%
                  Imports                                    $17,070,919   $27,959,981   $37,256,993   $27,525,369   $30,585,816   $25,215,036   $30,633,710   $5,418,674     21.5%    $13,562,791      79.4%
                             % of Total Imports to Canada          6.0%          8.6%         11.1%          7.8%          9.4%         11.1%         11.9%                    0.8%                      5.9%
                  Total Rail Trade Thru GPITC                $25,215,149   $41,652,882   $44,907,615   $34,223,513   $66,348,758   $48,428,890   $53,952,105   $5,523,215     11.4%    $28,736,956     114.0%
                               % Total Trade with Canada           4.9%          6.8%          6.4%          4.0%          8.5%          8.9%          8.7%                   -0.3%                      3.7%

TOTAL
                  Exports                                    $52,843,801 $87,883,444 $99,305,054 $116,838,074 $165,558,592 $65,506,346 $87,188,815 $21,682,469                33.1%    $34,345,014     65.0%
                            % of Total Exports to Canada          22.2%        28.6%        26.4%        23.1%        32.9%        18.1%        21.8%                          3.6%                    -0.4%
                  Imports                                    $63,568,071 $79,879,283 $89,031,762 $97,471,615 $109,597,810 $90,126,832 $106,083,369 $15,956,537                17.7%    $42,515,298     66.9%
                            % of Total Imports to Canada          16.8%        18.4%        20.4%        22.1%        25.6%        30.1%        30.7%                          0.6%                    13.9%
                  Total Trade Thru GPITC                    $116,411,872 $167,762,727 $188,336,816 $214,309,689 $275,156,402 $155,633,178 $193,272,184 $37,639,006            24.2%    $76,860,312     66.0%
                               % Total Trade with Canada          18.9%        22.7%        23.2%        22.6%        29.5%        23.5%        25.9%                          2.4%                     7.0%
South Dakota Trading Relationships -- 2004 - 2010                                                                                                                   Mexico
                                                                                                                                                                    Domestic
                                                                                                                                                                     Canada


2010         Leading Exports from South Dakota to Canada (Surface         2010    2010         Leading Exports from South Dakota to Canada (Surface         2010
             Transportation)                                                                   Transportation)


Rank                                                                     Export   Rank         Alberta                                                     Export
1       84   Computer-Related Machinery and Parts                   $90,319,605   1       23   Food Residues and Waste                                $12,038,403
2       23   Food Residues and Waste                                $70,093,152   2       84   Computer-Related Machinery and Parts                    $3,832,379
3       87   Vehicles Other than Railway                            $61,333,456   3       76   Aluminum and Articles                                    $885,698
4       2    Meat and Edible Offal                                  $38,605,507   4       87   Vehicles Other than Railway                              $830,423
5       39   Plastics and Articles                                  $24,257,888   5       73   Articles of Iron and Steel                               $632,444
6       44   Wood and Articles                                      $11,433,175   6       10   Cereals                                                  $609,294
7       85   Electrical Machinery; Equipment and Parts              $10,408,324   7       39   Plastics and Articles                                    $478,019
8       71   Pearls; Stones; Metals and Imitation Jewelry           $10,081,640   8       95   Toys; Games and Sport Equipment                          $378,996
9       94   Furniture; Lamps and Prefabricated Buildings            $9,392,897   9        2   Meat and Edible Offal                                    $292,640
10      73   Articles of Iron and Steel                              $8,077,124   10      85   Electrical Machinery; Equipment and Parts                $288,814

 2010        Leading Imports to South Dakota from Canada (Surface          2010    2010        Leading Exports from South Dakota to Canada (Surface          2010
Rank                                                                     Import   Rank         British Colombia                                            Export
1       31   Fertilizers                                            $76,025,605   1        2   Meat and Edible Offal                                   $9,658,491
2       84   Computer-Related Machinery and Parts                   $61,813,232   2       84   Computer-Related Machinery and Parts                    $8,122,993
3       39   Plastics and Articles                                  $38,028,935   3       23   Food Residues and Waste                                 $6,414,193
4       98   Special Classification Provisions                      $29,463,389   4       39   Plastics and Articles                                   $3,630,654
5       87   Vehicles Other than Railway                            $21,119,254   5       22   Beverages; Spirits and Vinegar                          $2,489,091
6       44   Wood and Articles                                      $20,428,467   6       87   Vehicles Other than Railway                             $1,069,989
7       48   Paper and Paperboard                                   $17,730,294   7       85   Electrical Machinery; Equipment and Parts                $982,782
8       1    Live Animals                                           $15,580,842   8       73   Articles of Iron and Steel                               $410,799
9       2    Meat and Edible Offal                                  $13,861,364   9       10   Cereals                                                  $365,687
10      73   Articles of Iron and Steel                              $8,352,502   10      15   Animal or Vegetable Fats and Oils                        $221,074

                                                                                   2010        Leading Exports from South Dakota to Canada (Surface          2010
                                                                                  Rank         Saskatchewan                                                Export
                                                                                  1       84   Computer-Related Machinery and Parts                   $17,131,385
                                                                                  2       87   Vehicles Other than Railway                            $11,841,893
                                                                                  3       72   Iron and Steel                                          $6,105,101
                                                                                  4       73   Articles of Iron and Steel                              $5,217,106
                                                                                  5       23   Food Residues and Waste                                 $4,571,039
                                                                                  6       94   Furniture; Lamps and Prefabricated Buildings            $3,986,417
                                                                                  7       39   Plastics and Articles                                   $2,859,930
                                                                                  8       27   Mineral Fuels; Oils and Waxes                           $2,563,249
                                                                                  9       76   Aluminum and Articles                                   $2,194,936
                                                                                  10      90   Measuring and Testing Instruments                       $1,691,472

More Related Content

What's hot

Texas Trade through Ports-to-Plains Region – 2004-2010
Texas Trade through Ports-to-Plains Region – 2004-2010Texas Trade through Ports-to-Plains Region – 2004-2010
Texas Trade through Ports-to-Plains Region – 2004-2010Ports-To-Plains Blog
 
Montana Trading Relationship 2004-2011
Montana Trading Relationship 2004-2011Montana Trading Relationship 2004-2011
Montana Trading Relationship 2004-2011
Ports-To-Plains Blog
 
Nebraska Trade Relationships 2004 – 2011
Nebraska Trade Relationships 2004 – 2011Nebraska Trade Relationships 2004 – 2011
Nebraska Trade Relationships 2004 – 2011
Ports-To-Plains Blog
 
Texas Trade Relationships 2004 - 2011
Texas Trade Relationships 2004 - 2011Texas Trade Relationships 2004 - 2011
Texas Trade Relationships 2004 - 2011
Ports-To-Plains Blog
 
Principals of Business Finance
Principals of Business FinancePrincipals of Business Finance
Principals of Business Finance
Kathleen Boushele
 
Venture Backed Exits Q3 2008 - Capital Markets Crisis Remains
 	Venture Backed Exits Q3 2008 - Capital Markets Crisis Remains   	Venture Backed Exits Q3 2008 - Capital Markets Crisis Remains
Venture Backed Exits Q3 2008 - Capital Markets Crisis Remains mensa25
 
Q2 2017 CONDO MARKET REPORT
Q2 2017 CONDO MARKET REPORTQ2 2017 CONDO MARKET REPORT
Q2 2017 CONDO MARKET REPORT
Michelle Makos
 
Hhaf Defaultprob
Hhaf DefaultprobHhaf Defaultprob
Hhaf Defaultprob
brucekaufman
 
Market Watch June 2013
Market Watch June 2013Market Watch June 2013
Market Watch June 2013
Chaba Tamasi
 
Financial Forecasting
Financial ForecastingFinancial Forecasting
Financial Forecasting
JamariHodges1
 
Market Watch TORONTO 2015 OCTOBER
Market Watch TORONTO 2015 OCTOBERMarket Watch TORONTO 2015 OCTOBER
Market Watch TORONTO 2015 OCTOBER
Chaba Tamasi
 
September 2020 - Market Report - Toronto & GTA Housing Sales
September 2020 - Market Report - Toronto & GTA Housing SalesSeptember 2020 - Market Report - Toronto & GTA Housing Sales
September 2020 - Market Report - Toronto & GTA Housing Sales
Michelle Makos
 
Financial forecast
Financial forecastFinancial forecast
Financial forecast
MalenaApplewhite
 
Market Report for August 2017 - Residential Resale
Market Report for August 2017 - Residential ResaleMarket Report for August 2017 - Residential Resale
Market Report for August 2017 - Residential Resale
Michelle Makos
 
Results Tracker 16.08.2012,
Results Tracker 16.08.2012,Results Tracker 16.08.2012,
Results Tracker 16.08.2012,
Mansukh Investment & Trading Solutions
 
August 2021 market watch
August 2021 market watchAugust 2021 market watch
August 2021 market watch
Michelle Makos
 
Venture Capital Exits Q3 06
  	Venture Capital Exits Q3 06    	Venture Capital Exits Q3 06
Venture Capital Exits Q3 06 mensa25
 
Market watch jul 2019 frank yu oakville
Market watch jul 2019 frank yu oakvilleMarket watch jul 2019 frank yu oakville
Market watch jul 2019 frank yu oakville
Frank Yu
 

What's hot (20)

Texas Trade through Ports-to-Plains Region – 2004-2010
Texas Trade through Ports-to-Plains Region – 2004-2010Texas Trade through Ports-to-Plains Region – 2004-2010
Texas Trade through Ports-to-Plains Region – 2004-2010
 
Montana Trading Relationship 2004-2011
Montana Trading Relationship 2004-2011Montana Trading Relationship 2004-2011
Montana Trading Relationship 2004-2011
 
Nebraska Trade Relationships 2004 – 2011
Nebraska Trade Relationships 2004 – 2011Nebraska Trade Relationships 2004 – 2011
Nebraska Trade Relationships 2004 – 2011
 
Texas Trade Relationships 2004 - 2011
Texas Trade Relationships 2004 - 2011Texas Trade Relationships 2004 - 2011
Texas Trade Relationships 2004 - 2011
 
Principals of Business Finance
Principals of Business FinancePrincipals of Business Finance
Principals of Business Finance
 
Venture Backed Exits Q3 2008 - Capital Markets Crisis Remains
 	Venture Backed Exits Q3 2008 - Capital Markets Crisis Remains   	Venture Backed Exits Q3 2008 - Capital Markets Crisis Remains
Venture Backed Exits Q3 2008 - Capital Markets Crisis Remains
 
IT Industry Statistics 2007 Final Report
IT Industry Statistics 2007 Final ReportIT Industry Statistics 2007 Final Report
IT Industry Statistics 2007 Final Report
 
Q2 2017 CONDO MARKET REPORT
Q2 2017 CONDO MARKET REPORTQ2 2017 CONDO MARKET REPORT
Q2 2017 CONDO MARKET REPORT
 
Hhaf Defaultprob
Hhaf DefaultprobHhaf Defaultprob
Hhaf Defaultprob
 
Market Watch June 2013
Market Watch June 2013Market Watch June 2013
Market Watch June 2013
 
Financial Forecasting
Financial ForecastingFinancial Forecasting
Financial Forecasting
 
Market Watch TORONTO 2015 OCTOBER
Market Watch TORONTO 2015 OCTOBERMarket Watch TORONTO 2015 OCTOBER
Market Watch TORONTO 2015 OCTOBER
 
September 2020 - Market Report - Toronto & GTA Housing Sales
September 2020 - Market Report - Toronto & GTA Housing SalesSeptember 2020 - Market Report - Toronto & GTA Housing Sales
September 2020 - Market Report - Toronto & GTA Housing Sales
 
Financial forecast
Financial forecastFinancial forecast
Financial forecast
 
Q1 2009 Earning Report of Eagle Materials Inc.
Q1 2009 Earning Report of Eagle Materials Inc.Q1 2009 Earning Report of Eagle Materials Inc.
Q1 2009 Earning Report of Eagle Materials Inc.
 
Market Report for August 2017 - Residential Resale
Market Report for August 2017 - Residential ResaleMarket Report for August 2017 - Residential Resale
Market Report for August 2017 - Residential Resale
 
Results Tracker 16.08.2012,
Results Tracker 16.08.2012,Results Tracker 16.08.2012,
Results Tracker 16.08.2012,
 
August 2021 market watch
August 2021 market watchAugust 2021 market watch
August 2021 market watch
 
Venture Capital Exits Q3 06
  	Venture Capital Exits Q3 06    	Venture Capital Exits Q3 06
Venture Capital Exits Q3 06
 
Market watch jul 2019 frank yu oakville
Market watch jul 2019 frank yu oakvilleMarket watch jul 2019 frank yu oakville
Market watch jul 2019 frank yu oakville
 

Viewers also liked

US/Panama Business Council- Why Panama
US/Panama Business Council- Why PanamaUS/Panama Business Council- Why Panama
US/Panama Business Council- Why PanamaPorts-To-Plains Blog
 
Tocumen international airport expansion
Tocumen international airport expansionTocumen international airport expansion
Tocumen international airport expansionPorts-To-Plains Blog
 
Sondagem Industrial | novembro 2011
Sondagem Industrial | novembro 2011Sondagem Industrial | novembro 2011
Sondagem Industrial | novembro 2011
Confederação Nacional da Indústria
 
Informe Conjuntural | 1º trimestre de 2014 | Divulgação 11/04/2014
Informe Conjuntural | 1º trimestre de 2014 | Divulgação 11/04/2014Informe Conjuntural | 1º trimestre de 2014 | Divulgação 11/04/2014
Informe Conjuntural | 1º trimestre de 2014 | Divulgação 11/04/2014Confederação Nacional da Indústria
 
Apresentação: Pesquisa CNI/Ibope Retratos da Sociedade Brasileira - locomoçã...
Apresentação:  Pesquisa CNI/Ibope Retratos da Sociedade Brasileira - locomoçã...Apresentação:  Pesquisa CNI/Ibope Retratos da Sociedade Brasileira - locomoçã...
Apresentação: Pesquisa CNI/Ibope Retratos da Sociedade Brasileira - locomoçã...
Confederação Nacional da Indústria
 
Límites al derecho a difundir información
Límites al derecho a difundir informaciónLímites al derecho a difundir información
Límites al derecho a difundir información
oflores
 
INEC | Agosto/2011
INEC | Agosto/2011INEC | Agosto/2011
Pesquisa CNI/Ibope Retratos da Sociedade Brasileira: Segurança Pública | Outu...
Pesquisa CNI/Ibope Retratos da Sociedade Brasileira: Segurança Pública | Outu...Pesquisa CNI/Ibope Retratos da Sociedade Brasileira: Segurança Pública | Outu...
Pesquisa CNI/Ibope Retratos da Sociedade Brasileira: Segurança Pública | Outu...Confederação Nacional da Indústria
 
PT em Series . Dezembro
PT em Series . DezembroPT em Series . Dezembro
PT em Series . Dezembro
PtemSeries
 
Intenção de Investimentos na Indústria em 2013
Intenção de Investimentos na Indústria em 2013Intenção de Investimentos na Indústria em 2013
Intenção de Investimentos na Indústria em 2013
Confederação Nacional da Indústria
 
Pich Against The Machine
Pich Against The MachinePich Against The Machine
Pich Against The Machine
Sylvain Peigney
 
Presentacion
PresentacionPresentacion
Presentacion
manolo069
 
HTML5: Teknologi Aplikasi Masa Depan
HTML5: Teknologi Aplikasi Masa DepanHTML5: Teknologi Aplikasi Masa Depan
HTML5: Teknologi Aplikasi Masa Depan
Fitra Aditya
 

Viewers also liked (20)

US/Panama Business Council- Why Panama
US/Panama Business Council- Why PanamaUS/Panama Business Council- Why Panama
US/Panama Business Council- Why Panama
 
Tocumen international airport expansion
Tocumen international airport expansionTocumen international airport expansion
Tocumen international airport expansion
 
Proteines[1]
Proteines[1]Proteines[1]
Proteines[1]
 
20121203
2012120320121203
20121203
 
Sondagem Industrial | novembro 2011
Sondagem Industrial | novembro 2011Sondagem Industrial | novembro 2011
Sondagem Industrial | novembro 2011
 
Sondagem Industrial | Dezembro 2013 | Divulgação 24/01/2014
Sondagem Industrial | Dezembro 2013 | Divulgação 24/01/2014Sondagem Industrial | Dezembro 2013 | Divulgação 24/01/2014
Sondagem Industrial | Dezembro 2013 | Divulgação 24/01/2014
 
Informe Conjuntural | 1º trimestre de 2014 | Divulgação 11/04/2014
Informe Conjuntural | 1º trimestre de 2014 | Divulgação 11/04/2014Informe Conjuntural | 1º trimestre de 2014 | Divulgação 11/04/2014
Informe Conjuntural | 1º trimestre de 2014 | Divulgação 11/04/2014
 
Apresentação: Pesquisa CNI/Ibope Retratos da Sociedade Brasileira - locomoçã...
Apresentação:  Pesquisa CNI/Ibope Retratos da Sociedade Brasileira - locomoçã...Apresentação:  Pesquisa CNI/Ibope Retratos da Sociedade Brasileira - locomoçã...
Apresentação: Pesquisa CNI/Ibope Retratos da Sociedade Brasileira - locomoçã...
 
Timeislikeariver
TimeislikeariverTimeislikeariver
Timeislikeariver
 
Límites al derecho a difundir información
Límites al derecho a difundir informaciónLímites al derecho a difundir información
Límites al derecho a difundir información
 
INEC | Agosto/2011
INEC | Agosto/2011INEC | Agosto/2011
INEC | Agosto/2011
 
Pesquisa CNI/Ibope Retratos da Sociedade Brasileira: Segurança Pública | Outu...
Pesquisa CNI/Ibope Retratos da Sociedade Brasileira: Segurança Pública | Outu...Pesquisa CNI/Ibope Retratos da Sociedade Brasileira: Segurança Pública | Outu...
Pesquisa CNI/Ibope Retratos da Sociedade Brasileira: Segurança Pública | Outu...
 
PT em Series . Dezembro
PT em Series . DezembroPT em Series . Dezembro
PT em Series . Dezembro
 
Indicadores Industriais | Julho/2011
Indicadores Industriais | Julho/2011Indicadores Industriais | Julho/2011
Indicadores Industriais | Julho/2011
 
Intenção de Investimentos na Indústria em 2013
Intenção de Investimentos na Indústria em 2013Intenção de Investimentos na Indústria em 2013
Intenção de Investimentos na Indústria em 2013
 
Pich Against The Machine
Pich Against The MachinePich Against The Machine
Pich Against The Machine
 
Ratio pmr
Ratio pmrRatio pmr
Ratio pmr
 
Presentacion
PresentacionPresentacion
Presentacion
 
Feliz navidad
Feliz navidadFeliz navidad
Feliz navidad
 
HTML5: Teknologi Aplikasi Masa Depan
HTML5: Teknologi Aplikasi Masa DepanHTML5: Teknologi Aplikasi Masa Depan
HTML5: Teknologi Aplikasi Masa Depan
 

Similar to South Dakota Trade through Ports-to-Plains Region – 2004-2010

South Dakota Trade Relationships 2004-2011
South Dakota Trade Relationships 2004-2011South Dakota Trade Relationships 2004-2011
South Dakota Trade Relationships 2004-2011
Ports-To-Plains Blog
 
Colorado Trade Relationships 2004-2011
Colorado Trade Relationships 2004-2011Colorado Trade Relationships 2004-2011
Colorado Trade Relationships 2004-2011
Ports-To-Plains Blog
 
Oklahoma Trade Relationships 2004-2011
Oklahoma Trade Relationships 2004-2011Oklahoma Trade Relationships 2004-2011
Oklahoma Trade Relationships 2004-2011
Ports-To-Plains Blog
 
North Dakota Trade Relationships 2004-2011
North Dakota Trade Relationships 2004-2011North Dakota Trade Relationships 2004-2011
North Dakota Trade Relationships 2004-2011
Ports-To-Plains Blog
 
Ports-to-Plains Alliance Trade Summary 2004-2011
Ports-to-Plains Alliance Trade Summary 2004-2011Ports-to-Plains Alliance Trade Summary 2004-2011
Ports-to-Plains Alliance Trade Summary 2004-2011
Ports-To-Plains Blog
 
Naa Annual Newspaper Ad Expenditures 09
Naa Annual Newspaper Ad Expenditures 09Naa Annual Newspaper Ad Expenditures 09
Naa Annual Newspaper Ad Expenditures 09Juan Varela
 
Caída Publicidad EEUU 2009
Caída Publicidad EEUU 2009Caída Publicidad EEUU 2009
Caída Publicidad EEUU 2009Juan Varela
 
The 99% Tax Plan Taxation Schedules
The 99% Tax Plan Taxation SchedulesThe 99% Tax Plan Taxation Schedules
The 99% Tax Plan Taxation Schedules
darrick72
 
Swifton CFOs LLC - Boston BizSpark presentation - Financial Projections for I...
Swifton CFOs LLC - Boston BizSpark presentation - Financial Projections for I...Swifton CFOs LLC - Boston BizSpark presentation - Financial Projections for I...
Swifton CFOs LLC - Boston BizSpark presentation - Financial Projections for I...David Fogel
 
Slide presentation 2 q10
Slide presentation 2 q10Slide presentation 2 q10
Slide presentation 2 q10Cia Hering RI
 
Grendene - 15th Annual Latin America Conference - Citigroup
Grendene - 15th Annual Latin America Conference - CitigroupGrendene - 15th Annual Latin America Conference - Citigroup
Grendene - 15th Annual Latin America Conference - Citigroup
Grendene
 
Swifton CFOs - McCarter English - Fin Proj 100511
Swifton CFOs - McCarter English - Fin Proj 100511Swifton CFOs - McCarter English - Fin Proj 100511
Swifton CFOs - McCarter English - Fin Proj 100511David Fogel
 
Swifton - The Capital Network - Financial Projections
Swifton - The Capital Network - Financial ProjectionsSwifton - The Capital Network - Financial Projections
Swifton - The Capital Network - Financial Projections
David Fogel
 
July 2021 - Market Report
July 2021 - Market Report July 2021 - Market Report
July 2021 - Market Report
Michelle Makos
 
Cushman & Wakefield's Canadian Office Statistical Summary Q4 2018
Cushman & Wakefield's Canadian Office Statistical Summary Q4 2018Cushman & Wakefield's Canadian Office Statistical Summary Q4 2018
Cushman & Wakefield's Canadian Office Statistical Summary Q4 2018
Guy Masse
 
Slide presentation 1 q10
Slide presentation 1 q10Slide presentation 1 q10
Slide presentation 1 q10Cia Hering RI
 

Similar to South Dakota Trade through Ports-to-Plains Region – 2004-2010 (20)

South Dakota Trade Relationships 2004-2011
South Dakota Trade Relationships 2004-2011South Dakota Trade Relationships 2004-2011
South Dakota Trade Relationships 2004-2011
 
Colorado Trade Relationships 2004-2011
Colorado Trade Relationships 2004-2011Colorado Trade Relationships 2004-2011
Colorado Trade Relationships 2004-2011
 
Oklahoma Trade Relationships 2004-2011
Oklahoma Trade Relationships 2004-2011Oklahoma Trade Relationships 2004-2011
Oklahoma Trade Relationships 2004-2011
 
North Dakota Trade Relationships 2004-2011
North Dakota Trade Relationships 2004-2011North Dakota Trade Relationships 2004-2011
North Dakota Trade Relationships 2004-2011
 
Ports-to-Plains Alliance Trade Summary 2004-2011
Ports-to-Plains Alliance Trade Summary 2004-2011Ports-to-Plains Alliance Trade Summary 2004-2011
Ports-to-Plains Alliance Trade Summary 2004-2011
 
Naa Annual Newspaper Ad Expenditures 09
Naa Annual Newspaper Ad Expenditures 09Naa Annual Newspaper Ad Expenditures 09
Naa Annual Newspaper Ad Expenditures 09
 
Caída Publicidad EEUU 2009
Caída Publicidad EEUU 2009Caída Publicidad EEUU 2009
Caída Publicidad EEUU 2009
 
The 99% Tax Plan Taxation Schedules
The 99% Tax Plan Taxation SchedulesThe 99% Tax Plan Taxation Schedules
The 99% Tax Plan Taxation Schedules
 
Swifton CFOs LLC - Boston BizSpark presentation - Financial Projections for I...
Swifton CFOs LLC - Boston BizSpark presentation - Financial Projections for I...Swifton CFOs LLC - Boston BizSpark presentation - Financial Projections for I...
Swifton CFOs LLC - Boston BizSpark presentation - Financial Projections for I...
 
Slide presentation 2 q10
Slide presentation 2 q10Slide presentation 2 q10
Slide presentation 2 q10
 
Apimec 2 q05 results
Apimec   2 q05 resultsApimec   2 q05 results
Apimec 2 q05 results
 
Grendene - 15th Annual Latin America Conference - Citigroup
Grendene - 15th Annual Latin America Conference - CitigroupGrendene - 15th Annual Latin America Conference - Citigroup
Grendene - 15th Annual Latin America Conference - Citigroup
 
CNR_DCF(USD)
CNR_DCF(USD)CNR_DCF(USD)
CNR_DCF(USD)
 
Dcf
DcfDcf
Dcf
 
Swifton CFOs - McCarter English - Fin Proj 100511
Swifton CFOs - McCarter English - Fin Proj 100511Swifton CFOs - McCarter English - Fin Proj 100511
Swifton CFOs - McCarter English - Fin Proj 100511
 
Swifton - The Capital Network - Financial Projections
Swifton - The Capital Network - Financial ProjectionsSwifton - The Capital Network - Financial Projections
Swifton - The Capital Network - Financial Projections
 
July 2021 - Market Report
July 2021 - Market Report July 2021 - Market Report
July 2021 - Market Report
 
Cushman & Wakefield's Canadian Office Statistical Summary Q4 2018
Cushman & Wakefield's Canadian Office Statistical Summary Q4 2018Cushman & Wakefield's Canadian Office Statistical Summary Q4 2018
Cushman & Wakefield's Canadian Office Statistical Summary Q4 2018
 
1 q10
1 q101 q10
1 q10
 
Slide presentation 1 q10
Slide presentation 1 q10Slide presentation 1 q10
Slide presentation 1 q10
 

More from Ports-To-Plains Blog

Canada and U.S. Trade Overview
Canada and U.S. Trade Overview Canada and U.S. Trade Overview
Canada and U.S. Trade Overview
Ports-To-Plains Blog
 
2013 Ports-to-Plains Alliance Energy Conference Handouts
2013 Ports-to-Plains Alliance Energy Conference Handouts2013 Ports-to-Plains Alliance Energy Conference Handouts
2013 Ports-to-Plains Alliance Energy Conference Handouts
Ports-To-Plains Blog
 
Energy Development Impact on Transportation Infrastructure
Energy Development Impact on Transportation InfrastructureEnergy Development Impact on Transportation Infrastructure
Energy Development Impact on Transportation Infrastructure
Ports-To-Plains Blog
 
Wind Energy's Future and the Impact on U.S. Manufacturing
Wind Energy's Future and the Impact on U.S. ManufacturingWind Energy's Future and the Impact on U.S. Manufacturing
Wind Energy's Future and the Impact on U.S. Manufacturing
Ports-To-Plains Blog
 
Compressed Air Wind Energy Storage
Compressed Air Wind Energy StorageCompressed Air Wind Energy Storage
Compressed Air Wind Energy Storage
Ports-To-Plains Blog
 
Fuels Policy, Ethanol and RFS Reform Political and Policy Implications on Gas...
Fuels Policy, Ethanol and RFS Reform Political and Policy Implications on Gas...Fuels Policy, Ethanol and RFS Reform Political and Policy Implications on Gas...
Fuels Policy, Ethanol and RFS Reform Political and Policy Implications on Gas...
Ports-To-Plains Blog
 
Ports-to-Plains Letter Submitted to Department of State
Ports-to-Plains Letter Submitted to Department of StatePorts-to-Plains Letter Submitted to Department of State
Ports-to-Plains Letter Submitted to Department of State
Ports-To-Plains Blog
 
News Release Keystone XL Supporting SEIS Finding 041813
News Release Keystone XL Supporting SEIS Finding 041813News Release Keystone XL Supporting SEIS Finding 041813
News Release Keystone XL Supporting SEIS Finding 041813
Ports-To-Plains Blog
 
Ports-to-Plains: The Importance of a Statewide Transportation to Colorado's E...
Ports-to-Plains: The Importance of a Statewide Transportation to Colorado's E...Ports-to-Plains: The Importance of a Statewide Transportation to Colorado's E...
Ports-to-Plains: The Importance of a Statewide Transportation to Colorado's E...
Ports-To-Plains Blog
 
2013 Energy Conference Save the Date
2013 Energy Conference Save the Date2013 Energy Conference Save the Date
2013 Energy Conference Save the Date
Ports-To-Plains Blog
 
February 2013 Update from the Ports-to-Plains Alliance
February 2013 Update from the Ports-to-Plains AllianceFebruary 2013 Update from the Ports-to-Plains Alliance
February 2013 Update from the Ports-to-Plains Alliance
Ports-To-Plains Blog
 
Draft Supplemental EIS for the Keystone XL Project
Draft Supplemental EIS for the Keystone XL ProjectDraft Supplemental EIS for the Keystone XL Project
Draft Supplemental EIS for the Keystone XL Project
Ports-To-Plains Blog
 
PTP supports Heineman Keystone XL Pipeline Decision
PTP supports Heineman Keystone XL Pipeline DecisionPTP supports Heineman Keystone XL Pipeline Decision
PTP supports Heineman Keystone XL Pipeline Decision
Ports-To-Plains Blog
 
Keystone XL Letter Dec 2012 NEDEQ
Keystone XL Letter Dec 2012 NEDEQKeystone XL Letter Dec 2012 NEDEQ
Keystone XL Letter Dec 2012 NEDEQ
Ports-To-Plains Blog
 
News Release PTP Keystone XL Nebraska
News Release PTP Keystone XL NebraskaNews Release PTP Keystone XL Nebraska
News Release PTP Keystone XL Nebraska
Ports-To-Plains Blog
 
Ports-to-Plains Alliance Webinar 113012
Ports-to-Plains Alliance Webinar 113012Ports-to-Plains Alliance Webinar 113012
Ports-to-Plains Alliance Webinar 113012
Ports-To-Plains Blog
 
Comments on Interim Guidance on State Freight Plans and State Advisory Commit...
Comments on Interim Guidance on State Freight Plans and State Advisory Commit...Comments on Interim Guidance on State Freight Plans and State Advisory Commit...
Comments on Interim Guidance on State Freight Plans and State Advisory Commit...
Ports-To-Plains Blog
 
Interim Guidance on State Freight Plans and State Freight Advisory Committees
Interim Guidance on State Freight Plans and State Freight Advisory CommitteesInterim Guidance on State Freight Plans and State Freight Advisory Committees
Interim Guidance on State Freight Plans and State Freight Advisory Committees
Ports-To-Plains Blog
 
Ports-to-Plains Alliance Northern Working Group Strategic Plan October 2012
Ports-to-Plains Alliance Northern Working Group Strategic Plan October 2012Ports-to-Plains Alliance Northern Working Group Strategic Plan October 2012
Ports-to-Plains Alliance Northern Working Group Strategic Plan October 2012
Ports-To-Plains Blog
 
Return to Rural
Return to RuralReturn to Rural
Return to Rural
Ports-To-Plains Blog
 

More from Ports-To-Plains Blog (20)

Canada and U.S. Trade Overview
Canada and U.S. Trade Overview Canada and U.S. Trade Overview
Canada and U.S. Trade Overview
 
2013 Ports-to-Plains Alliance Energy Conference Handouts
2013 Ports-to-Plains Alliance Energy Conference Handouts2013 Ports-to-Plains Alliance Energy Conference Handouts
2013 Ports-to-Plains Alliance Energy Conference Handouts
 
Energy Development Impact on Transportation Infrastructure
Energy Development Impact on Transportation InfrastructureEnergy Development Impact on Transportation Infrastructure
Energy Development Impact on Transportation Infrastructure
 
Wind Energy's Future and the Impact on U.S. Manufacturing
Wind Energy's Future and the Impact on U.S. ManufacturingWind Energy's Future and the Impact on U.S. Manufacturing
Wind Energy's Future and the Impact on U.S. Manufacturing
 
Compressed Air Wind Energy Storage
Compressed Air Wind Energy StorageCompressed Air Wind Energy Storage
Compressed Air Wind Energy Storage
 
Fuels Policy, Ethanol and RFS Reform Political and Policy Implications on Gas...
Fuels Policy, Ethanol and RFS Reform Political and Policy Implications on Gas...Fuels Policy, Ethanol and RFS Reform Political and Policy Implications on Gas...
Fuels Policy, Ethanol and RFS Reform Political and Policy Implications on Gas...
 
Ports-to-Plains Letter Submitted to Department of State
Ports-to-Plains Letter Submitted to Department of StatePorts-to-Plains Letter Submitted to Department of State
Ports-to-Plains Letter Submitted to Department of State
 
News Release Keystone XL Supporting SEIS Finding 041813
News Release Keystone XL Supporting SEIS Finding 041813News Release Keystone XL Supporting SEIS Finding 041813
News Release Keystone XL Supporting SEIS Finding 041813
 
Ports-to-Plains: The Importance of a Statewide Transportation to Colorado's E...
Ports-to-Plains: The Importance of a Statewide Transportation to Colorado's E...Ports-to-Plains: The Importance of a Statewide Transportation to Colorado's E...
Ports-to-Plains: The Importance of a Statewide Transportation to Colorado's E...
 
2013 Energy Conference Save the Date
2013 Energy Conference Save the Date2013 Energy Conference Save the Date
2013 Energy Conference Save the Date
 
February 2013 Update from the Ports-to-Plains Alliance
February 2013 Update from the Ports-to-Plains AllianceFebruary 2013 Update from the Ports-to-Plains Alliance
February 2013 Update from the Ports-to-Plains Alliance
 
Draft Supplemental EIS for the Keystone XL Project
Draft Supplemental EIS for the Keystone XL ProjectDraft Supplemental EIS for the Keystone XL Project
Draft Supplemental EIS for the Keystone XL Project
 
PTP supports Heineman Keystone XL Pipeline Decision
PTP supports Heineman Keystone XL Pipeline DecisionPTP supports Heineman Keystone XL Pipeline Decision
PTP supports Heineman Keystone XL Pipeline Decision
 
Keystone XL Letter Dec 2012 NEDEQ
Keystone XL Letter Dec 2012 NEDEQKeystone XL Letter Dec 2012 NEDEQ
Keystone XL Letter Dec 2012 NEDEQ
 
News Release PTP Keystone XL Nebraska
News Release PTP Keystone XL NebraskaNews Release PTP Keystone XL Nebraska
News Release PTP Keystone XL Nebraska
 
Ports-to-Plains Alliance Webinar 113012
Ports-to-Plains Alliance Webinar 113012Ports-to-Plains Alliance Webinar 113012
Ports-to-Plains Alliance Webinar 113012
 
Comments on Interim Guidance on State Freight Plans and State Advisory Commit...
Comments on Interim Guidance on State Freight Plans and State Advisory Commit...Comments on Interim Guidance on State Freight Plans and State Advisory Commit...
Comments on Interim Guidance on State Freight Plans and State Advisory Commit...
 
Interim Guidance on State Freight Plans and State Freight Advisory Committees
Interim Guidance on State Freight Plans and State Freight Advisory CommitteesInterim Guidance on State Freight Plans and State Freight Advisory Committees
Interim Guidance on State Freight Plans and State Freight Advisory Committees
 
Ports-to-Plains Alliance Northern Working Group Strategic Plan October 2012
Ports-to-Plains Alliance Northern Working Group Strategic Plan October 2012Ports-to-Plains Alliance Northern Working Group Strategic Plan October 2012
Ports-to-Plains Alliance Northern Working Group Strategic Plan October 2012
 
Return to Rural
Return to RuralReturn to Rural
Return to Rural
 

South Dakota Trade through Ports-to-Plains Region – 2004-2010

  • 1. South Dakota Trading Relationships -- 2004 - 2010 Mexico Domestic Canada 2009-2010 2009-2010 2004-2010 2004-2010 2004 2005 2006 2007 2008 2009 2010 Difference % Change Difference % Change Mexico Truck Exports $102,998,469 $119,812,770 $125,291,929 $115,481,049 $114,883,591 $104,587,675 $169,502,550 $64,914,875 62.1% $66,504,081 64.6% Imports $98,030,101 $138,772,671 $118,179,973 $17,450,180 $12,141,396 $20,353,912 $40,889,356 $20,535,444 100.9% -$57,140,745 -58.3% Total Truck Trade with Mexico $201,028,570 $258,585,441 $243,471,902 $132,931,229 $127,024,987 $124,941,587 $210,391,906 $85,450,319 68.4% $9,363,336 4.7% #DIV/0! Rail Exports $28,009,810 $35,620,533 $45,630,731 $121,160,850 $175,842,233 $128,463,608 $169,188,865 $40,725,257 31.7% $141,179,055 504.0% Imports $2,255,695 $270,805 $1,965,693 $6,323,621 $11,460,539 $2,326,217 $3,547,870 $1,221,653 52.5% $1,292,175 57.3% Total Rail Trade with Mexico $30,265,505 $35,891,338 $47,596,424 $127,484,471 $187,302,772 $130,789,825 $172,736,735 $41,946,910 32.1% $142,471,230 470.7% #DIV/0! TOTAL Exports $131,008,279 $155,433,303 $170,922,660 $236,641,899 $290,725,824 $233,051,283 $338,691,415 $105,640,132 45.3% $207,683,136 158.5% Imports $105,254,164 $139,043,476 $120,145,666 $23,773,801 $23,601,935 $22,680,129 $44,437,226 $21,757,097 95.9% -$55,848,570 -57.8% Total Trade with Mexico $231,294,075 $294,476,779 $291,068,326 $260,415,700 $314,327,759 $255,731,412 $383,128,641 $127,397,229 49.8% $151,834,566 65.6% Laredo, TX Truck Exports $91,369,338 $101,696,662 $78,608,592 $72,089,357 $83,013,967 $71,529,260 $125,435,030 $53,905,770 75.4% $34,065,692 37.3% % of Total Exports to Mexico 88.7% 84.9% 62.7% 62.4% 72.3% 68.4% 74.0% 5.6% -14.7% Imports $6,597,587 $22,954,169 $26,714,716 $17,128,852 $10,466,393 $15,298,199 $31,798,261 $16,500,062 107.9% $25,200,674 382.0% % of Total Imports to Mexico 6.4% 16.5% 22.6% 98.2% 86.2% 75.2% 77.8% 2.6% 71.4% Total Truck Trade Thru Laredo $97,966,925 $124,650,831 $105,323,308 $89,218,209 $93,480,360 $86,827,459 $157,233,291 $70,405,832 81.1% $59,266,366 60.5% % Total Trade with Mexico 48.7% 48.2% 43.3% 67.1% 73.6% 69.5% 74.7% 5.2% 26.0% Rail Exports $26,592,628 $22,712,509 $28,342,744 $59,407,271 $71,377,170 $54,052,331 $69,278,087 $15,225,756 28.2% $42,685,459 160.5% % of Total Exports to Mexico 94.9% 63.8% 62.1% 49.0% 40.6% 42.1% 40.9% -1.1% -54.0% Imports $916,918 $219,578 $686,135 $0 $514,448 $52,167 $43,341 -$8,826 -16.9% -$873,577 -95.3% % of Total Imports to Mexico 40.6% 81.1% 34.9% 0.0% 4.5% 2.2% 1.2% -1.0% -39.4% Total Rail Trade Thru Laredo $27,509,546 $22,932,087 $29,028,879 $59,407,271 $71,891,618 $54,104,498 $69,321,428 $15,216,930 28.1% $41,811,882 152.0% % Total Trade with Mexico 90.9% 63.9% 61.0% 46.6% 38.4% 41.4% 40.1% -1.2% -50.8% TOTAL Exports $117,961,966 $124,409,171 $106,951,336 $131,496,628 $154,391,137 $125,581,591 $194,713,117 $69,131,526 55.0% $76,751,151 65.1% % of Total Exports to Mexico 90.0% 80.0% 62.6% 55.6% 53.1% 53.9% 57.5% 3.6% -32.6% Imports $7,514,505 $23,173,747 $27,400,851 $17,128,852 $10,980,841 $15,350,366 $31,841,602 $16,491,236 107.4% $24,327,097 323.7% % of Total Imports to Mexico 7.1% 16.7% 22.8% 72.0% 46.5% 67.7% 71.7% 4.0% 64.5% Total Trade Thru Laredo $125,476,471 $147,582,918 $134,352,187 $148,625,480 $165,371,978 $140,931,957 $226,554,719 $85,622,762 60.8% $101,078,248 80.6% % Total Trade with Mexico 54.2% 50.1% 46.2% 57.1% 52.6% 55.1% 59.1% 4.0% 4.9%
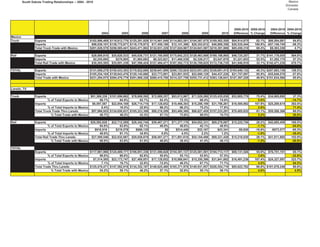
  • 2. South Dakota Trading Relationships -- 2004 - 2010 Mexico Domestic Canada 2009-2010 2009-2010 2004-2010 2004-2010 2004 2005 2006 2007 2008 2009 2010 Difference % Change Difference % Change Eagle Pass, TX Truck Exports $37,320 $11,348 $31,315 $1,198,139 $53,750 $623,326 $372,307 -$251,019 -40.3% $334,987 897.6% % of Total Exports to Mexico 0.0% 0.0% 0.0% 1.0% 0.0% 0.6% 0.2% -0.4% 0.2% Imports $0 $0 $0 $0 $0 $0 $0 $0 #DIV/0! $0 #DIV/0! % of Total Imports to Mexico 0.0% 0.0% 0.0% 0.0% 0.0% 0.0% 0.0% 0.0% 0.0% Total Truck Trade Thru Eagle Pass 8,687,358 $11,348 $31,315 $1,198,139 $53,750 $623,326 $372,307 -$251,019 -40.3% $334,987 -95.7% % Total Trade with Mexico 4.3% 0.0% 0.0% 0.9% 0.0% 0.5% 0.2% -0.3% -4.1% Rail Exports $548,682 $12,166,690 $9,209,231 $52,628,509 $62,113,783 $35,096,585 $43,276,107 $8,179,522 23.3% $42,727,425 7787.3% % of Total Exports to Mexico 2.0% 34.2% 20.2% 43.4% 35.3% 27.3% 25.6% -1.7% 23.6% Imports $0 $0 $1,135,495 $5,977,132 $10,946,091 $2,274,050 $3,504,529 $1,230,479 54.1% $3,504,529 #DIV/0! % of Total Imports to Mexico 0.0% 0.0% 57.8% 94.5% 95.5% 97.8% 98.8% 1.0% 98.8% Total Rail Trade Thru Eagle Pass $548,682 $12,166,690 $10,344,726 $58,605,641 $73,059,874 $37,370,635 $46,780,636 $9,410,001 25.2% $46,231,954 8426.0% % Total Trade with Mexico 1.8% 33.9% 21.7% 46.0% 39.0% 28.6% 27.1% -1.5% 25.3% TOTAL Exports $586,002 $12,178,038 $9,240,546 $53,826,648 $62,167,533 $35,719,911 $43,648,414 $7,928,503 22.2% $43,062,412 7348.5% % of Total Exports to Mexico 0.4% 7.8% 5.4% 22.7% 21.4% 15.3% 12.9% -2.4% 12.4% Imports $0 $0 $1,135,495 $5,977,132 $10,946,091 $2,274,050 $3,504,529 $1,230,479 54.1% $3,504,529 #DIV/0! % of Total Imports to Mexico 0.0% 0.0% 0.9% 25.1% 46.4% 10.0% 7.9% -2.1% 7.9% Total Trade Thru Eagle Pass $586,002 $12,178,038 $10,376,041 $59,803,780 $73,113,624 $37,993,961 $47,152,943 $9,158,982 24.1% $46,566,941 7946.5% % Total Trade with Mexico 0.3% 4.1% 3.6% 23.0% 23.3% 14.9% 12.3% -2.5% 12.1% Del Rio, TX Truck Exports $0 $18,650 $0 $156,930 $0 $0 $0 $0 #DIV/0! $0 #DIV/0! % of Total Exports to Mexico 0.0% 0.0% 0.0% 0.1% 0.0% 0.0% 0.0% 0.0% 0.0% Imports $0 $0 $0 $0 $0 $0 $0 $0 #DIV/0! $0 #DIV/0! % of Total Imports to Mexico 0.0% 0.0% 0.0% 0.0% 0.0% 0.0% 0.0% 0.0% 0.0% Total Truck Trade Thru Del Rio $0 $18,650 $0 $156,930 $0 $0 $0 $0 #DIV/0! $0 #DIV/0! % Total Trade with Mexico 0.0% 0.0% 0.0% 0.1% 0.0% 0.0% 0.0% 0.0% 0.0% Rail Exports $0 $0 $0 #DIV/0! $0 #DIV/0! % of Total Exports to Mexico 0.0% 0.0% #DIV/0! #DIV/0! #DIV/0! #DIV/0! #DIV/0! #DIV/0! Imports $0 $0 $0 #DIV/0! $0 #DIV/0! % of Total Imports to Mexico 0.0% 0.0% #DIV/0! #DIV/0! #DIV/0! #DIV/0! #DIV/0! #DIV/0! Total Rail Trade Thru Del Rio $0 $0 $0 #DIV/0! $0 #DIV/0! % Total Trade with Mexico 0.0% 0.0% $0 0.0% 0.0% 0.0% 0.0% 0.0% TOTAL Exports $0 $18,650 $0 $156,930 $0 $0 $0 $0 #DIV/0! $0 #DIV/0! % of Total Exports to Mexico 0.0% 0.0% 0.0% 0.1% 0.0% 0.0% 0.0% 0.0% 0.0% Imports $0 $0 $0 $0 $0 $0 $0 $0 #DIV/0! $0 #DIV/0! % of Total Imports to Mexico 0.0% 0.0% 0.0% 0.0% 0.0% 0.0% 0.0% 0.0% 0.0% Total Trade Thru Del Rio $0 $18,650 $0 $156,930 $0 $0 $0 $0 #DIV/0! $0 #DIV/0! % Total Trade with Mexico 0.0% 0.0% 0.0% 0.1% 0.0% 0.0% 0.0% 0.0% 0.0%
  • 3. South Dakota Trading Relationships -- 2004 - 2010 Mexico Domestic Canada 2009-2010 2009-2010 2004-2010 2004-2010 2004 2005 2006 2007 2008 2009 2010 Difference % Change Difference % Change GPITC 0 Truck Exports $91,406,658 $101,726,660 $78,639,907 $73,444,426 $83,067,717 $72,152,586 $125,807,337 $53,654,751 74.4% $34,400,679 37.6% % of Total Exports to Mexico 88.7% 84.9% 62.8% 63.6% 72.3% 69.0% 74.2% 5.2% -14.5% Imports $6,597,587 $22,954,169 $26,714,716 $17,128,852 $10,466,393 $15,298,199 $31,798,261 $16,500,062 107.9% $25,200,674 382.0% % of Total Imports to Mexico 6.4% 16.5% 22.6% 98.2% 86.2% 75.2% 77.8% 2.6% 71.4% Total Truck Trade Thru GPITC $98,004,245 $124,680,829 $105,354,623 $90,573,278 $93,534,110 $87,450,785 $157,605,598 $70,154,813 80.2% $59,601,353 60.8% % Total Trade with Mexico 48.8% 48.2% 43.3% 68.1% 73.6% 70.0% 74.9% 4.9% 26.2% Rail Exports $27,141,310 $34,879,199 $37,551,975 $112,035,780 $133,490,953 $89,148,916 $112,554,194 $23,405,278 26.3% $85,412,884 314.7% % of Total Exports to Mexico 96.9% 97.9% 82.3% 92.5% 75.9% 69.4% 66.5% -2.9% -30.4% Imports $916,918 $219,578 $1,821,630 $5,977,132 $11,460,539 $2,326,217 $3,547,870 $1,221,653 52.5% $2,630,952 286.9% % of Total Imports to Mexico 0.0% 81.1% 92.7% 94.5% 100.0% 100.0% 100.0% 0.0% 100.0% Total Rail Trade Thru GPITC $28,058,228 $35,098,777 $39,373,605 $118,012,912 $144,951,492 $91,475,133 $116,102,064 $24,626,931 26.9% $88,043,836 313.8% % Total Trade with Mexico 92.7% 97.8% 82.7% 92.6% 77.4% 69.9% 67.2% -2.7% -25.5% TOTAL Exports $118,547,968 $136,605,859 $116,191,882 $185,480,206 $216,558,670 $161,301,502 $238,361,531 $77,060,029 47.8% $119,813,563 101.1% % of Total Exports to Mexico 90.5% 87.9% 68.0% 78.4% 74.5% 69.2% 70.4% 1.2% -20.1% Imports $7,514,505 $23,173,747 $28,536,346 $23,105,984 $21,926,932 $17,624,416 $35,346,131 $17,721,715 100.6% $27,831,626 370.4% % of Total Imports to Mexico 7.1% 16.7% 23.8% 97.2% 92.9% 77.7% 79.5% 1.8% 72.4% Total Trade Thru GPITC $126,062,473 $159,779,606 $144,728,228 $208,586,190 $238,485,602 $178,925,918 $273,707,662 $94,781,744 53.0% $147,645,189 117.1% % Total Trade with Mexico 54.5% 54.3% 49.7% 80.1% 75.9% 70.0% 71.4% 1.5% 16.9%
  • 4. South Dakota Trading Relationships -- 2004 - 2010 Mexico Domestic Canada 2010 Leading Exports from South Dakota to Mexico (Surface 2010 2010 Leading Exports from South Dakota to Mexico (Surface 2010 Transportation) Transportation) Rank Export Rank Coahuila Export 1 2 Meat and Edible Offal $116,801,275 1 23 Food Residues and Waste $161,505 2 23 Food Residues and Waste $97,613,845 2 84 Computer-Related Machinery and Parts $71,396 3 15 Animal or Vegetable Fats and Oils $66,011,144 3 1 Live Animals $71,000 4 41 Raw Hides and Skins $15,832,022 4 95 Toys; Games and Sport Equipment $33,408 5 76 Aluminum and Articles $12,626,413 5 12 Oil Seeds and Oleaginous Fruits $25,331 6 84 Computer-Related Machinery and Parts $9,426,086 6 39 Plastics and Articles $22,602 7 5 Products of Animal Origin $5,626,056 7 8 12 Oil Seeds and Oleaginous Fruits $3,555,351 8 9 10 Cereals $2,293,853 9 10 48 Paper and Paperboard $2,007,496 10 2010 Leading Imports to South Dakota from Mexico (Surface 2010 2010 Leading Exports from South Dakota to Mexico (Surface 2010 Rank Import Rank Nuevo Leon Export 1 87 Vehicles Other than Railway $25,848,454 1 2 Meat and Edible Offal $35,989,616 2 84 Computer-Related Machinery and Parts $11,060,873 2 84 Computer-Related Machinery and Parts $3,829,079 3 48 Paper and Paperboard $4,791,617 3 48 Paper and Paperboard $1,777,111 4 94 Furniture; Lamps and Prefabricated Buildings $1,043,929 4 5 Products of Animal Origin $1,417,409 5 73 Articles of Iron and Steel $667,085 5 10 Cereals $1,092,991 6 5 Products of Animal Origin $365,289 6 15 Animal or Vegetable Fats and Oils $673,804 7 98 Special Classification Provisions $189,021 7 44 Wood and Articles $131,144 8 85 Electrical Machinery; Equipment and Parts $179,022 8 23 Food Residues and Waste $125,848 9 39 Plastics and Articles $80,430 9 95 Toys; Games and Sport Equipment $57,366 10 72 Iron and Steel $73,441 10 39 Plastics and Articles $47,769 2010 Leading Exports from South Dakota to Mexico (Surface 2010 Rank Tamaulipas Export 1 2 Meat and Edible Offal $1,258,724 2 23 Food Residues and Waste $384,283 3 5 Products of Animal Origin $223,191 4 41 Raw Hides and Skins $49,010 5 12 Oil Seeds and Oleaginous Fruits $13,677 6 87 Vehicles Other than Railway $4,850 7 8 9 10
  • 5. South Dakota Trading Relationships -- 2004 - 2010 Mexico Domestic Canada Rail Truck Change Change Rail Truck Domestic -- 2002- 2002- 2002 Domestic -- 2007 Change Change 2015 2015 2015 Exports Rail Truck Exports Rail Truck Exports Rail Truck Colorado 0 137 9% Colorado 3 249 8% 0% 82% Colorado 3 254 6% #DIV/0! 86% Montana 0 108 7% Montana 17 191 7% #DIV/0! 77% Montana 21 161 4% #DIV/0! 49% Nebraska 0 409 27% Nebraska 1 843 27% #DIV/0! 106% Nebraska 1 1,451 35% #DIV/0! 255% New Mexico 0 27 2% New Mexico 4 26 1% #DIV/0! -4% New Mexico 4 26 1% #DIV/0! -3% Oklahoma 0 55 4% Oklahoma 2 128 4% #DIV/0! 133% Oklahoma 2 1,083 26% #DIV/0! 1869% North Dakota 1 199 13% North Dakota 0 645 21% -100% 224% North Dakota - 135 3% -100% -32% South Dakota South Dakota South Dakota Texas 0 452 30% Texas 145 476 20% #DIV/0! 5% Texas 155 454 15% #DIV/0! 1% Wyoming 0 122 8% Wyoming 0 372 12% #DIV/0! 205% Wyoming - 382 9% #DIV/0! 213% Total ($m) 1 1,509 Total ($m) 173 2,930 100% 17187% 94% Total ($m) 186 3,946 100% 18473% 161% 1,510 3,103 105% 4,132 174% Imports Rail Truck Imports Rail Truck Imports Rail Truck Colorado 0 187 10% Colorado 227 7% #DIV/0! 21% Colorado - 261 4% #DIV/0! 39% Montana 40 146 10% Montana 4 114 4% -90% -22% Montana 2 164 3% -94% 12% Nebraska 0 720 40% Nebraska 1,783 54% #DIV/0! 148% Nebraska - 2,338 38% #DIV/0! 225% New Mexico 0 0 0% New Mexico 0% #DIV/0! #DIV/0! New Mexico - 2 0% #DIV/0! #DIV/0! North Dakota 0 513 28% North Dakota 745 22% #DIV/0! 45% Oklahoma 12 1,791 30% #DIV/0! 249% Oklahoma 0 26 1% Oklahoma 86 3% #DIV/0! 231% North Dakota - 104 2% #DIV/0! 299% South Dakota South Dakota South Dakota 0 Texas 0 106 6% Texas 0% #DIV/0! -100% Texas 116 970 18% #DIV/0! 815% Wyoming 0 64 4% Wyoming 22 335 11% #DIV/0! 423% Wyoming 26 297 5% #DIV/0! 364% Total ($m) 40 1,762 Total ($m) 26 3,290 100% -35% 87% Total ($m) 156 5,926 100% 291% 236% 1,802 3,316 84% 6,083 238% TOTAL Rail Truck TOTALS Rail Truck TOTALS Rail Truck Colorado 0 324 10% Colorado 3 476 7% #DIV/0! 47% Colorado 3 515 5% #DIV/0! 59% Montana 40 254 9% Montana 21 305 5% -48% 20% Montana 23 324 3% -42% 28% Nebraska 0 1,129 34% Nebraska 1 2,626 41% #DIV/0! 133% Nebraska 1 3,789 37% #DIV/0! 236% New Mexico 0 27 1% New Mexico 4 26 0% #DIV/0! -4% New Mexico 4 28 0% #DIV/0! 4% North Dakota 0 568 17% North Dakota 2 873 14% #DIV/0! 54% North Dakota 14 2,874 28% #DIV/0! 406% Oklahoma 1 225 7% Oklahoma 0 731 11% -100% 225% Oklahoma - 238 2% -100% 6% South Dakota South Dakota South Dakota 0 Texas 0 558 17% Texas 145 476 10% #DIV/0! -15% South Dakota 271 1,425 17% #DIV/0! 155% Wyoming 0 186 6% Wyoming 22 707 11% #DIV/0! 280% Texas 26 679 7% #DIV/0! 265% Total ($m) 41 3,271 Total ($m) 199 6,220 100% 385% 90% Total ($m) 342 9,872 100% #DIV/0! 202% 3,312 6,419 94% 10,214 208%
  • 6. South Dakota Trading Relationships -- 2004 - 2010 Mexico Domestic Canada 2009-2010 2009-2010 2004-2010 2004-2010 2004 2005 2006 2007 2008 2009 2010 Difference % Change Difference % Change Canada Truck Exports $223,756,926.00 $289,146,722 $362,179,714 $492,820,413 $458,625,817 $314,362,860 $365,384,613 $51,021,753 16.2% $141,627,687 63.3% Imports $285,791,567.00 $325,748,601 $335,625,432 $352,771,656 $326,494,603 $226,884,296 $257,678,166 $30,793,870 13.6% -$28,113,401 -9.8% Total Truck Trade with Canada $509,548,493.00 $614,895,323 $697,805,146 $845,592,069 $785,120,420 $541,247,156 $623,062,779 $81,815,623 15.1% $113,514,286 22.3% #DIV/0! Rail Exports $14,565,826.00 $18,090,204 $13,981,968 $13,037,193 $44,973,379 $47,262,688 $35,363,107 -$11,899,581 -25.2% $20,797,281 142.8% Imports $91,626,462.00 $107,475,220 $101,342,612 $88,754,772 $101,777,066 $72,433,998 $87,758,398 $15,324,400 21.2% -$3,868,064 -4.2% Total Rail Trade with Canada $106,192,288.00 $125,565,424 $115,324,580 $101,791,965 $146,750,445 $119,696,686 $123,121,505 $3,424,819 2.9% $16,929,217 15.9% #DIV/0! TOTAL Exports $238,322,752.00 $307,236,926 $376,161,682 $505,857,606 $503,599,196 $361,625,548 $400,747,720 $39,122,172 10.8% $162,424,968 68.2% Imports $377,418,029.00 $433,223,821 $436,968,044 $441,526,428 $428,271,669 $299,318,294 $345,436,564 $46,118,270 15.4% -$31,981,465 -8.5% Total Trade with Canada $615,740,781.00 $740,460,747 $813,129,726 $947,384,034 $931,870,865 $660,943,842 $746,184,284 $85,240,442 12.9% $130,443,503 21.2% Raymond, MT Truck Exports $917,406 $757,092 $2,671,443 $2,079,077 $4,567,837 $2,460,923 $2,945,323 $484,400 19.7% $2,027,917 221.0% % of Total Exports to Canada 0.4% 0.3% 0.7% 0.4% 1.0% 0.8% 0.8% 0.0% 0.4% Imports $2,364,561 $2,713,700 $3,037,268 $4,504,015 $5,029,431 $2,301,453 $2,428,305 $126,852 5.5% $63,744 2.7% % of Total Imports to Canada 0.8% 0.8% 0.9% 1.3% 1.5% 1.0% 0.9% -0.1% 0.1% Total Truck Trade Thru Raymond $3,281,967 $3,470,792 $5,708,711 $6,583,092 $9,597,268 $4,762,376 $5,373,628 $611,252 12.8% $2,091,661 63.7% % Total Trade with Canada 0.6% 0.6% 0.8% 0.8% 1.2% 0.9% 0.9% 0.0% 0.2% Rail Exports $0 $0 $0 #DIV/0! $0 #DIV/0! % of Total Exports to Canada 0.0% 0.0% 0.0% 0.0% 0.0% 0.0% 0.0% 0.0% 0.0% Imports $0 $0 $0 #DIV/0! $0 #DIV/0! % of Total Imports to Canada 0.0% 0.0% 0.0% 0.0% 0.0% 0.0% 0.0% 0.0% 0.0% Total Truck Trade Thru Raymond $0 $0 $0 $0 $0 $0 $0 #DIV/0! $0 #DIV/0! % Total Trade with Canada 0.0% 0.0% 0.0% 0.0% 0.0% 0.0% 0.0% 0.0% 0.0% TOTAL Exports $917,406 $757,092 $2,671,443 $2,079,077 $4,567,837 $2,460,923 $2,945,323 $484,400 19.7% $2,027,917 221.0% % of Total Exports to Canada 0.4% 0.2% 0.7% 0.4% 0.9% 0.7% 0.7% 0.1% 0.4% Imports $2,364,561 $2,713,700 $3,037,268 $4,504,015 $5,029,431 $2,301,453 $2,428,305 $126,852 5.5% $63,744 2.7% % of Total Imports to Canada 0.6% 0.6% 0.7% 1.0% 1.2% 0.8% 0.7% -0.1% 0.1% Total Trade Thru Raymond $3,281,967 $3,470,792 $5,708,711 $6,583,092 $9,597,268 $4,762,376 $5,373,628 $611,252 12.8% $2,091,661 63.7% % Total Trade with Canada 0.5% 0.5% 0.7% 0.7% 1.0% 0.7% 0.7% 0.0% 0.2%
  • 7. South Dakota Trading Relationships -- 2004 - 2010 Mexico Domestic Canada 2009-2010 2009-2010 2004-2010 2004-2010 2004 2005 2006 2007 2008 2009 2010 Difference % Change Difference % Change Sweet Grass, MT Truck Exports $26,178,994 $51,689,683 $56,045,215 $60,933,584 $67,825,266 $7,977,495 $10,002,061 $2,024,566 25.4% -$16,176,933 -61.8% % of Total Exports to Canada 11.7% 17.9% 15.5% 12.4% 14.8% 2.5% 2.7% 0.2% -9.0% Imports $17,294,411 $16,033,922 $11,695,223 $17,181,498 $26,079,519 $19,992,081 $23,570,227 $3,578,146 17.9% $6,275,816 36.3% % of Total Exports to Canada 6.1% 4.9% 3.5% 4.9% 8.0% 8.8% 9.1% 0.3% 3.1% Total Truck Trade Thru Sweet Grass 43,473,405 $67,723,605 $67,740,438 $78,115,082 $93,904,785 $27,969,576 $33,572,288 $5,602,712 20.0% -$9,901,117 -22.8% % Total Trade with Canada 8.5% 11.0% 9.7% 9.2% 12.0% 5.2% 5.4% 0.2% -3.1% Rail Exports $105,216 $0 $30,141 $22,255 $0 $67,159 $20,745 -$46,414 -69.1% -$84,471 -80.3% % of Total Exports to Canada 0.7% 0.0% 0.2% 0.2% 0.0% 0.1% 0.1% -0.1% -0.7% Imports $8,934,857 $9,552,766 $14,152,046 $14,561,532 $21,061,188 $8,053,836 $9,469,980 $1,416,144 17.6% $535,123 6.0% % of Total Exports to Canada 9.8% 8.9% 14.0% 16.4% 20.7% 11.1% 10.8% -0.3% 1.0% Total Rail Trade Thru Sweet Grass $9,040,073 $9,552,766 $14,182,187 $14,583,787 $21,061,188 $8,120,995 $9,490,725 $1,369,730 16.9% $450,652 5.0% % Total Trade with Canada 8.5% 7.6% 12.3% 14.3% 14.4% 6.8% 7.7% 0.9% -0.8% TOTAL Exports $26,284,210 $51,689,683 $56,075,356 $60,955,839 $67,825,266 $8,044,654 $10,022,806 $1,978,152 24.6% -$16,261,404 -61.9% % of Total Exports to Canada 11.0% 16.8% 14.9% 12.0% 13.5% 2.2% 2.5% 0.3% -8.5% Imports $26,229,268 $25,586,688 $25,847,269 $31,743,030 $47,140,707 $28,045,917 $33,040,207 $4,994,290 17.8% $6,810,939 26.0% % of Total Imports to Canada 6.9% 5.9% 5.9% 7.2% 11.0% 9.4% 9.6% 0.2% 2.6% Total Trade Thru Sweet Grass $52,513,478 $77,276,371 $81,922,625 $92,698,869 $114,965,973 $36,090,571 $43,063,013 $6,972,442 19.3% -$9,450,465 -18.0% % Total Trade with Canada 8.5% 10.4% 10.1% 9.8% 12.3% 5.5% 5.8% 0.3% -2.8% Portal, ND Truck Exports $17,603,171 $21,743,768 $32,937,774 $47,127,269 $57,402,547 $31,854,074 $50,923,036 $19,068,962 59.9% $33,319,865 189.3% % of Total Exports to Canada 7.9% 7.5% 9.1% 9.6% 12.5% 10.1% 13.9% 3.8% 6.1% Imports $28,285,335 $35,069,472 $37,339,843 $50,677,165 $48,134,984 $42,205,560 $48,687,792 $6,482,232 15.4% $20,402,457 72.1% % of Total Imports to Canada 12.6% 10.8% 0.0% 14.4% 14.7% 18.6% 18.9% 0.3% 6.3% Total Truck Trade Thru Portal $45,888,506 $56,813,240 $70,277,617 $97,804,434 $105,537,531 $74,059,634 $99,610,828 $25,551,194 34.5% $53,722,322 117.1% % Total Trade with Canada 9.0% 9.2% 10.1% 11.6% 13.4% 13.7% 16.0% 2.3% 7.0% Rail Exports $8,039,014 $13,692,901 $7,620,481 $6,675,889 $35,762,942 $23,146,695 $23,297,650 $15,677,169 0.7% $15,258,636 189.8% % of Total Exports to Canada 55.2% 75.7% 54.5% 51.2% 79.5% 49.0% 65.9% 16.9% 10.7% Imports $8,136,062 $18,407,215 $23,104,947 $12,963,837 $9,524,628 $17,161,200 $21,163,730 -$1,941,217 23.3% $13,027,668 160.1% % of Total Imports to Canada 8.9% 17.1% 22.8% 14.6% 9.4% 23.7% 24.1% 0.4% 15.2% Total Rail Trade Thru Portal $16,175,076 $32,100,116 $30,725,428 $19,639,726 $45,287,570 $40,307,895 $44,461,380 $13,735,952 10.3% $28,286,304 174.9% % Total Trade with Canada 15.2% 25.6% 26.6% 19.3% 30.9% 33.7% 36.1% 2.4% 20.9% TOTAL Exports $25,642,185 $35,436,669 $40,558,255 $53,803,158 $93,165,489 $55,000,769 $74,220,686 $19,219,917 34.9% $48,578,501 189.4% % of Total Exports to Canada 10.8% 11.5% 10.8% 10.6% 18.5% 15.2% 18.5% 3.3% 7.8% Imports $36,421,397 $53,476,687 $60,444,790 $63,641,002 $57,659,612 $59,366,760 $69,851,522 $10,484,762 17.7% $33,430,125 91.8% % of Total Imports to Canada 9.7% 12.3% 13.8% 14.4% 13.5% 19.8% 20.2% 0.4% 10.6% Total Trade Thru Portal $62,063,582 $88,913,356 $101,003,045 $117,444,160 $150,825,101 $114,367,529 $144,072,208 $29,704,679 26.0% $82,008,626 132.1% % Total Trade with Canada 10.1% 12.0% 12.4% 12.4% 16.2% 17.3% 19.3% 2.0% 9.2%
  • 8. South Dakota Trading Relationships -- 2004 - 2010 Mexico Domestic Canada 2009-2010 2009-2010 2004-2010 2004-2010 2004 2005 2006 2007 2008 2009 2010 Difference % Change Difference % Change Wild Horse 0 Truck Exports $0 $0 $0 $0 $0 $0 $0 $0 #DIV/0! $0 #DIV/0! % of Total Exports to Canada 0.0% 0.0% 0.0% 19.4% 0.0% 0.0% 0.0% 0.0% 0.0% Imports $0 $58,816 $68,260 $8,506 $229,654 $253,232 $246,317 -$6,915 -2.7% $246,317 #DIV/0! % of Total Imports to Canada 0.0% 0.0% 0.0% 19.0% 0.1% 0.1% 0.1% 0.0% 0.1% Total Truck Trade Thru GPITC $0 $58,816 $68,260 $8,506 $229,654 $253,232 $246,317 -$6,915 -2.7% $246,317 #DIV/0! % Total Trade with Canada 0.0% 0.0% 0.0% 19.3% 0.0% 0.0% 0.0% 0.0% 0.0% Rail Exports $0 $0 $0 $0 $0 $0 $0 $0 #DIV/0! $0 #DIV/0! % of Total Exports to Canada 0.0% 0.0% 0.0% 11.0% 0.0% 0.0% 0.0% 0.0% 0.0% Imports $0 $0 $0 $0 $0 $0 $0 $0 #DIV/0! $0 #DIV/0! % of Total Imports to Canada 0.0% 0.0% 0.0% 22.4% 0.0% 0.0% 0.0% 0.0% 0.0% Total Rail Trade Thru GPITC $0 $0 $0 $0 $0 $0 $0 $0 #DIV/0! $0 #DIV/0! % Total Trade with Canada 0.0% 0.0% 0.0% 17.7% 0.0% 0.0% 0.0% 0.0% 0.0% TOTAL Exports $0 $0 $0 $0 $0 $0 $0 $0 #DIV/0! $0 #DIV/0! % of Total Exports to Canada 0.0% 0.0% 0.0% 0.0% 0.0% 0.0% 0.0% 0.0% 0.0% Imports $0 $58,816 $68,260 $8,506 $229,654 $253,232 $246,317 -$6,915 -2.7% $246,317 #DIV/0! % of Total Imports to Canada 0.0% 0.0% 0.0% 0.0% 0.1% 0.1% 0.1% 0.0% 0.1% Total Trade Thru GPITC $0 $58,816 $68,260 $8,506 $229,654 $253,232 $246,317 -$6,915 -2.7% $246,317 #DIV/0! % Total Trade with Canada 0.0% 0.0% 0.0% 0.0% 0.0% 0.0% 0.0% 0.0% 0.0% GPITC #DIV/0! Truck Exports $44,699,571 $74,190,543 $91,654,432 $110,139,930 $129,795,650 $42,292,492 $63,870,420 $21,577,928 51.0% $19,170,849 42.9% % of Total Exports to Canada 20.0% 25.7% 25.3% 22.3% 28.3% 13.5% 17.5% 4.0% -2.5% Imports $46,497,152 $51,919,302 $51,774,769 $69,946,246 $79,011,994 $64,911,796 $75,449,659 $10,537,863 16.2% $28,952,507 62.3% % of Total Imports to Canada 16.3% 15.9% 15.4% 19.8% 24.2% 28.6% 29.3% 0.7% 13.0% Total Truck Trade Thru GPITC $91,196,723 $126,109,845 $143,429,201 $180,086,176 $208,807,644 $107,204,288 $139,320,079 $32,115,791 30.0% $48,123,356 52.8% % Total Trade with Canada 17.9% 20.5% 20.6% 21.3% 26.6% 19.8% 22.4% 2.6% 4.5% Rail Exports $8,144,230 $13,692,901 $7,650,622 $6,698,144 $35,762,942 $23,213,854 $23,318,395 $104,541 0.5% $15,174,165 186.3% % of Total Exports to Canada 3.6% 4.7% 2.1% 1.4% 7.8% 7.4% 6.4% -1.0% 2.7% Imports $17,070,919 $27,959,981 $37,256,993 $27,525,369 $30,585,816 $25,215,036 $30,633,710 $5,418,674 21.5% $13,562,791 79.4% % of Total Imports to Canada 6.0% 8.6% 11.1% 7.8% 9.4% 11.1% 11.9% 0.8% 5.9% Total Rail Trade Thru GPITC $25,215,149 $41,652,882 $44,907,615 $34,223,513 $66,348,758 $48,428,890 $53,952,105 $5,523,215 11.4% $28,736,956 114.0% % Total Trade with Canada 4.9% 6.8% 6.4% 4.0% 8.5% 8.9% 8.7% -0.3% 3.7% TOTAL Exports $52,843,801 $87,883,444 $99,305,054 $116,838,074 $165,558,592 $65,506,346 $87,188,815 $21,682,469 33.1% $34,345,014 65.0% % of Total Exports to Canada 22.2% 28.6% 26.4% 23.1% 32.9% 18.1% 21.8% 3.6% -0.4% Imports $63,568,071 $79,879,283 $89,031,762 $97,471,615 $109,597,810 $90,126,832 $106,083,369 $15,956,537 17.7% $42,515,298 66.9% % of Total Imports to Canada 16.8% 18.4% 20.4% 22.1% 25.6% 30.1% 30.7% 0.6% 13.9% Total Trade Thru GPITC $116,411,872 $167,762,727 $188,336,816 $214,309,689 $275,156,402 $155,633,178 $193,272,184 $37,639,006 24.2% $76,860,312 66.0% % Total Trade with Canada 18.9% 22.7% 23.2% 22.6% 29.5% 23.5% 25.9% 2.4% 7.0%
  • 9. South Dakota Trading Relationships -- 2004 - 2010 Mexico Domestic Canada 2010 Leading Exports from South Dakota to Canada (Surface 2010 2010 Leading Exports from South Dakota to Canada (Surface 2010 Transportation) Transportation) Rank Export Rank Alberta Export 1 84 Computer-Related Machinery and Parts $90,319,605 1 23 Food Residues and Waste $12,038,403 2 23 Food Residues and Waste $70,093,152 2 84 Computer-Related Machinery and Parts $3,832,379 3 87 Vehicles Other than Railway $61,333,456 3 76 Aluminum and Articles $885,698 4 2 Meat and Edible Offal $38,605,507 4 87 Vehicles Other than Railway $830,423 5 39 Plastics and Articles $24,257,888 5 73 Articles of Iron and Steel $632,444 6 44 Wood and Articles $11,433,175 6 10 Cereals $609,294 7 85 Electrical Machinery; Equipment and Parts $10,408,324 7 39 Plastics and Articles $478,019 8 71 Pearls; Stones; Metals and Imitation Jewelry $10,081,640 8 95 Toys; Games and Sport Equipment $378,996 9 94 Furniture; Lamps and Prefabricated Buildings $9,392,897 9 2 Meat and Edible Offal $292,640 10 73 Articles of Iron and Steel $8,077,124 10 85 Electrical Machinery; Equipment and Parts $288,814 2010 Leading Imports to South Dakota from Canada (Surface 2010 2010 Leading Exports from South Dakota to Canada (Surface 2010 Rank Import Rank British Colombia Export 1 31 Fertilizers $76,025,605 1 2 Meat and Edible Offal $9,658,491 2 84 Computer-Related Machinery and Parts $61,813,232 2 84 Computer-Related Machinery and Parts $8,122,993 3 39 Plastics and Articles $38,028,935 3 23 Food Residues and Waste $6,414,193 4 98 Special Classification Provisions $29,463,389 4 39 Plastics and Articles $3,630,654 5 87 Vehicles Other than Railway $21,119,254 5 22 Beverages; Spirits and Vinegar $2,489,091 6 44 Wood and Articles $20,428,467 6 87 Vehicles Other than Railway $1,069,989 7 48 Paper and Paperboard $17,730,294 7 85 Electrical Machinery; Equipment and Parts $982,782 8 1 Live Animals $15,580,842 8 73 Articles of Iron and Steel $410,799 9 2 Meat and Edible Offal $13,861,364 9 10 Cereals $365,687 10 73 Articles of Iron and Steel $8,352,502 10 15 Animal or Vegetable Fats and Oils $221,074 2010 Leading Exports from South Dakota to Canada (Surface 2010 Rank Saskatchewan Export 1 84 Computer-Related Machinery and Parts $17,131,385 2 87 Vehicles Other than Railway $11,841,893 3 72 Iron and Steel $6,105,101 4 73 Articles of Iron and Steel $5,217,106 5 23 Food Residues and Waste $4,571,039 6 94 Furniture; Lamps and Prefabricated Buildings $3,986,417 7 39 Plastics and Articles $2,859,930 8 27 Mineral Fuels; Oils and Waxes $2,563,249 9 76 Aluminum and Articles $2,194,936 10 90 Measuring and Testing Instruments $1,691,472