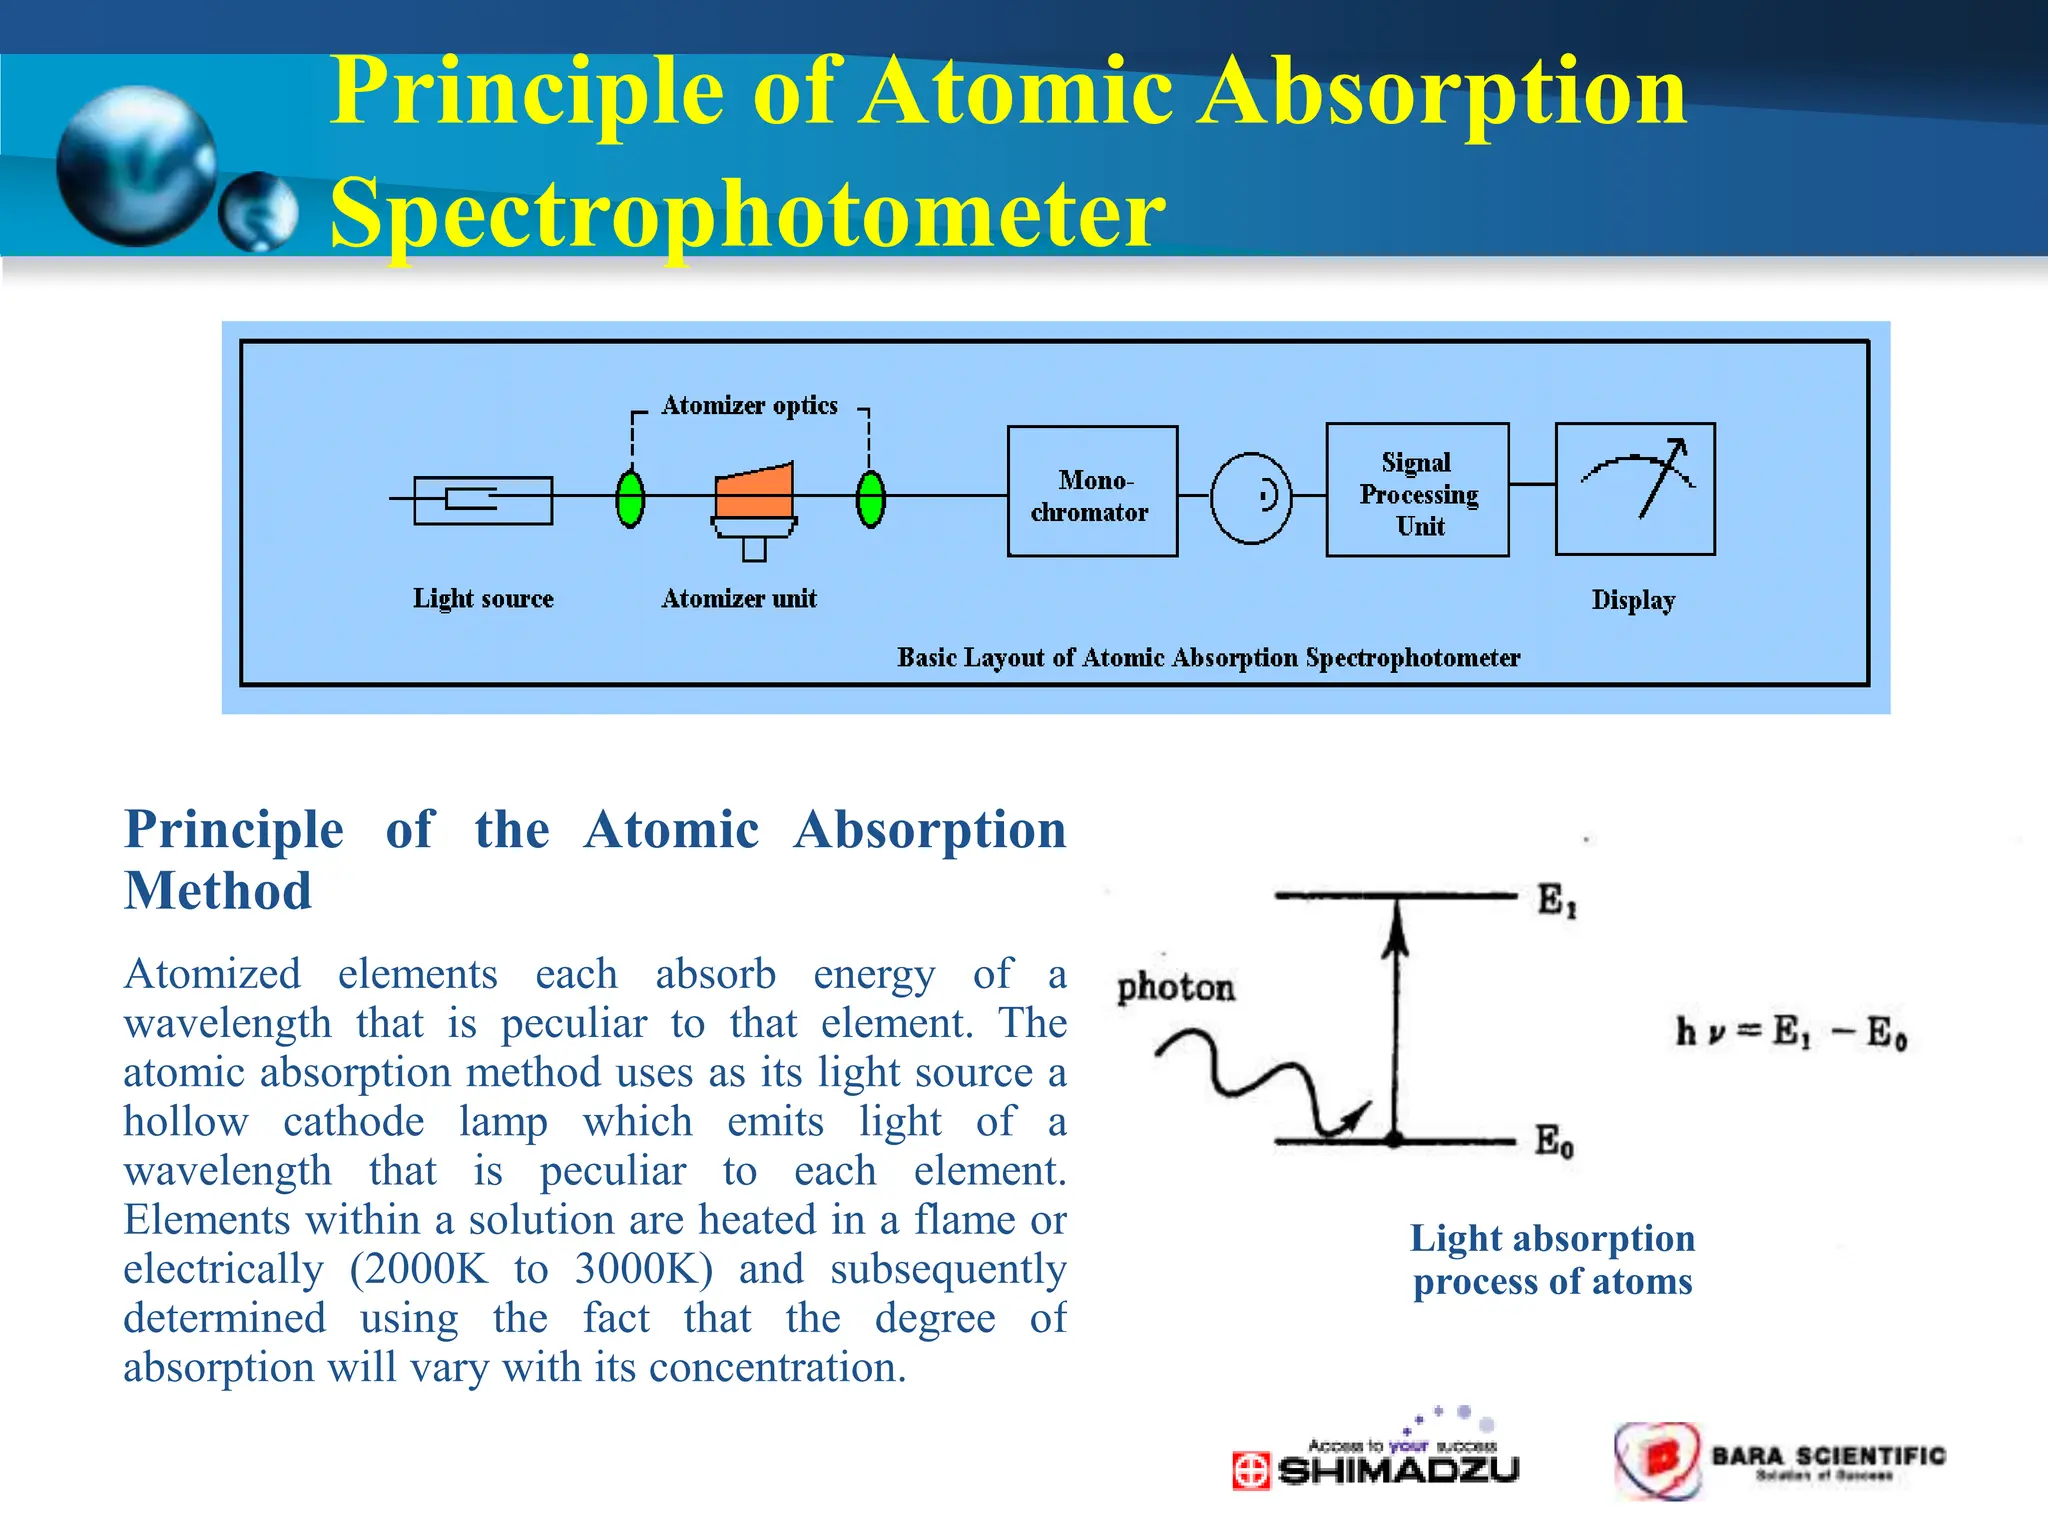
Principle
of
Atomic Absorption Spectrophotometry
Mr. Charnchai Suracheep
Introduction
Atomic Absorption Spectrophotometry,
which are standard instruments for
the determination of metal elements,
are widely applied of samples, such as
agriculture chemical, clinical and
biochemistry, minerals, food and
drugs, environmental and other.
Principle of Atomic Absorption
Spectrophotometer
Principle of the Atomic Absorption
Method
Atomized elements each absorb energy of a
wavelength that is peculiar to that element. The
atomic absorption method uses as its light source a
hollow cathode lamp which emits light of a
wavelength that is peculiar to each element.
Elements within a solution are heated in a flame or
electrically (2000K to 3000K) and subsequently
determined using the fact that the degree of
absorption will vary with its concentration.
Light absorption
process of atoms
Atomic Absorption Spectroscopy, AAS
Atomic Emission Spectroscopy, AES
Principle of Atomic Absorption
Spectrophotometer
Ground state E0
Excited state E1
e
Absorption
Ground state E0
Excited state E1
e
Emission
e
e
Sodium (Na) energy states
Ground state 0.0 eV
Excited state (I) 2.2 eV
Excited state (II) 3.6 eV
589.0 nm
330.3 nm
Electronic Transition
Relation between light absorption
and density
• When light of a certain intensity is given to
many atom in ground state, part of this light is
absorbed by atoms.
Density C
l
I0 I
Lambert-beer’s Law
Density C
l
I0 I
I = I0 e-k .l .C
Abs = -logI/I0 = k .l. C
k : proportional constant
l : path length
C : density (concentration)
Relation between light absorption
and density
Calibration curve
• Graph show the relation between absorbance and concentration
Absorbance
Concentration (ppm)
Absorbance of
unknown sample
Concentration of
unknown sample
Relation between light absorption
and density
Atomization method
• Atomic absorption spectrometry measures
absorption of free atom.
• “Free atom” means an atom not combined with
other atoms.
• Elements in the sample to be analyzed are not in
the free state, and are combined with other
elements invariably to make a so-called molecule.
• The combination must be cut off by some means to
free the atoms.
• This is called “atomization”
• 2 types:
- Flame method
- Flameless method
Atomization method
Flame Method
Flame Atomization Method
With the Flame Method, the sample
solution is converted into mist-form using a
nebulizer, and then introduced into the
flame. It is atomized by the temperature of
the flame.
Measurement time: A few dozen seconds
Optical diagram of Flame Atomic
Absorption Spectrometers
Flame selection
• These flames vary in temperature, reducibility and
transmission characteristics.
• Selected according to the element being analyzed,
and properties of the sample.
Flame Method
• Argon-hydrogen : Max. temp. 1,577 0C
• Air-hydrogen : Max. temp. 2,045 0C
• Air-acetylene : Max. temp. 2,300 0C
•Nitrous oxide-acetylene : Max. temp. 2,955 0C
(For elements are hard to combine with oxygen (Al, Si, V, Ti, etc.))
Flame selection
Flame Method
Flameless Method (Graphite Furnace)
シール
Graphite cap Graphite holder
Cooling block
Aperture
plate socket
Sample
inlet
Seal Graphite tube
Eject arm Spring Fixing knob
Graphite tube
• Sample is injected in the formed graphite tube.
• An electric current of 300 ampere (maximum) is
applied to the tube.
Flameless Method (Graphite Furnace)
• In an actual measurement heating is done in 3 stage.
- Ashing stage (400-1000oC)
- Atomizing stage (1400-3000oC)
- Drying stage (100oC)
Other atomic absorption methods
• Methods having higher sensitivity than
normal flame atomic absorption or electro-
thermal atomic absorption
• Used for special elements including arsenic,
selenium and mercury.
• Use chemical reactions in the process of
atomization to vaporize in the form of an
atom or simple molecule.
Structural Diagram of
Hydride Vapor Generator
Absorption
Cell
NaBH4
Gas
Liquid
Separato
r
Peristalt
ic Pump
Manifold
Reactio
n Coil
Sampl
e
Carrier Gas
Ar
HCl
Drain
Burner Head
of AAS
• As, Se, Sb, Sn, Te, Bi, Hg and other metals produce a metal hydride by this method
6BH4
-
+As3+
+ 3H+
3B2H6+3H2 +AsH3 (gas)
Hydride Vapor Generation
Technique
Elements Concentration (ppb)
As 5~20
Sb 5~20
Te 5~20
Bi 5~20
Se 10~40
Hg 20~80
Sn 30~90
Cold Vapor Technique
SnCl2 + Hg2+ Hgo
(gas)
reduce
5%KMnO4
5%H2SO4
SnCl2
 253.6 nm
Ho
Limit of Quantitative
Element Detection Limit
Flame (ppm) Furnace (ppb)
Ag 0.04 0.01
Al 0.5 0.03
As 0.02 ppb (HVG) 0.2
As 0.4 -
Cd 0.012 0.003
Cr 0.08 0.015
Cu 0.04 0.008
Hg 0.01 ppb (cold vapor) -
Hg 0.2 ppb (HVG) -
Mg 0.0035 0.003
Mn 0.025 0.01
Ni 0.08 0.13
Pb 0.2 0.06
Se 0.3 ppb (HVG) 0.2
Sn 2 N2O-C2H2 2
Zn 0.01 0.01
Interference effects
• Physical interference
• Spectral interference
• Chemical interference
Physical interference
• Flame
– Spray efficiency fluctuations due to difference in
viscosity and surface tension between the standard
and sample.
• Furnace
– Sample dispersion ;
Measurement value fluctuations due to tube temperature distribution
– Viscosity within the graphite furnace ;
Adherence to sample tip causing errors in collection quantity.
• Example: samples, such as blood or juice, containing numerous
organic components.
Spectral interference
• Spectral absorption line overlapping with the
absorption line of the target element.
• Absorption and scattering by molecules
Target element Spectral line
(nm)
Interfering
element
Spectral line
(nm)
Al  V 
Ca  Ge 
Cd  As 
Co  In 
Cu  Eu 
Fe  Pt 
Ga  Mn 
Hg  Co 
Mn  Ga 
Sb  Pb 
Si  V 
Zn  Fe 
Spectral interference
Spectral absorption line overlapping with the absorption
line of the target element.
Spectral interference
• Absorption and scattering by molecules
– Molecules absorption
• Alkaline metals + Halogens = Alkali halides
(Na, K)+(F, Cl, Br, I) = (Ex: NaCl, KI)
Chemical interference
• Generation of non-separable compounds by coexisting
matrices
–Example : influence of PO4
-, SO4
-, SiO2 relative to Ca, Mg
in flame analysis
• (generation of Ca2PO4)
• Generation of low boiling point compounds by
coexisting matrices
–Example: influence of chloride ions relative to Cd in
furnace analyses
• (generation of CdCl2)
Matrix modifier effect
• Masking of obstructing matrices
• Influence of phosphate on Ca is masked by La
• Conversion of obstructing matrices to compounds
that easily undergo sublimation or evaporation
– Sublimation agent
• Example: removal of chloride ion by ammonium salt of nitric
acid or phosphoric acid
• Conversion of measured elements to stable oxides
or metallic intermediary compounds
– Stabilizing agent:
• Example: creation of measured element alloy using white
metals (Pd, Pt, Rh)
Application
examples of the matrix modifier method
Standard Addition Method
Mg concentration
after filled up
X X+0.1 X+0.2 X+0.3
100 ml
Solvent
No.1 No.2 No.4
No.3
10 ml Unknown sample
10 ml 10 ml 10 ml 10 ml
1.0 ppm X Standard solution (ppm : mg/1000ml)
20 ml
30 ml
10 ml
Standard Addition Method
Calibration Curve of Standard Addition Method
Concentration of
unknown sample
2-Way Background Correction is
Standard
•D2 lamp method ( 190-430 nm) – Molecular absorption
Background Correction
•Self-Reversal (SR) method – Spectra interference
Elements/ wavelengths where spectral
interference becomes problematic
Target element Spectral line
(nm)
Interfering
element
Spectral line
(nm)
Al  V 
Ca  Ge 
Cd  As 
Co  In 
Cu  Eu 
Fe  Pt 
Ga  Mn 
Hg  Co 
Mn  Ga 
Sb  Pb 
Si  V 
Zn  Fe 
Spectral interference
Background Correction
Self-Reversal Method
Background Correction
Self-Reversal Method
10 mA
100 mA
Background Correction
Signal
Background
AA-6300
Atomic Absorption Spectrophotometer
Optical diagram of Double Beam System
High Performance Optical System
Easy Switching between Flame and Furnace
Flame -> Furnace: All that is involved is to remove the burner head,
place the furnace unit, and fix it with the screw. No tools are required.
Remove the burner head.
Fit the furnace.
Remove the furnace.
Fit the burner head.
New Flame Atomizer
For chemical resistance
• Neburizer w/ Ceramic
made Impact Bead
• Polypropylene-made
Chamber
• Solid Titanium-made
Burner Head
High Productivity
• Full Auto ASC
- Auto measurement up to 60 samples
- Reagent addition 8 position
- Automatic dilution
• Optimize Flame analysis
- Automatic search the best fuel gas flow rate
- Automatic search the Optimize Flame
analysis best burner height
Enhanced Safety
High Temp. Burner
• Auto Gas Leak Check
• Gas pressure monitoring to prevent flashback
• Automatic flame monitoring
• Automatic flame extinguish when
power failure
• Safety interlock for burner misuse
• Auto Air/N2O flame changeover
• Drain level sensor
Drain level sensor
Wizard Software System
* Select
elements
*Set the calibration curve
and samples condition
*Connect to PC
*Set the spectrophotometer
* Set the atomizer
Automated/ Optimized
Effectiveness of the automatic
Line Search/Beam Balance
Effectiveness of the automatic
burner height
(Cr : 4ppm standard solution used)
Automated/ Optimized
Burner height & Sensitivity (Cr)
Search for the optimal fuel flow rate
(Cu : 4ppm standard solution used)
Automated/ Optimized
Calibration
curve
Display of
saved signal
The 4 newest
signals
Signals in real-time
Screen during measurement
• The Login ID and password need to be entered when the software is started up.
• Records of who logged in at what time are preserved in the “Event Log”.
User Management
User Management
Authority can be set in detail for each user
Initial Validation Screen
Summary Validation Report
Application
of
Atomic Absorption Spectrophotometry
Application of AAS
Pretreatment (dissolution) is required for solid samples.
AAS
Precautions for pretreatment:
 Dissolve all the elements into the same solution evenly.
(Check with certified reference material.)
 Ensure that elements are not lost in the solution. i.e., due to vaporization
or sedimentation (Check with recovery test.)
 Contamination : Purified water, reagent (e.g., acid), container,
environment. (Check with blank operation.)
 Ensure that the solution to be analyzed is stable for a long time (i.e., no
hydrolysis or sedimentation).
 Consider the interference effect of the reagent on the analysis values.
Pretreatment
 Dilution
Dilute the sample with purified water, dilute acid, or organic solvents.
Examples: food products (e.g., dairy products), pharmaceuticals, and biological
samples (e.g., blood, urine).
Types of Pretreatment
 Dry Decomposition
Heat the sample to a high temperature (400 to 500C), Decomposition is possible in a
short time (a few hours) and operation is simple.
Elements with low boiling points (e.g., Hg, As, Se, Te, and Sb) will vaporize
 Wet Decomposition
Heat the sample together with acid to a low temperature (approx. 300C). Suitable for
volatile elements.
A long time is required for the decomposition of organic substances.
 Microwave Decomposition
Decompose the sample at high pressure by heating it together with acid to a
temperature in the range 100 to 200C in a sealed Teflon container.
The decomposition process is sealed; there is little vaporization of elements with low
boiling points; the decomposition time is short; there is little contamination from the
operating environment and the reagent; and only a small amount of acid is required.
Examples: Sediment, soil, dust, ceramics, living organisms, food products, etc.
Wet Decomposition Method
Sample+
Sulfuric acid
Nitric
acid
Heating
Cooling
tube
Waste
gas
Simple method
(no cooling)
Kjeldahl flask wet decomposition method
 Decompose the sample together with an acid in a sealed container.
 Decomposition possible in a short time with little vaporization or contamination.
- Ideal for the pretreatment of trace elements and trace samples.
- Food products, living organisms, pharmaceuticals, airborne dust, soil, etc.
Pretreatment
Microwave Decomposition
High-pressure Decomposition Container
Microwave Digestion
Temperature
measurement
internal PC or
Controller
Control by
Tmax and Pmax
Microwave
power
Digestion Vessels 1 - 12
Pressure
measurement
Real-Time Display
Sample Preparation using Pressure Digestion
with Microwave heating
Pretreatment
Solubility of Elements in Samples
Total Content
Inorganic compounds
with low solubility
Sulfides, oxides,
silicates, etc.
Simple soluble metals
& compounds
Carbonates, oxides, etc.
Organic
compounds
Simple
water-soluble
ions
Pretreatment Methods
Dilution, Elution
Purified water,
solvents, etc.
Wet Decomposition
Hydrochloric acid,
nitric acid, etc.
Dry/Wet Decomposition
Microwave Decomposition
Nitric acid,
sulfuric acid, etc.
Wet/High-pressure
Decomposition
Hydrofluoric acid, nitric
acid, etc.
Example
Application of AAS
EU Regulation for Hazardous Substances
IEC Recommendation for RoHS
RoHS : Restriction of Hazardous Substance in Electrical and Electronic equipment.
Substances Polymers Metals Electronics
PBB/PBDE :
1000 ppm
GC-MS NA GC-MS
Cr6+ : 1000 ppm Colorimetric Method
(Spectrophotometer)
Spot-test
procedure/boiling=water-
Extraction procedure
(Clause8)
Colorimetric Method
(Spectrophotometer)
Hg : 1000 ppm Cold Vapor-AAS, ICP
Pb : 1000 ppm
Cd : 100 ppm
AAS, ICP AAS, ICP AAS, ICP
EU Regulation for Hazardous Substances
Preparation of circuit boards
Vibratory Disc Mill RS 100
Pre-Cutting with the
Heavy Duty Cutting Mill
, bottom sieve 6 mm
Heavy Duty Cutting Mill SM 2000
after a grinding time of 2 min.
endfineness 90 % < 125 µm
Sample Preparation
Targe
t
Elem
ent
Pretreatment Methods
Polymer Metals Electronics
Hg Microwave digestion (HNO3+ HBF4+ H2
O2)
Cd
Pb
Microwave
digestion
(HNO3+H2O2)
(If contain ing Si,
Ti add HF)
a) Common method
(HCl : HNO3 : water ; 2 :
1 : 2) b) If
containing Zr, Hf, Ti,
Ta, Nb, W (HNO3 :
HF ; 1 : 3)
c) If containing Sn
(HCl :HNO3 ; 3 : 1)
Microwave
digestion Step A
(HNO3+HBF4+H2
O2)
Microwave
digestion Step B
(add HCl)
Pretreatment method, which follow by IEC 62321
Analyzing Cadmium (Cd) in Rice
Pretreatment Using Wet Decomposition
Put 5 g of the sample in a beaker.
Add 30 mL of nitric acid (1+1) and 0.5 mL of sulfuric acid.
Warm on a hot plate until the violent reaction subsides.
↓
Perform thermal decomposition until the contents approach a hardened and
dried state.
When the contents turn dark brown, add 1 mL of nitric acid. Repeat this process.
When the contents turn light yellow or become transparent, expel the white smoke of
the sulfuric acid and leave to cool.
Add nitric acid.
Heat on the hot plate to dissolve the salt content.
Leave to cool.
Dilute for measurement.
Level suggested by FAO/WHO Codex Committee ; 0.2 ppm max. in polished rice (proposed)
Polished rice:
0.118 ppm
Unpolished rice:
0.070 ppm
0.1 ppm
Furnace method
Injected amount: 10 µL
Interference inhibitor: Pd 50ppm 5 µL
Ashing: 400C; Atomization: 1,800C
Results of Quantitative
Analysis of Cd in Rice
Flame method
Air-C2H2
0.5 ppm
Polished rice :
0.118 ppm
Unpolished rice :
0.073 ppm
The following 2 methods can be used to analyze unpolished and polished rice decomposed using acid:
Summary of Methods for
Analyzing Cd in Rice
Comparison of Pretreatment Methods
Wet oxidation: 3 to 5 hours; Dry ashing: 5 to 10 hours;
Microwave: 1 hour; Acid extraction: 2 hours
Expected Lower Limits for Quantitative Measurement
Flame method : 0.100 ppm
Furnace method : 0.001 ppm
Comparison of Measurement Times for Each Measurement
Method (n=3)
Flame method : 30 s
Furnace method : 360 s
of
Atomic Absorption Spectrophotometry
Preventive Maintenance / Calibration
Maintenance
1. Cleaning the Burner head
Preventive Maintenance/Calibration
Weekly check
Clogged
(by carbide or salt etc.)
Normal
Maintenance
2. Cleaning the Chamber with diluted water or alcohol
Weekly check
Preventive Maintenance/Calibration
Burner Head
O-ring Chamber
Disperser
O-ring Fixing Plate
Nebulizer
Drain
Sample Suction
Nebulizer Construction
Sample Solution
Air
Maintenance
3. Cleaning the Nebulizer
Weekly check
Preventive Maintenance/Calibration
Nebulizer
Cleaning wire
Do not apply the ultrasonic cleaner to the nebulizer
Hardware Validation
1. Wavelength Accuracy
- Using Hg hollow cathode lamp set at Emission mode
- Measure peaks should be within + 0.7 nm
(253.6nm 365.0nm 435.8nm 546..1nm 585.2 640.2nm)
(12 Month)
Calibration
Preventive Maintenance/Calibration
3. Baseline Drift
- Using Cu hollow cathode lamp ( 324.8 nm)
- Measuring time 1800 sec
- Measured value less than 0.006 Abs
2. Noise Level
- Using Se hollow cathode lamp ( 196 nm)
- NON-BGC Noise level should be < 0.015 Abs.
- BGC-D2 Noise level should be < 0.035 Abs.
5. Repeatability
- Using Cu hollow cathode lamp
- Standard Cu 2 ppm
- Measure 5 time and CV value < 2%
(12 Month)
Calibration
Preventive Maintenance/Calibration
4. Absorption
- Using Cu hollow cathode lamp
- Standard Cu 2 ppm
- Measured value more than 0.23 Abs
(12 Month)
Calibration
Preventive Maintenance/Calibration
6. Detection Limit
- Using Cu hollow cathode lamp
- Standard Cu 2 ppm
- Measure Standard is 3-5 time and calculate the mean value (A)
- Measure Blank solution is 3-5 time and calculate the standard
deviation (S)
- Take the obtained value as the detection limit < 0.004 Abs.
Detection limit = (2.0 x 3 x S) / A
(12 Month)
Calibration
Preventive Maintenance/Calibration
7. Stability
- Using Se and Cu hollow cathode lamp
- Standard Cu 2 ppm
- Measure std. Cu around 5 sec (B)
- Measure std. Cu continuous around 30 sec and measure
amplitude of Abs. value (W)
- Take the ratio of W to B
Stability = W/B < 6.0 %
Preventive Maintenance/Calibration
Principal of AAS.ppt

Principal of AAS.ppt

  • 1.
  • 2.
    Introduction Atomic Absorption Spectrophotometry, whichare standard instruments for the determination of metal elements, are widely applied of samples, such as agriculture chemical, clinical and biochemistry, minerals, food and drugs, environmental and other.
  • 3.
    Principle of AtomicAbsorption Spectrophotometer Principle of the Atomic Absorption Method Atomized elements each absorb energy of a wavelength that is peculiar to that element. The atomic absorption method uses as its light source a hollow cathode lamp which emits light of a wavelength that is peculiar to each element. Elements within a solution are heated in a flame or electrically (2000K to 3000K) and subsequently determined using the fact that the degree of absorption will vary with its concentration. Light absorption process of atoms
  • 4.
    Atomic Absorption Spectroscopy,AAS Atomic Emission Spectroscopy, AES Principle of Atomic Absorption Spectrophotometer Ground state E0 Excited state E1 e Absorption Ground state E0 Excited state E1 e Emission e e
  • 5.
    Sodium (Na) energystates Ground state 0.0 eV Excited state (I) 2.2 eV Excited state (II) 3.6 eV 589.0 nm 330.3 nm Electronic Transition
  • 6.
    Relation between lightabsorption and density • When light of a certain intensity is given to many atom in ground state, part of this light is absorbed by atoms. Density C l I0 I
  • 7.
    Lambert-beer’s Law Density C l I0I I = I0 e-k .l .C Abs = -logI/I0 = k .l. C k : proportional constant l : path length C : density (concentration) Relation between light absorption and density
  • 8.
    Calibration curve • Graphshow the relation between absorbance and concentration Absorbance Concentration (ppm) Absorbance of unknown sample Concentration of unknown sample Relation between light absorption and density
  • 9.
    Atomization method • Atomicabsorption spectrometry measures absorption of free atom. • “Free atom” means an atom not combined with other atoms. • Elements in the sample to be analyzed are not in the free state, and are combined with other elements invariably to make a so-called molecule.
  • 10.
    • The combinationmust be cut off by some means to free the atoms. • This is called “atomization” • 2 types: - Flame method - Flameless method Atomization method
  • 11.
    Flame Method Flame AtomizationMethod With the Flame Method, the sample solution is converted into mist-form using a nebulizer, and then introduced into the flame. It is atomized by the temperature of the flame. Measurement time: A few dozen seconds
  • 12.
    Optical diagram ofFlame Atomic Absorption Spectrometers
  • 13.
    Flame selection • Theseflames vary in temperature, reducibility and transmission characteristics. • Selected according to the element being analyzed, and properties of the sample. Flame Method • Argon-hydrogen : Max. temp. 1,577 0C • Air-hydrogen : Max. temp. 2,045 0C • Air-acetylene : Max. temp. 2,300 0C •Nitrous oxide-acetylene : Max. temp. 2,955 0C (For elements are hard to combine with oxygen (Al, Si, V, Ti, etc.))
  • 14.
  • 15.
    Flameless Method (GraphiteFurnace) シール Graphite cap Graphite holder Cooling block Aperture plate socket Sample inlet Seal Graphite tube Eject arm Spring Fixing knob Graphite tube
  • 16.
    • Sample isinjected in the formed graphite tube. • An electric current of 300 ampere (maximum) is applied to the tube. Flameless Method (Graphite Furnace)
  • 17.
    Flameless Method (GraphiteFurnace) • In an actual measurement heating is done in 3 stage. - Ashing stage (400-1000oC) - Atomizing stage (1400-3000oC) - Drying stage (100oC)
  • 18.
    Other atomic absorptionmethods • Methods having higher sensitivity than normal flame atomic absorption or electro- thermal atomic absorption • Used for special elements including arsenic, selenium and mercury. • Use chemical reactions in the process of atomization to vaporize in the form of an atom or simple molecule.
  • 19.
    Structural Diagram of HydrideVapor Generator Absorption Cell NaBH4 Gas Liquid Separato r Peristalt ic Pump Manifold Reactio n Coil Sampl e Carrier Gas Ar HCl Drain Burner Head of AAS • As, Se, Sb, Sn, Te, Bi, Hg and other metals produce a metal hydride by this method 6BH4 - +As3+ + 3H+ 3B2H6+3H2 +AsH3 (gas) Hydride Vapor Generation Technique Elements Concentration (ppb) As 5~20 Sb 5~20 Te 5~20 Bi 5~20 Se 10~40 Hg 20~80 Sn 30~90
  • 20.
    Cold Vapor Technique SnCl2+ Hg2+ Hgo (gas) reduce 5%KMnO4 5%H2SO4 SnCl2  253.6 nm Ho
  • 21.
    Limit of Quantitative ElementDetection Limit Flame (ppm) Furnace (ppb) Ag 0.04 0.01 Al 0.5 0.03 As 0.02 ppb (HVG) 0.2 As 0.4 - Cd 0.012 0.003 Cr 0.08 0.015 Cu 0.04 0.008 Hg 0.01 ppb (cold vapor) - Hg 0.2 ppb (HVG) - Mg 0.0035 0.003 Mn 0.025 0.01 Ni 0.08 0.13 Pb 0.2 0.06 Se 0.3 ppb (HVG) 0.2 Sn 2 N2O-C2H2 2 Zn 0.01 0.01
  • 22.
    Interference effects • Physicalinterference • Spectral interference • Chemical interference
  • 23.
    Physical interference • Flame –Spray efficiency fluctuations due to difference in viscosity and surface tension between the standard and sample. • Furnace – Sample dispersion ; Measurement value fluctuations due to tube temperature distribution – Viscosity within the graphite furnace ; Adherence to sample tip causing errors in collection quantity. • Example: samples, such as blood or juice, containing numerous organic components.
  • 24.
    Spectral interference • Spectralabsorption line overlapping with the absorption line of the target element. • Absorption and scattering by molecules
  • 25.
    Target element Spectralline (nm) Interfering element Spectral line (nm) Al  V  Ca  Ge  Cd  As  Co  In  Cu  Eu  Fe  Pt  Ga  Mn  Hg  Co  Mn  Ga  Sb  Pb  Si  V  Zn  Fe  Spectral interference Spectral absorption line overlapping with the absorption line of the target element.
  • 26.
    Spectral interference • Absorptionand scattering by molecules – Molecules absorption • Alkaline metals + Halogens = Alkali halides (Na, K)+(F, Cl, Br, I) = (Ex: NaCl, KI)
  • 27.
    Chemical interference • Generationof non-separable compounds by coexisting matrices –Example : influence of PO4 -, SO4 -, SiO2 relative to Ca, Mg in flame analysis • (generation of Ca2PO4) • Generation of low boiling point compounds by coexisting matrices –Example: influence of chloride ions relative to Cd in furnace analyses • (generation of CdCl2)
  • 28.
    Matrix modifier effect •Masking of obstructing matrices • Influence of phosphate on Ca is masked by La • Conversion of obstructing matrices to compounds that easily undergo sublimation or evaporation – Sublimation agent • Example: removal of chloride ion by ammonium salt of nitric acid or phosphoric acid • Conversion of measured elements to stable oxides or metallic intermediary compounds – Stabilizing agent: • Example: creation of measured element alloy using white metals (Pd, Pt, Rh)
  • 29.
    Application examples of thematrix modifier method
  • 30.
    Standard Addition Method Mgconcentration after filled up X X+0.1 X+0.2 X+0.3 100 ml Solvent No.1 No.2 No.4 No.3 10 ml Unknown sample 10 ml 10 ml 10 ml 10 ml 1.0 ppm X Standard solution (ppm : mg/1000ml) 20 ml 30 ml 10 ml
  • 31.
    Standard Addition Method CalibrationCurve of Standard Addition Method Concentration of unknown sample
  • 32.
    2-Way Background Correctionis Standard •D2 lamp method ( 190-430 nm) – Molecular absorption Background Correction •Self-Reversal (SR) method – Spectra interference
  • 33.
    Elements/ wavelengths wherespectral interference becomes problematic Target element Spectral line (nm) Interfering element Spectral line (nm) Al  V  Ca  Ge  Cd  As  Co  In  Cu  Eu  Fe  Pt  Ga  Mn  Hg  Co  Mn  Ga  Sb  Pb  Si  V  Zn  Fe  Spectral interference Background Correction
  • 34.
  • 35.
    Self-Reversal Method 10 mA 100mA Background Correction Signal Background
  • 36.
  • 37.
    Optical diagram ofDouble Beam System High Performance Optical System
  • 38.
    Easy Switching betweenFlame and Furnace Flame -> Furnace: All that is involved is to remove the burner head, place the furnace unit, and fix it with the screw. No tools are required. Remove the burner head. Fit the furnace. Remove the furnace. Fit the burner head.
  • 39.
    New Flame Atomizer Forchemical resistance • Neburizer w/ Ceramic made Impact Bead • Polypropylene-made Chamber • Solid Titanium-made Burner Head
  • 40.
    High Productivity • FullAuto ASC - Auto measurement up to 60 samples - Reagent addition 8 position - Automatic dilution • Optimize Flame analysis - Automatic search the best fuel gas flow rate - Automatic search the Optimize Flame analysis best burner height
  • 41.
    Enhanced Safety High Temp.Burner • Auto Gas Leak Check • Gas pressure monitoring to prevent flashback • Automatic flame monitoring • Automatic flame extinguish when power failure • Safety interlock for burner misuse • Auto Air/N2O flame changeover • Drain level sensor Drain level sensor
  • 42.
    Wizard Software System *Select elements *Set the calibration curve and samples condition *Connect to PC *Set the spectrophotometer * Set the atomizer
  • 43.
    Automated/ Optimized Effectiveness ofthe automatic Line Search/Beam Balance
  • 44.
    Effectiveness of theautomatic burner height (Cr : 4ppm standard solution used) Automated/ Optimized Burner height & Sensitivity (Cr)
  • 45.
    Search for theoptimal fuel flow rate (Cu : 4ppm standard solution used) Automated/ Optimized
  • 46.
    Calibration curve Display of saved signal The4 newest signals Signals in real-time Screen during measurement
  • 47.
    • The LoginID and password need to be entered when the software is started up. • Records of who logged in at what time are preserved in the “Event Log”. User Management
  • 48.
    User Management Authority canbe set in detail for each user
  • 49.
  • 50.
  • 51.
  • 52.
    Application of AAS Pretreatment(dissolution) is required for solid samples. AAS
  • 53.
    Precautions for pretreatment: Dissolve all the elements into the same solution evenly. (Check with certified reference material.)  Ensure that elements are not lost in the solution. i.e., due to vaporization or sedimentation (Check with recovery test.)  Contamination : Purified water, reagent (e.g., acid), container, environment. (Check with blank operation.)  Ensure that the solution to be analyzed is stable for a long time (i.e., no hydrolysis or sedimentation).  Consider the interference effect of the reagent on the analysis values. Pretreatment
  • 54.
     Dilution Dilute thesample with purified water, dilute acid, or organic solvents. Examples: food products (e.g., dairy products), pharmaceuticals, and biological samples (e.g., blood, urine). Types of Pretreatment  Dry Decomposition Heat the sample to a high temperature (400 to 500C), Decomposition is possible in a short time (a few hours) and operation is simple. Elements with low boiling points (e.g., Hg, As, Se, Te, and Sb) will vaporize  Wet Decomposition Heat the sample together with acid to a low temperature (approx. 300C). Suitable for volatile elements. A long time is required for the decomposition of organic substances.  Microwave Decomposition Decompose the sample at high pressure by heating it together with acid to a temperature in the range 100 to 200C in a sealed Teflon container. The decomposition process is sealed; there is little vaporization of elements with low boiling points; the decomposition time is short; there is little contamination from the operating environment and the reagent; and only a small amount of acid is required. Examples: Sediment, soil, dust, ceramics, living organisms, food products, etc.
  • 55.
    Wet Decomposition Method Sample+ Sulfuricacid Nitric acid Heating Cooling tube Waste gas Simple method (no cooling) Kjeldahl flask wet decomposition method
  • 56.
     Decompose thesample together with an acid in a sealed container.  Decomposition possible in a short time with little vaporization or contamination. - Ideal for the pretreatment of trace elements and trace samples. - Food products, living organisms, pharmaceuticals, airborne dust, soil, etc. Pretreatment Microwave Decomposition High-pressure Decomposition Container Microwave Digestion
  • 57.
    Temperature measurement internal PC or Controller Controlby Tmax and Pmax Microwave power Digestion Vessels 1 - 12 Pressure measurement Real-Time Display Sample Preparation using Pressure Digestion with Microwave heating
  • 58.
    Pretreatment Solubility of Elementsin Samples Total Content Inorganic compounds with low solubility Sulfides, oxides, silicates, etc. Simple soluble metals & compounds Carbonates, oxides, etc. Organic compounds Simple water-soluble ions Pretreatment Methods Dilution, Elution Purified water, solvents, etc. Wet Decomposition Hydrochloric acid, nitric acid, etc. Dry/Wet Decomposition Microwave Decomposition Nitric acid, sulfuric acid, etc. Wet/High-pressure Decomposition Hydrofluoric acid, nitric acid, etc.
  • 59.
  • 60.
    EU Regulation forHazardous Substances
  • 61.
    IEC Recommendation forRoHS RoHS : Restriction of Hazardous Substance in Electrical and Electronic equipment. Substances Polymers Metals Electronics PBB/PBDE : 1000 ppm GC-MS NA GC-MS Cr6+ : 1000 ppm Colorimetric Method (Spectrophotometer) Spot-test procedure/boiling=water- Extraction procedure (Clause8) Colorimetric Method (Spectrophotometer) Hg : 1000 ppm Cold Vapor-AAS, ICP Pb : 1000 ppm Cd : 100 ppm AAS, ICP AAS, ICP AAS, ICP EU Regulation for Hazardous Substances
  • 62.
    Preparation of circuitboards Vibratory Disc Mill RS 100 Pre-Cutting with the Heavy Duty Cutting Mill , bottom sieve 6 mm Heavy Duty Cutting Mill SM 2000 after a grinding time of 2 min. endfineness 90 % < 125 µm
  • 63.
    Sample Preparation Targe t Elem ent Pretreatment Methods PolymerMetals Electronics Hg Microwave digestion (HNO3+ HBF4+ H2 O2) Cd Pb Microwave digestion (HNO3+H2O2) (If contain ing Si, Ti add HF) a) Common method (HCl : HNO3 : water ; 2 : 1 : 2) b) If containing Zr, Hf, Ti, Ta, Nb, W (HNO3 : HF ; 1 : 3) c) If containing Sn (HCl :HNO3 ; 3 : 1) Microwave digestion Step A (HNO3+HBF4+H2 O2) Microwave digestion Step B (add HCl) Pretreatment method, which follow by IEC 62321
  • 64.
    Analyzing Cadmium (Cd)in Rice Pretreatment Using Wet Decomposition Put 5 g of the sample in a beaker. Add 30 mL of nitric acid (1+1) and 0.5 mL of sulfuric acid. Warm on a hot plate until the violent reaction subsides. ↓ Perform thermal decomposition until the contents approach a hardened and dried state. When the contents turn dark brown, add 1 mL of nitric acid. Repeat this process. When the contents turn light yellow or become transparent, expel the white smoke of the sulfuric acid and leave to cool. Add nitric acid. Heat on the hot plate to dissolve the salt content. Leave to cool. Dilute for measurement. Level suggested by FAO/WHO Codex Committee ; 0.2 ppm max. in polished rice (proposed)
  • 65.
    Polished rice: 0.118 ppm Unpolishedrice: 0.070 ppm 0.1 ppm Furnace method Injected amount: 10 µL Interference inhibitor: Pd 50ppm 5 µL Ashing: 400C; Atomization: 1,800C Results of Quantitative Analysis of Cd in Rice Flame method Air-C2H2 0.5 ppm Polished rice : 0.118 ppm Unpolished rice : 0.073 ppm The following 2 methods can be used to analyze unpolished and polished rice decomposed using acid:
  • 66.
    Summary of Methodsfor Analyzing Cd in Rice Comparison of Pretreatment Methods Wet oxidation: 3 to 5 hours; Dry ashing: 5 to 10 hours; Microwave: 1 hour; Acid extraction: 2 hours Expected Lower Limits for Quantitative Measurement Flame method : 0.100 ppm Furnace method : 0.001 ppm Comparison of Measurement Times for Each Measurement Method (n=3) Flame method : 30 s Furnace method : 360 s
  • 67.
  • 68.
    Maintenance 1. Cleaning theBurner head Preventive Maintenance/Calibration Weekly check Clogged (by carbide or salt etc.) Normal
  • 69.
    Maintenance 2. Cleaning theChamber with diluted water or alcohol Weekly check Preventive Maintenance/Calibration Burner Head O-ring Chamber Disperser O-ring Fixing Plate Nebulizer Drain Sample Suction Nebulizer Construction Sample Solution Air
  • 70.
    Maintenance 3. Cleaning theNebulizer Weekly check Preventive Maintenance/Calibration Nebulizer Cleaning wire Do not apply the ultrasonic cleaner to the nebulizer
  • 71.
  • 72.
    1. Wavelength Accuracy -Using Hg hollow cathode lamp set at Emission mode - Measure peaks should be within + 0.7 nm (253.6nm 365.0nm 435.8nm 546..1nm 585.2 640.2nm) (12 Month) Calibration Preventive Maintenance/Calibration 3. Baseline Drift - Using Cu hollow cathode lamp ( 324.8 nm) - Measuring time 1800 sec - Measured value less than 0.006 Abs 2. Noise Level - Using Se hollow cathode lamp ( 196 nm) - NON-BGC Noise level should be < 0.015 Abs. - BGC-D2 Noise level should be < 0.035 Abs.
  • 73.
    5. Repeatability - UsingCu hollow cathode lamp - Standard Cu 2 ppm - Measure 5 time and CV value < 2% (12 Month) Calibration Preventive Maintenance/Calibration 4. Absorption - Using Cu hollow cathode lamp - Standard Cu 2 ppm - Measured value more than 0.23 Abs
  • 74.
    (12 Month) Calibration Preventive Maintenance/Calibration 6.Detection Limit - Using Cu hollow cathode lamp - Standard Cu 2 ppm - Measure Standard is 3-5 time and calculate the mean value (A) - Measure Blank solution is 3-5 time and calculate the standard deviation (S) - Take the obtained value as the detection limit < 0.004 Abs. Detection limit = (2.0 x 3 x S) / A
  • 75.
    (12 Month) Calibration Preventive Maintenance/Calibration 7.Stability - Using Se and Cu hollow cathode lamp - Standard Cu 2 ppm - Measure std. Cu around 5 sec (B) - Measure std. Cu continuous around 30 sec and measure amplitude of Abs. value (W) - Take the ratio of W to B Stability = W/B < 6.0 %
  • 76.