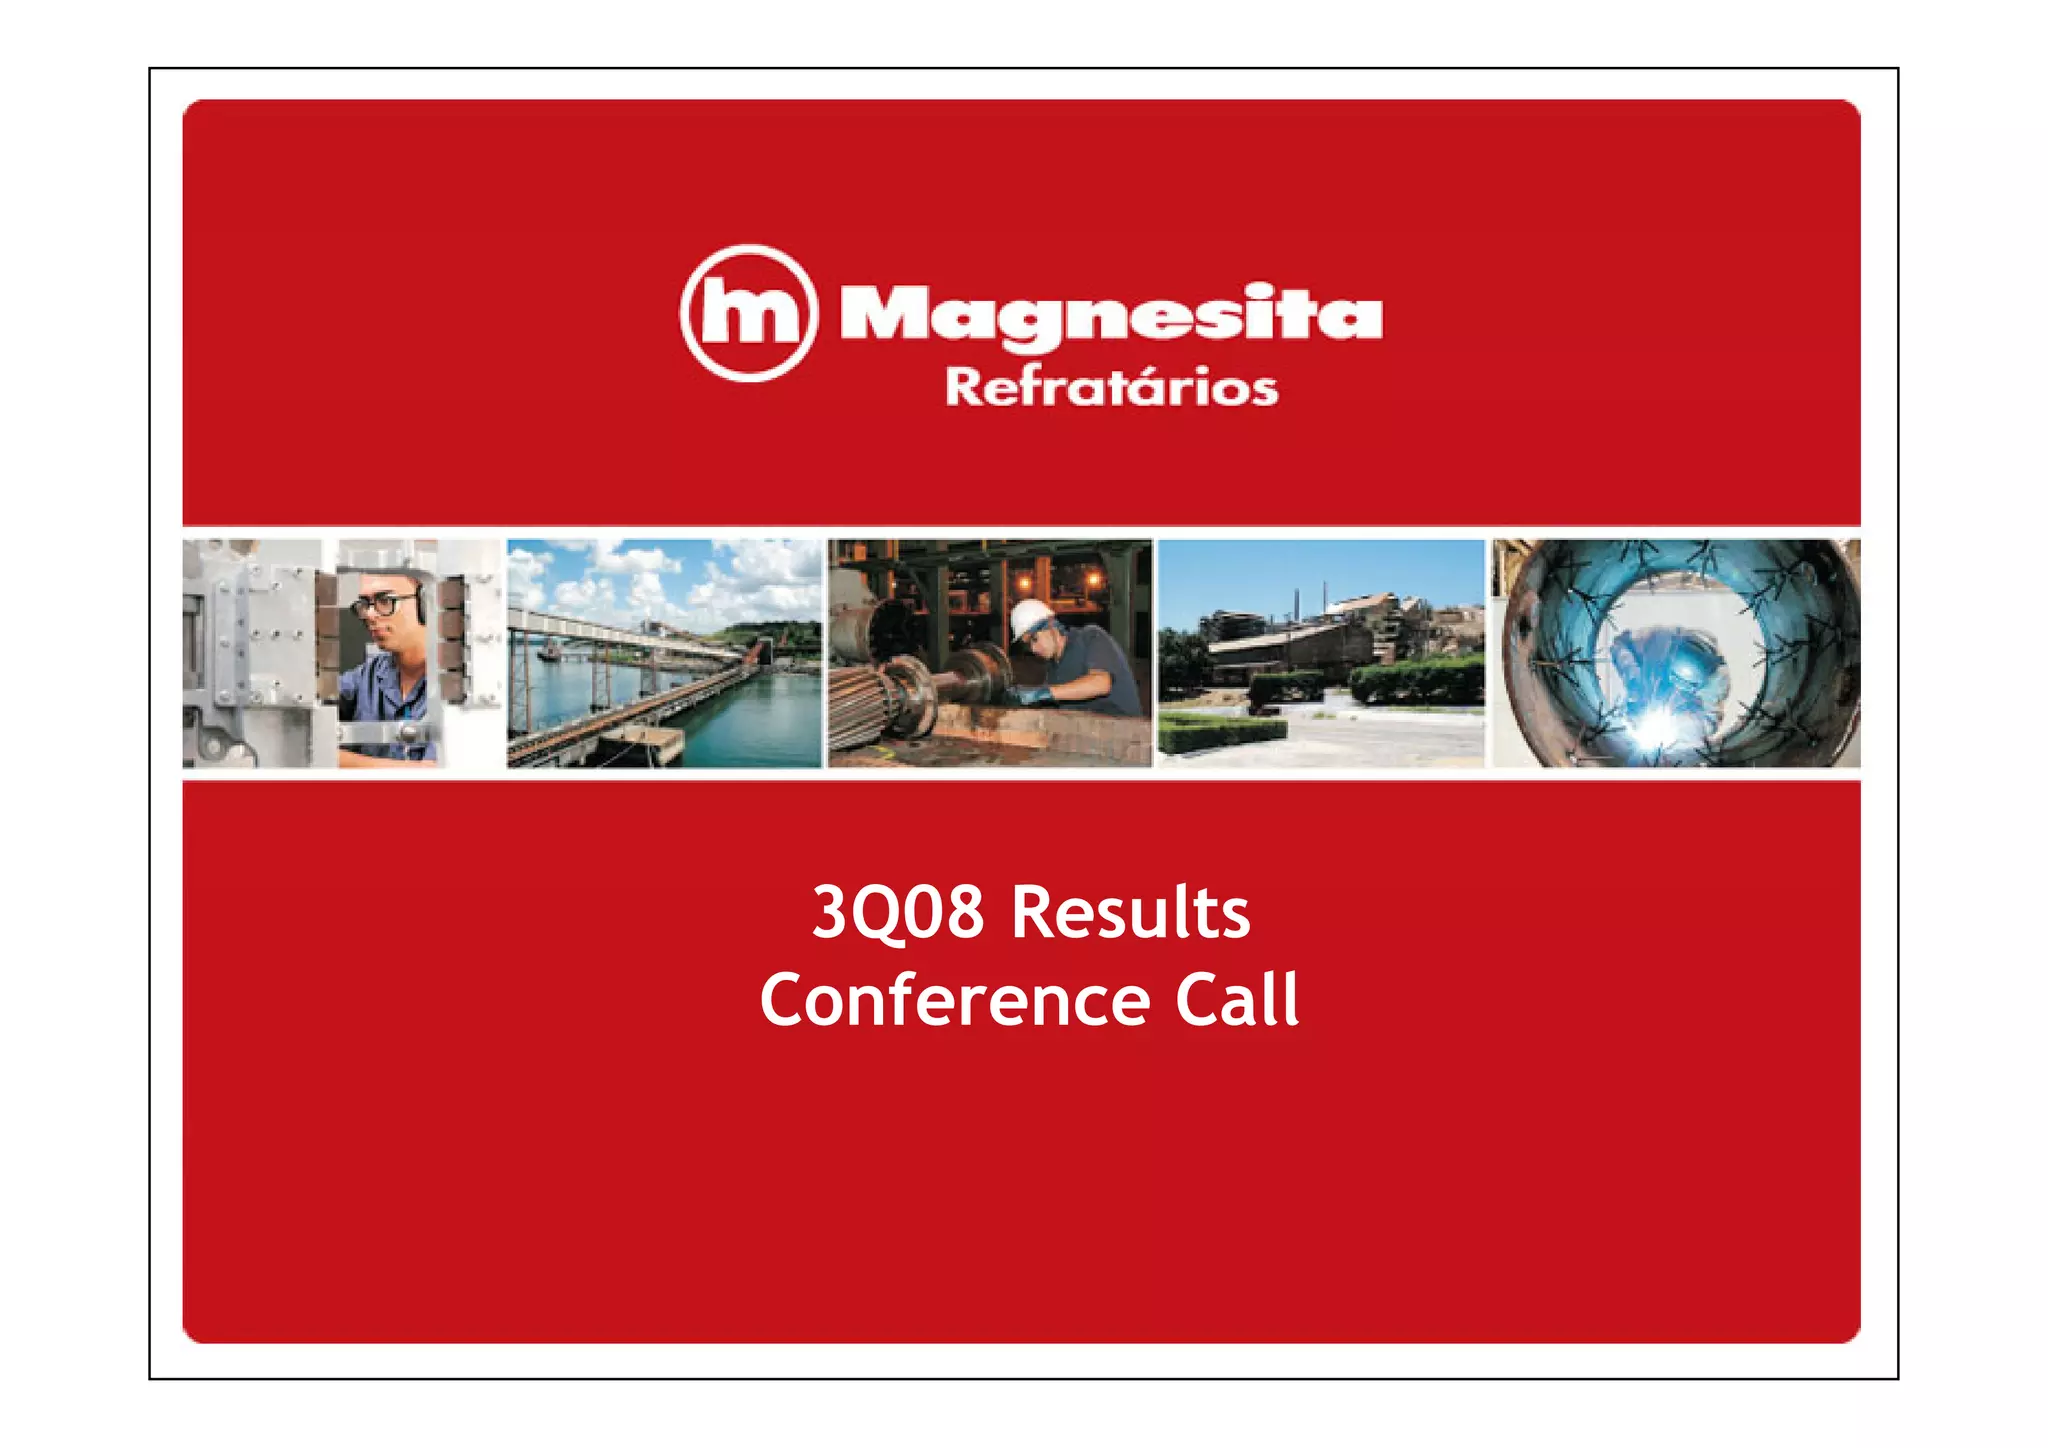
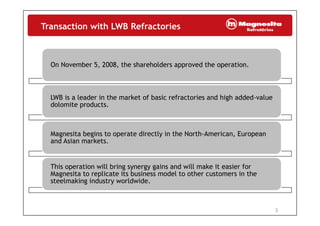
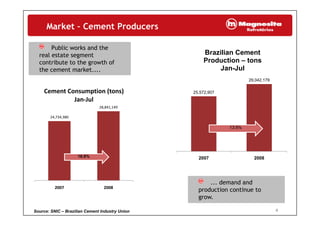
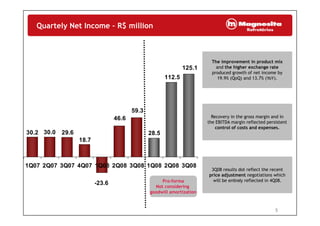
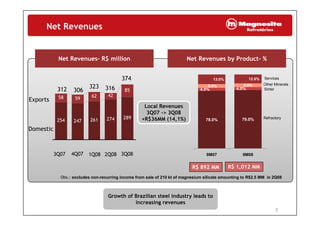
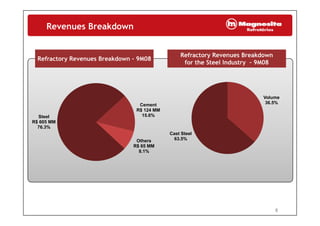
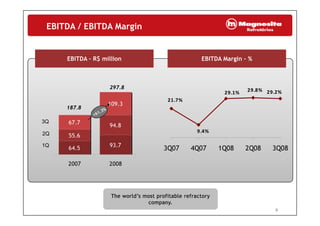
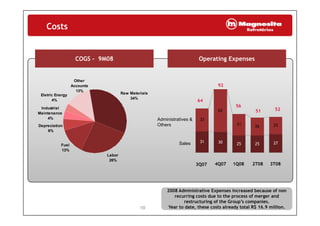
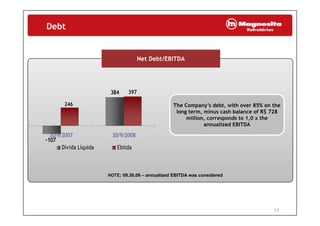
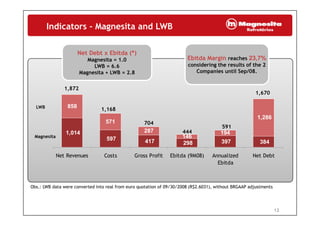
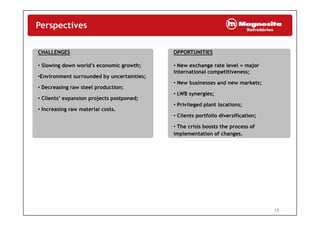
2. Transaction with LWB Refractories
On November 5, 2008, the shareholders approved the operation.
LWB is a leader in the market of basic refractories and high added-value
dolomite products.
Magnesita begins to operate directly in the North-American, European
d A i kand Asian markets.
Thi i ill b i i d ill k i i fThis operation will bring synergy gains and will make it easier for
Magnesita to replicate its business model to other customers in the
steelmaking industry worldwide.
2
3. Market – Steel Industry
Raw Steel Production
i B il 103 t
The steel industry
R St l P d ti i
9,380
in Brazil - 103 tonsremained heated in 3Q08...
26 827
Raw Steel Production in
Brazil – 103 tons
8,677
8,806
25,004
26,827
6.5%
7.3%
3Q07 2Q08 3Q08
8.1%
... surpassing the
production of the previous
9M07 9M08
3
production of the previous
periods.
Source: IBS – Brazilian Steel Institute
4. Market – Cement Producers
Public works and the
real estate segment
contribute to the growth of
Brazilian Cement
Production – tonscontribute to the growth of
the cement market....
29,042,179
Production tons
Jan-Jul
28,841,149
Cement Consumption (tons)
Jan-Jul
25,572,907
24,734,380
13.6%
16.6% 2007 2008
... demand and
production continue to2007 2008
4
production continue to
grow.
Source: SNIC – Brazilian Cement Industry Union
5. Quartely Net Income – R$ million
The improvement in product mixThe improvement in product mix
and the higher exchange rate
produced growth of net income by
19.9% (QoQ) and 13.7% (YoY).
125.1
112.5
59.3
Recovery in the gross margin and in
the EBITDA margin reflected persistent
control of costs and expenses.
28.5
46.6
18 7
29.630.030.2
18.7
1Q07 2Q07 3Q07 4Q07 1Q08 2Q08 3Q08 1Q08 2Q08 3Q08
3Q08 results dot reflect the recent
price adjustment negotiations which
will be entirely reflected in 4Q08.Pro-forma
Not considering
-23.6
1Q07 2Q07 3Q07 4Q07 1Q08 2Q08 3Q08 1Q08 2Q08 3Q08
goodwill amortization
5
6. Sales Breakdown
Sales Volume Breakdown
9M07
Sales Volume Breakdown
9M07
Sales Volume Breakdown
9M08
Sales Volume Breakdown
9M089M079M07 9M089M08
Other
Minerals
26%
Other
Minerals(*)
26%
132 kt
297 kt
24%
313 kt
122 kt
Refractory
60%Sinter
14%
297 kt
68 kt
Sinter
14%
Refractory
62%
313 kt
67 kt
497 kt 502 kt
14% 14% 62%
(*) not including the non-recurring sale of 210,000 metric tons of magnesium silicate in 2Q08
497 kt 502 kt
Sinter
9M08x9M07 = - 1.0%
Total
9M08x9M07 = + 0.9%
Refractory
9M08x9M07 = + 5.2%
6
7. Net Revenues
Net Revenues– R$ millionNet Revenues– R$ million Net Revenues by Product- %Net Revenues by Product- %yy
312
374
323 316 4 0%
5.0% 5.0%
13.0% 12.0% Services
Other Minerals
Local Revenues
3Q07 -> 3Q08
Exports
312 323
306 316 4.0% 4.0%
5.0%
Sinter
58 59 62 42
85
3Q07 -> 3Q08
+R$36MM (14,1%)
Domestic
78.0% 79.0% Refractory
254 247 261 274 289
$
9M07 9M083Q07 4Q07 1Q08 2Q08 3Q08
Obs.: excludes non-recurring income from sale of 210 kt of magnesium silicate amounting to R$2.5 MM in 2Q08
R$ 892 MM R$ 1,012 MM
Growth of Brazilian steel industry leads to
increasing revenues
7
8. Revenues Breakdown
Refractory Revenues Breakdown – 9M08Refractory Revenues Breakdown – 9M08
Refractory Revenues Breakdown
for the Steel Industry 9M08
Refractory Revenues Breakdown
for the Steel Industry 9M08
yy
for the Steel Industry – 9M08for the Steel Industry – 9M08
Cement
R$ 124 MM
Volume
36.5%
Steel
R$ 605 MM
76.3%
15.6%
Cast Steel
63 5%Others
R$ 65 MM
8.1%
63.5%
8
10. Costs
COGS - 9M08COGS - 9M08 Operating ExpensesOperating Expensesp g pp g p
92
Other
Accounts
56
64
51 52
Raw Materials
34%
Industrial
Maintenance
Eletric Energy
4%
13%
62
Administratives &
OthersDepreciation
6%
Maintenance
4% 33
31 26 25
SalesFuel
13%
Labor
26%
31 30 25 25 27
3Q07 4Q07 1Q08 2T08 3T08
2008 Administrative Expenses increased because of non
3Q07 4Q07 1Q08 2T08 3T08
2008 Administrative Expenses increased because of non
recurring costs due to the process of merger and
restructuring of the Group’s companies.
Year to date, these costs already total R$ 16.9 million.10
11. Debt
Net Debt/EBITDANet Debt/EBITDA
The Company’s debt, with over 85% on the
long term, minus cash balance of R$ 728
384 397
246
long term, minus cash balance of R$ 728
million, corresponds to 1,0 x the
annualized EBITDA
107
30/9/2007 30/9/2008
-107
Dívida Líquida Ebitda
NOTE: 09.30.08 – annualized EBITDA was considered
11
12. Indicators - Magnesita and LWB
Ebitda MarginEbitda Margin reaches 23,7%23,7%
Net Debt x Ebitda (*)Net Debt x Ebitda (*)
Magnesita = 1.0
1 872
considering the results of the 2
Companies until Sep/08.
g .
LWB = 6.6
Magnesita + LWB = 2.8
LWB 858
1,872
1,168
1,670
Magnesita
1,014
597
571
287
146
194
1,286
704
444
591
g
597 417 298 397 384
Net Revenues Costs Gross Profit Ebitda (9M08) Annualized
Ebitda
Net Debt
Obs.: LWB data were converted into real from euro quotation of 09/30/2008 (R$2.6031), without BRGAAP adjustments
Ebitda
12
15. Perspectives
CHALLENGES OPPORTUNITIES
• Slowing down world’s economic growth;
•Environment surrounded by uncertainties;
• Decreasing raw steel production;
• New exchange rate level = major
international competitiveness;
• New businesses and new markets;
• Decreasing raw steel production;
• Clients’ expansion projects postponed;
• Increasing raw material costs.
• LWB synergies;
• Privileged plant locations;
• Clients portfolio diversification;
• The crisis boosts the process of
implementation of changes.
15