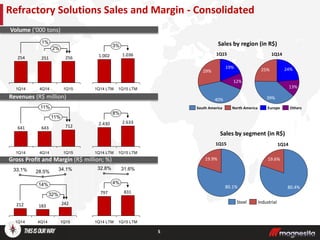
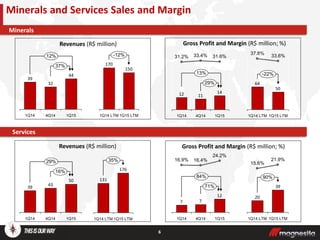
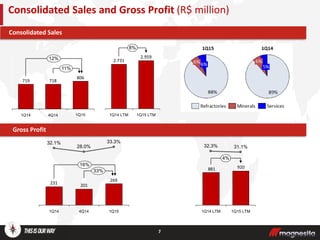
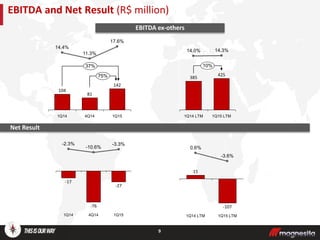
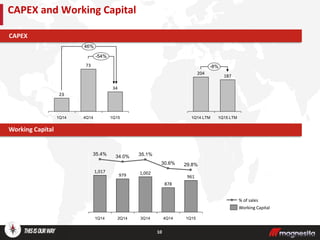
Earnings Call – 1Q15
May 15th, 2015
LTM = “Last Twelve Months”
The consolidated financial statements presented here are consistent with the criteria of international accounting standards - IFRS issued by the
International Accounting Standards Board – IASB, based on audited financial information. Non-financial information contained herein, as well
as other operational information, were not audited by independent auditors and may include forward-looking statements and reflects the
current views and perspectives of the management on the evolution of macro-economic environment, conditions of the mining and
refractories industries, company performance and financial results. Any statements, projections, expectations, estimates and plans contained
in this document that do not describe historical facts, and the factors or trends affecting financial condition, liquidity or results of operations,
are forward-looking statements and involve several risks and uncertainties.
This presentation should not be construed as legal, tax, investment or other advice. This presentation does not constitute an offer, or invitation,
or solicitation of an offer, to subscribe for or purchase any securities, and neither any part of this presentation nor any information or
statement contained herein shall form the basis of or be relied upon in connection with any contract or commitment whatsoever. Under no
circumstances, neither the Company nor its subsidiaries, directors, officers, agents or employees be liable to third parties (including investors)
for any investment decision based on information and statements in this presentation, or for any damages resulting therefrom, corresponding
or specific.
The information presented or contained in this presentation is current as of the date hereof and is subject to change without notice. Magnesita
has no obligation to update it or revise it in light of new information and / or in face of future events, safeguard the current regulations which
we are submitted to. This presentation and its contents are proprietary information of the Company and may not be reproduced or circulated,
partially or completely, without the prior written consent of the Company.
Changes in historical numbers
For comparison purposes, 2013 figures have been adjusted to reflect accounting changes implemented by the Company
in late 2013.
Disclosure
2
Brazil
3
Source: ¹WSA
Crude Steel Production¹ (million tons) - Established Markets
Volume (‘000 tons)*
USA + Canada EU-28
Sales to Steel Segment
Revenues (R$ million)
-3%
-1%
1Q15
210
4Q14
217
1Q14
211
4Q14
545
1Q14
516
5%
11%
1Q15
570
Refractory Solutions Sales - Steel
1%
1%
1Q15
8
4Q14
8
1Q14
8
-6%
-6%
1Q15
23
4Q14
25
1Q14
25 43
4%
-2%
1Q154Q14
41
1Q14
44
Sales by region (in R$)
34 34
1Q14 LTM
-1%
1Q15 LTM
99
0%
1Q15 LTM
99
1Q14 LTM
169
0%
1Q15 LTM
169
1Q14 LTM
1Q15 LTM
3%
881
1Q14 LTM
852
1Q14 LTM
2.194
9%
1Q15 LTM
2.006
*Excluding scraps volume
1Q15
29%
21%
38%
12%
Europe OthersSouth America North America
25% 26%
37%
12%
1Q14
4
Sales to Industrial Segment
Refractory Solutions Sales – Industrial Segment
Volume (‘000 tons) Revenues (R$ million)
46
34
43
1Q14
34%
7%
1Q154Q14
142
98
125
1Q14
45%
13%
1Q154Q14
154151
3%
1Q15 LTM1Q14 LTM
439424
1Q15 LTM
4%
1Q14 LTM
1Q15
29%
11%
47%
13%
Europe OthersSouth America North America
26%
14%
46%
14%
1Q14
Refractory Solutions Sales and Margin - Consolidated
Volume (‘000 tons)
Revenues (R$ million)
Gross Profit and Margin (R$ million; %)
256251254
2%
1%
1Q154Q141Q14
242183212
14%
32%
1Q15
34.1%
4Q14
28.5%
1Q14
33.1%
712643641
11%
11%
1Q154Q141Q14
Sales by region (in R$)
Sales by segment (in R$)
3%
1Q15 LTM
1.036
1Q14 LTM
1.002
8%
1Q15 LTM
2.633
1Q14 LTM
2.430
831797
4%
1Q15 LTM
31.6%
1Q14 LTM
32.8%
5
1Q15
29%
19%
40%
12%
Europe OthersSouth America North America
25% 24%
39%
13%
1Q14
19.9%
80.1%
19.6%
80.4%
1Q15 1Q14
Steel Industrial
6
Revenues (R$ million) Gross Profit and Margin (R$ million; %)
Minerals and Services Sales and Margin
44
32
39
4Q141Q14
37%
12%
1Q15
50
43
39
4Q141Q14
16%
29%
1Q15
14
1112
33.4%
1Q14
31.2%
29%
13%
1Q15
31.6%
4Q14
12
77
16.4%
1Q14
16.9%
71%
84%
1Q15
24.2%
4Q14
Minerals
Services
1Q14 LTM
170
-12%
1Q15 LTM
150
50
64
37.8%
-22%
1Q15 LTM
33.6%
1Q14 LTM
1Q14 LTM
131
35%
1Q15 LTM
176
39
20
1Q14 LTM
90%
1Q15 LTM
21.9%
15.6%
7
Consolidated Sales and Gross Profit (R$ million)
Por Segmento
806
718719
11%
12%
1Q154Q141Q14
Gross Profit
Consolidated Sales
8%
1Q15 LTM
2.959
1Q14 LTM
2.731
269
201231
33%
16%
1Q15
33.3%
4Q14
28.0%
1Q14
32.1%
920881
1Q15 LTM
4%
1Q14 LTM
31.1%32.3%
8
SG&A
Selling Expenses
G&A
1%
9%
1Q15
61
7.6%
4Q14
61
8.5%
1Q14
56
7.8%
5%
0%
1Q15
107
13.2%
4Q14
102
14.2%
1Q14
106
14.8%
Selling Expenses
% of sales
2%
-5%
1Q15
45
5.6%
4Q14
44
6.2%
1Q14
48
6.6%
Consolidated Freight
G&A
% of sales
Others
6%
5%
1Q15
62
7.6%
4Q14
58
8.0%
1Q14
59
8.2%
-1%
1Q15 LTM
240
8.1%
1Q14 LTM
241
8.8%
4%
1Q15 LTM
409
13.8%
1Q14 LTM
392
14.2%
7%
1Q15 LTM
179
6.0%
1Q14 LTM
168
6.1%
3%
1Q15 LTM
230
7.8%
1Q14 LTM
224
8.1%
9
EBITDA and Net Result (R$ million)
Net Result
1Q15
-27
-3.3%
4Q14
-76
-10.6%
1Q14
-17
-2.3%
37%
75%
1Q15
142
17.6%
4Q14
81
11.3%
1Q14
104
14.4%
10%
1Q15 LTM
425
14.3%
1Q14 LTM
385
14.0%
-107
1Q15 LTM
0.6%
15
1Q14 LTM
-3.6%
EBITDA ex-others
10
CAPEX and Working Capital
Working Capital
CAPEX
4Q14
23
34
1Q15
73
1Q14
-54%
46%
30.6%
3Q14
979
34.0%
1Q14
1,017
35.4%
1Q15
961
29.8%
4Q14
878
2Q14
1,002
35.1%
Working Capital
% of sales
187
1Q15 LTM
-8%
204
1Q14 LTM
8,2
Net Debt per currency (as of March* 2015)
11
*EBITDA excluding other revenues/expenses
Amortization Schedule (R$ million)
*EBITDA excluding other revenues/expenses
Leverage and Indebtedness (R$ million)
Amortization Schedule
Leverage ratio Leverage ratio ex-perpetual
1.7061.5961.5371.4841.494
425387404379385
1Q15
3.5x
4.1x
4Q14
3.9x
4.1x
3Q14
3.7x
3.9x
2Q14
4.0x
3.9x
1Q14
3.8x
3.9x
Net Debt / EBITDA Adj by fx
Net Debt / EBITDA¹
EBITDA
Net Debt
887931911922914
425387404379385
1Q15
2,1x
2,1x
4Q14
2,4x
2,4x
3Q14
2,3x
2,3x
2Q14
2,5x
2,5x
1Q14
2,4x
2,4x
Net Debt / EBITDA Adj by fx
Net Debt / EBITDA¹
EBITDA
Net Debt
88.5%
Short term
11.5%
Long term
EUR
20%
USD48%
BRL
32%
*Currency exposure as of March 27th, before the Swap expiration at March 30th
Octavio Pereira Lopes
CEO
Eduardo Gotilla
CFO e IRO
Daniel Domiciano
IR Manager
Lucas Veiga
IR Analyst
Phone: +55 11 3152-3237/3241/3202
ri@magnesita.com
www.magnesita.com/ri
12
Investor Relations

Ppt 1 q15 en vfinal (1)

  • 1.
    Earnings Call –1Q15 May 15th, 2015 LTM = “Last Twelve Months”
  • 2.
    The consolidated financialstatements presented here are consistent with the criteria of international accounting standards - IFRS issued by the International Accounting Standards Board – IASB, based on audited financial information. Non-financial information contained herein, as well as other operational information, were not audited by independent auditors and may include forward-looking statements and reflects the current views and perspectives of the management on the evolution of macro-economic environment, conditions of the mining and refractories industries, company performance and financial results. Any statements, projections, expectations, estimates and plans contained in this document that do not describe historical facts, and the factors or trends affecting financial condition, liquidity or results of operations, are forward-looking statements and involve several risks and uncertainties. This presentation should not be construed as legal, tax, investment or other advice. This presentation does not constitute an offer, or invitation, or solicitation of an offer, to subscribe for or purchase any securities, and neither any part of this presentation nor any information or statement contained herein shall form the basis of or be relied upon in connection with any contract or commitment whatsoever. Under no circumstances, neither the Company nor its subsidiaries, directors, officers, agents or employees be liable to third parties (including investors) for any investment decision based on information and statements in this presentation, or for any damages resulting therefrom, corresponding or specific. The information presented or contained in this presentation is current as of the date hereof and is subject to change without notice. Magnesita has no obligation to update it or revise it in light of new information and / or in face of future events, safeguard the current regulations which we are submitted to. This presentation and its contents are proprietary information of the Company and may not be reproduced or circulated, partially or completely, without the prior written consent of the Company. Changes in historical numbers For comparison purposes, 2013 figures have been adjusted to reflect accounting changes implemented by the Company in late 2013. Disclosure 2
  • 3.
    Brazil 3 Source: ¹WSA Crude SteelProduction¹ (million tons) - Established Markets Volume (‘000 tons)* USA + Canada EU-28 Sales to Steel Segment Revenues (R$ million) -3% -1% 1Q15 210 4Q14 217 1Q14 211 4Q14 545 1Q14 516 5% 11% 1Q15 570 Refractory Solutions Sales - Steel 1% 1% 1Q15 8 4Q14 8 1Q14 8 -6% -6% 1Q15 23 4Q14 25 1Q14 25 43 4% -2% 1Q154Q14 41 1Q14 44 Sales by region (in R$) 34 34 1Q14 LTM -1% 1Q15 LTM 99 0% 1Q15 LTM 99 1Q14 LTM 169 0% 1Q15 LTM 169 1Q14 LTM 1Q15 LTM 3% 881 1Q14 LTM 852 1Q14 LTM 2.194 9% 1Q15 LTM 2.006 *Excluding scraps volume 1Q15 29% 21% 38% 12% Europe OthersSouth America North America 25% 26% 37% 12% 1Q14
  • 4.
    4 Sales to IndustrialSegment Refractory Solutions Sales – Industrial Segment Volume (‘000 tons) Revenues (R$ million) 46 34 43 1Q14 34% 7% 1Q154Q14 142 98 125 1Q14 45% 13% 1Q154Q14 154151 3% 1Q15 LTM1Q14 LTM 439424 1Q15 LTM 4% 1Q14 LTM 1Q15 29% 11% 47% 13% Europe OthersSouth America North America 26% 14% 46% 14% 1Q14
  • 5.
    Refractory Solutions Salesand Margin - Consolidated Volume (‘000 tons) Revenues (R$ million) Gross Profit and Margin (R$ million; %) 256251254 2% 1% 1Q154Q141Q14 242183212 14% 32% 1Q15 34.1% 4Q14 28.5% 1Q14 33.1% 712643641 11% 11% 1Q154Q141Q14 Sales by region (in R$) Sales by segment (in R$) 3% 1Q15 LTM 1.036 1Q14 LTM 1.002 8% 1Q15 LTM 2.633 1Q14 LTM 2.430 831797 4% 1Q15 LTM 31.6% 1Q14 LTM 32.8% 5 1Q15 29% 19% 40% 12% Europe OthersSouth America North America 25% 24% 39% 13% 1Q14 19.9% 80.1% 19.6% 80.4% 1Q15 1Q14 Steel Industrial
  • 6.
    6 Revenues (R$ million)Gross Profit and Margin (R$ million; %) Revenues (R$ million) Gross Profit and Margin (R$ million; %) Minerals and Services Sales and Margin 44 32 39 4Q141Q14 37% 12% 1Q15 50 43 39 4Q141Q14 16% 29% 1Q15 14 1112 33.4% 1Q14 31.2% 29% 13% 1Q15 31.6% 4Q14 12 77 16.4% 1Q14 16.9% 71% 84% 1Q15 24.2% 4Q14 Minerals Services 1Q14 LTM 170 -12% 1Q15 LTM 150 50 64 37.8% -22% 1Q15 LTM 33.6% 1Q14 LTM 1Q14 LTM 131 35% 1Q15 LTM 176 39 20 1Q14 LTM 90% 1Q15 LTM 21.9% 15.6%
  • 7.
    7 Consolidated Sales andGross Profit (R$ million) Por Segmento 806 718719 11% 12% 1Q154Q141Q14 Gross Profit Consolidated Sales 8% 1Q15 LTM 2.959 1Q14 LTM 2.731 269 201231 33% 16% 1Q15 33.3% 4Q14 28.0% 1Q14 32.1% 920881 1Q15 LTM 4% 1Q14 LTM 31.1%32.3%
  • 8.
    8 SG&A Selling Expenses G&A 1% 9% 1Q15 61 7.6% 4Q14 61 8.5% 1Q14 56 7.8% 5% 0% 1Q15 107 13.2% 4Q14 102 14.2% 1Q14 106 14.8% Selling Expenses %of sales 2% -5% 1Q15 45 5.6% 4Q14 44 6.2% 1Q14 48 6.6% Consolidated Freight G&A % of sales Others 6% 5% 1Q15 62 7.6% 4Q14 58 8.0% 1Q14 59 8.2% -1% 1Q15 LTM 240 8.1% 1Q14 LTM 241 8.8% 4% 1Q15 LTM 409 13.8% 1Q14 LTM 392 14.2% 7% 1Q15 LTM 179 6.0% 1Q14 LTM 168 6.1% 3% 1Q15 LTM 230 7.8% 1Q14 LTM 224 8.1%
  • 9.
    9 EBITDA and NetResult (R$ million) Net Result 1Q15 -27 -3.3% 4Q14 -76 -10.6% 1Q14 -17 -2.3% 37% 75% 1Q15 142 17.6% 4Q14 81 11.3% 1Q14 104 14.4% 10% 1Q15 LTM 425 14.3% 1Q14 LTM 385 14.0% -107 1Q15 LTM 0.6% 15 1Q14 LTM -3.6% EBITDA ex-others
  • 10.
    10 CAPEX and WorkingCapital Working Capital CAPEX 4Q14 23 34 1Q15 73 1Q14 -54% 46% 30.6% 3Q14 979 34.0% 1Q14 1,017 35.4% 1Q15 961 29.8% 4Q14 878 2Q14 1,002 35.1% Working Capital % of sales 187 1Q15 LTM -8% 204 1Q14 LTM
  • 11.
    8,2 Net Debt percurrency (as of March* 2015) 11 *EBITDA excluding other revenues/expenses Amortization Schedule (R$ million) *EBITDA excluding other revenues/expenses Leverage and Indebtedness (R$ million) Amortization Schedule Leverage ratio Leverage ratio ex-perpetual 1.7061.5961.5371.4841.494 425387404379385 1Q15 3.5x 4.1x 4Q14 3.9x 4.1x 3Q14 3.7x 3.9x 2Q14 4.0x 3.9x 1Q14 3.8x 3.9x Net Debt / EBITDA Adj by fx Net Debt / EBITDA¹ EBITDA Net Debt 887931911922914 425387404379385 1Q15 2,1x 2,1x 4Q14 2,4x 2,4x 3Q14 2,3x 2,3x 2Q14 2,5x 2,5x 1Q14 2,4x 2,4x Net Debt / EBITDA Adj by fx Net Debt / EBITDA¹ EBITDA Net Debt 88.5% Short term 11.5% Long term EUR 20% USD48% BRL 32% *Currency exposure as of March 27th, before the Swap expiration at March 30th
  • 12.
    Octavio Pereira Lopes CEO EduardoGotilla CFO e IRO Daniel Domiciano IR Manager Lucas Veiga IR Analyst Phone: +55 11 3152-3237/3241/3202 ri@magnesita.com www.magnesita.com/ri 12 Investor Relations