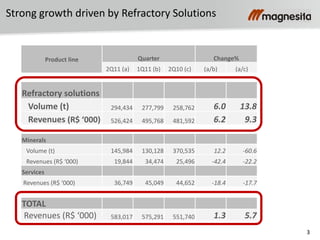
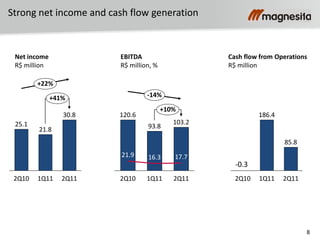
1) The company reported strong growth in the second quarter of 2011, with net revenues up 5.7% driven by a 9.3% increase in refractory solutions. Net income was up 41% from the previous quarter.
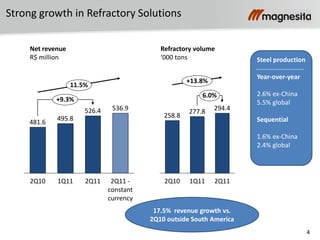
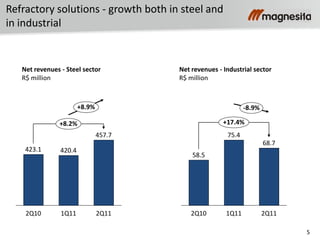
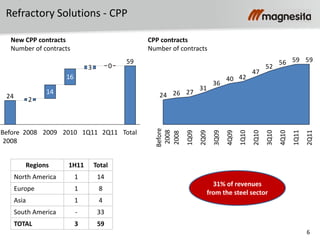
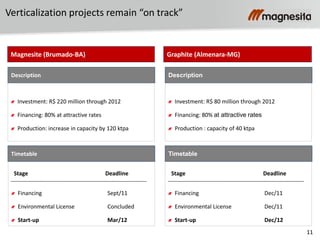
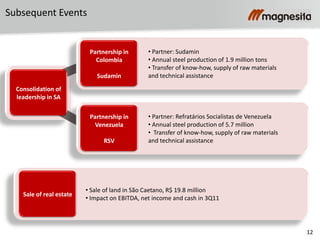
2) Refractory volume increased 13.8% and sales to industrial sectors grew 17.4%, demonstrating growth both in steel and other industries. The company continues progress on verticalization projects in Brazil and partnerships in Colombia and Venezuela.
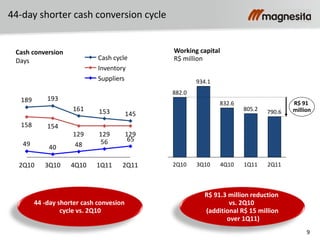
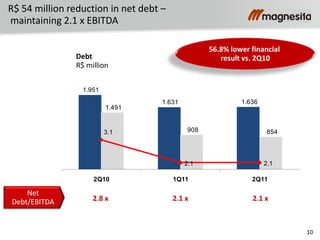
3) Working capital was reduced by R$91 million compared to the previous year through better management of suppliers, inventory, and cash conversion cycle. The company maintained a low debt level of 2.1 times EBITDA.