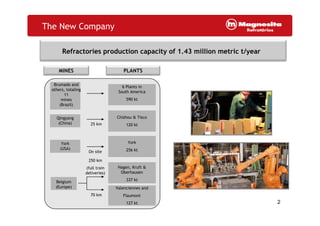
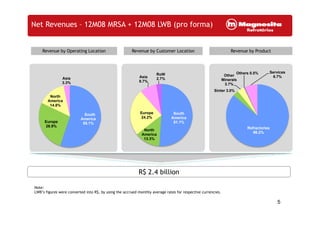
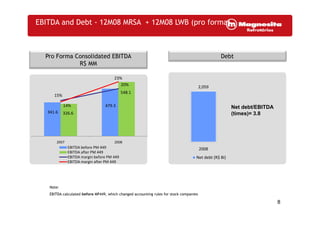
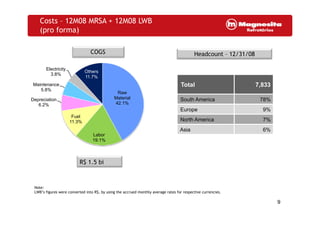
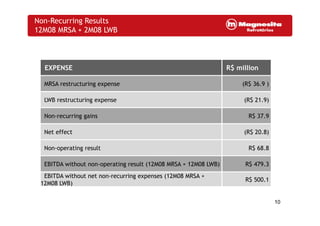
4Q08 Results4Q08 Results
Conference Call
1
The New Company
Refractories production capacity of 1.43 million metric t/year
MINES PLANTS
Brumado and
6 Plants in
others, totaling
11
mines
(Brazil)
6 Plants in
South America
590 kt
Qingyang
(China)
Chizhou & Tisco
120 kt25 km
York
(USA)
York
256 ktOn site
250 km
Valenciennes and
Hagen, Kruft &
Oberhausen
337 kt
(full train
deliveries)
Belgium
(Europe)
Flaumont
127 kt
70 km
2
LWB Acquisition Highlights
• Consolidation of the November and December results (12M MRSA + 2M LWB)
• Global leader in dolomite refractories
• Geographic exposure and customer diversification
• Complete product mix portfolio, covering all applications
• Strong cross-selling opportunity
• Integrated manufacture of magnesite and dolomite products, resulting in easy
raw material availability and cost protection
3
Scale model of the new plant in Chizhou, China
Steel and Cement Production
World Steel Production
(million metric tons)
World Cement Production
(million metric tons)
1 069
1,146
1,250
1,344 1,330
2 150
2,293
2,565
2,770 2,900
848 850
904
970
1,069
1,649 1,699
1,816
1,970
2,150
2000 2001 2002 2003 2004 2005 2006 2007 2008
2000 2001 2002 2003 2004 2005 2006 2007 2008E
B il d tB il d t
Source: World Steel Association Source: Cembureau, SNIC
2000 2001 2002 2003 2004 2005 2006 2007 2008
Brazil data:
Automotive industry: -16.9% (4Q08 vs. 4Q07) and +11.9% (FY08 vs. FY07)
Capital goods: -8.6% (4Q08 vs. 4Q07) and +43.4% (FY08 vs. FY07)
Brazil data:
Automotive industry: -16.9% (4Q08 vs. 4Q07) and +11.9% (FY08 vs. FY07)
Capital goods: -8.6% (4Q08 vs. 4Q07) and +43.4% (FY08 vs. FY07)
4
New real estate acquisition: -6.3% (FY08 vs. FY07)New real estate acquisition: -6.3% (FY08 vs. FY07)
Net Revenues – 12M08 MRSA + 12M08 LWB (pro forma)
Revenue by Operating Location Revenue by Customer Location Revenue by Product
Asia
3.3%
Asia
8.7%
RoW
2.7%
Other
Minerals
3.7%
Others 0.5% Services
6.7%
North
America
14.8%
SouthEurope
Sinter 3.0%
South
America
55.1%Europe
26.9%
South
America
51.1%
North
America
13 3%
Europe
24.2%
Refractories
86.2%
13.3%
Note:
R$ 2.4 billion
5
LWB’s figures were converted into R$, by using the accrued monthly average rates for respective currencies.
Refractories Sales - 12M08 MRSA + 12M08 LWB (pro
forma)
Refractory Revenue by Segment
Refractory Revenue to the Steel
Industry by Business Model
Cement/Lime
11.7%
Other 4.3%
Cast
Steel
28 4%11.7% 28.4%
Steel 84.0%
Per ton
71.6%
R$ 2.1 bi R$ 1.7 bi
Note:
6
LWB’s figures were converted into R$, by using the accrued monthly average rates for respective currencies.
Refractories Sales – 12M08 MRSA + 12M08 LWB
(pro forma)
Refractories Revenue by Material Refractories Revenue by Shape
Others
17.0%
Basic
Magnesia
34.7%
Others
33.3%
Bricks
Masses
17.9%
Basic
Dolomitic
32.0%
Bricks
65.1%
R$ 2.1 bi R$ 2.1 bi
• 1 metric ton of magnesite products -> nearly 634kg of MgO sinter
Note:
• 1 metric ton of magnesite products > nearly 634kg of MgO sinter
• 1 metric ton of alumina products -> nearly 535kg of alumina
• 1 metric ton of dolomite products -> nearly 601kg of doloma
7
LWB’s figures were converted into R$, by using the accrued monthly average rates for respective currencies.
EBITDA and Debt - 12M08 MRSA + 12M08 LWB (pro forma)
Pro Forma Consolidated EBITDA
R$ MM
Debt
R$ MM
2 05920%
23%
2,059
Net debt/EBITDA
(times)= 3 8341 6
479.3
326 6
548.1
15%
14%
(times)= 3.8341.6 326.6
2008
Net debt (R$ Bi)
2007 2008
EBITDA before PM 449
EBITDA after PM 449
EBITDA margin before PM 449
EBITDA margin after PM 449
Note:
8
EBITDA calculated before MP449, which changed accounting rules for stock companies
Costs – 12M08 MRSA + 12M08 LWB
(pro forma)
COGS Headcount – 12/31/08
Total 7,833Maintenance
Electricity
3.8%
Others
11.7%
,
South America 78%
Europe 9%
Raw
Material
42.1%
Depreciation
6.2%
5.8%
North America 7%
Asia 6%
Labor
19 1%
Fuel
11.3%
R$ 1.5 bi
19.1%
$
Note:
9
LWB’s figures were converted into R$, by using the accrued monthly average rates for respective currencies.
Non-Recurring Results
12M08 MRSA + 2M08 LWB
EXPENSE R$ million
MRSA restructuring expense (R$ 36.9 )
LWB restructuring expense (R$ 21.9)
Non-recurring gains R$ 37.9
Net effect (R$ 20.8)
Non-operating result R$ 68.8
EBITDA without non-operating result (12M08 MRSA + 12M08 LWB) R$ 479 3EBITDA without non-operating result (12M08 MRSA + 12M08 LWB) R$ 479.3
EBITDA without net non-recurring expenses (12M08 MRSA +
12M08 LWB)
R$ 500.1
10
Maurício Lustosa de CastroMaurício Lustosa de Castro
CFO and Investor Relations Officer
Adriana Fernandes Lana
Investor Relations Manager
Phone: (+55 31) 3368-1069
Luciana Corrêa CostaLuciana Corrêa Costa
Investor Relations Analyst
Phone: (+55 31) 3368-1068
ri@magnesita.com.br www.magnesita.com.br

Presentations 4 q08

  • 1.
  • 2.
    The New Company Refractoriesproduction capacity of 1.43 million metric t/year MINES PLANTS Brumado and 6 Plants in others, totaling 11 mines (Brazil) 6 Plants in South America 590 kt Qingyang (China) Chizhou & Tisco 120 kt25 km York (USA) York 256 ktOn site 250 km Valenciennes and Hagen, Kruft & Oberhausen 337 kt (full train deliveries) Belgium (Europe) Flaumont 127 kt 70 km 2
  • 3.
    LWB Acquisition Highlights •Consolidation of the November and December results (12M MRSA + 2M LWB) • Global leader in dolomite refractories • Geographic exposure and customer diversification • Complete product mix portfolio, covering all applications • Strong cross-selling opportunity • Integrated manufacture of magnesite and dolomite products, resulting in easy raw material availability and cost protection 3 Scale model of the new plant in Chizhou, China
  • 4.
    Steel and CementProduction World Steel Production (million metric tons) World Cement Production (million metric tons) 1 069 1,146 1,250 1,344 1,330 2 150 2,293 2,565 2,770 2,900 848 850 904 970 1,069 1,649 1,699 1,816 1,970 2,150 2000 2001 2002 2003 2004 2005 2006 2007 2008 2000 2001 2002 2003 2004 2005 2006 2007 2008E B il d tB il d t Source: World Steel Association Source: Cembureau, SNIC 2000 2001 2002 2003 2004 2005 2006 2007 2008 Brazil data: Automotive industry: -16.9% (4Q08 vs. 4Q07) and +11.9% (FY08 vs. FY07) Capital goods: -8.6% (4Q08 vs. 4Q07) and +43.4% (FY08 vs. FY07) Brazil data: Automotive industry: -16.9% (4Q08 vs. 4Q07) and +11.9% (FY08 vs. FY07) Capital goods: -8.6% (4Q08 vs. 4Q07) and +43.4% (FY08 vs. FY07) 4 New real estate acquisition: -6.3% (FY08 vs. FY07)New real estate acquisition: -6.3% (FY08 vs. FY07)
  • 5.
    Net Revenues –12M08 MRSA + 12M08 LWB (pro forma) Revenue by Operating Location Revenue by Customer Location Revenue by Product Asia 3.3% Asia 8.7% RoW 2.7% Other Minerals 3.7% Others 0.5% Services 6.7% North America 14.8% SouthEurope Sinter 3.0% South America 55.1%Europe 26.9% South America 51.1% North America 13 3% Europe 24.2% Refractories 86.2% 13.3% Note: R$ 2.4 billion 5 LWB’s figures were converted into R$, by using the accrued monthly average rates for respective currencies.
  • 6.
    Refractories Sales -12M08 MRSA + 12M08 LWB (pro forma) Refractory Revenue by Segment Refractory Revenue to the Steel Industry by Business Model Cement/Lime 11.7% Other 4.3% Cast Steel 28 4%11.7% 28.4% Steel 84.0% Per ton 71.6% R$ 2.1 bi R$ 1.7 bi Note: 6 LWB’s figures were converted into R$, by using the accrued monthly average rates for respective currencies.
  • 7.
    Refractories Sales –12M08 MRSA + 12M08 LWB (pro forma) Refractories Revenue by Material Refractories Revenue by Shape Others 17.0% Basic Magnesia 34.7% Others 33.3% Bricks Masses 17.9% Basic Dolomitic 32.0% Bricks 65.1% R$ 2.1 bi R$ 2.1 bi • 1 metric ton of magnesite products -> nearly 634kg of MgO sinter Note: • 1 metric ton of magnesite products > nearly 634kg of MgO sinter • 1 metric ton of alumina products -> nearly 535kg of alumina • 1 metric ton of dolomite products -> nearly 601kg of doloma 7 LWB’s figures were converted into R$, by using the accrued monthly average rates for respective currencies.
  • 8.
    EBITDA and Debt- 12M08 MRSA + 12M08 LWB (pro forma) Pro Forma Consolidated EBITDA R$ MM Debt R$ MM 2 05920% 23% 2,059 Net debt/EBITDA (times)= 3 8341 6 479.3 326 6 548.1 15% 14% (times)= 3.8341.6 326.6 2008 Net debt (R$ Bi) 2007 2008 EBITDA before PM 449 EBITDA after PM 449 EBITDA margin before PM 449 EBITDA margin after PM 449 Note: 8 EBITDA calculated before MP449, which changed accounting rules for stock companies
  • 9.
    Costs – 12M08MRSA + 12M08 LWB (pro forma) COGS Headcount – 12/31/08 Total 7,833Maintenance Electricity 3.8% Others 11.7% , South America 78% Europe 9% Raw Material 42.1% Depreciation 6.2% 5.8% North America 7% Asia 6% Labor 19 1% Fuel 11.3% R$ 1.5 bi 19.1% $ Note: 9 LWB’s figures were converted into R$, by using the accrued monthly average rates for respective currencies.
  • 10.
    Non-Recurring Results 12M08 MRSA+ 2M08 LWB EXPENSE R$ million MRSA restructuring expense (R$ 36.9 ) LWB restructuring expense (R$ 21.9) Non-recurring gains R$ 37.9 Net effect (R$ 20.8) Non-operating result R$ 68.8 EBITDA without non-operating result (12M08 MRSA + 12M08 LWB) R$ 479 3EBITDA without non-operating result (12M08 MRSA + 12M08 LWB) R$ 479.3 EBITDA without net non-recurring expenses (12M08 MRSA + 12M08 LWB) R$ 500.1 10
  • 11.
    Maurício Lustosa deCastroMaurício Lustosa de Castro CFO and Investor Relations Officer Adriana Fernandes Lana Investor Relations Manager Phone: (+55 31) 3368-1069 Luciana Corrêa CostaLuciana Corrêa Costa Investor Relations Analyst Phone: (+55 31) 3368-1068 ri@magnesita.com.br www.magnesita.com.br