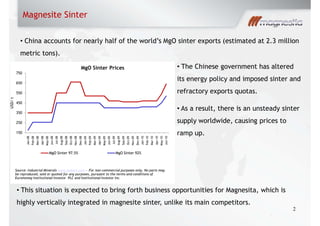
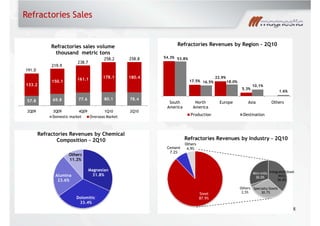
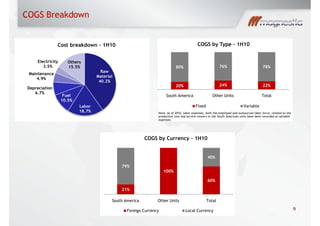
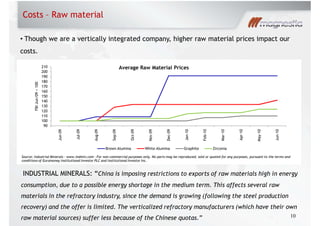
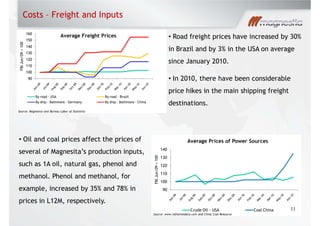
2Q10 Results Conference Call
August 16, 2010
Magnesite Sinter
2
China accounts for nearly half of the world s MgO sinter exports (estimated at 2.3 million
metric tons).
The Chinese government has altered
its energy policy and imposed sinter and
refractory exports quotas.
As a result, there is an unsteady sinter
supply worldwide, causing prices to
ramp up.
Source: Industrial Minerals www.indmin.com - For non-commercial purposes only. No parts may
be reproduced, sold or quoted for any purposes, pursuant to the terms and conditions of
Euromoney Institutional Investor PLC and Institutional Investor Inc.
This situation is expected to bring forth business opportunities for Magnesita, which is
highly vertically integrated in magnesite sinter, unlike its main competitors.
150
250
350
450
550
650
750
Jan-08
Feb-08
Mar-08
Apr-08
May-08
Jun-08
Jul-08
Aug-08
Sep-08
Oct-08
Nov-08
Dec-08
Jan-09
Feb-09
Mar-09
Apr-09
May-09
Jun-09
Jul-09
Aug-09
Sep-09
Oct-09
Nov-09
Dec-09
Jan-10
Feb-10
Mar-10
Apr-10
May-10
Jun-10
USD/t
MgO Sinter Prices
MgO Sinter 97.5% MgO Sinter 92%
Capital Expenditures
3
Investments of R$ 220 million are planned to increase capacity in the Brumado mines
over the next 3 years, aimed at securing the Company's future demand for magnesite
sinter.
Our current M30 sinter production capacity is 180,000 metric tons per year.
This investment will allow the Company to grow along with the Brazilian market,
while keeping high service levels.
This project is part of a multi-annual
investment plan designed to increase the
magnesite sinter (M30) production capacity
in two phases of 60,000 metric tons/year,
totaling 120,000 metric tons/year in 3
years.
Market Environment - Steel Industry
4
World s crude steel production of 364
million metric tons: new record of
quarterly production volume;
Steel distributors inventories on the rise;
The vehicles production remains heated
despite the discontinuation of tax
incentives.
Source: World Steel Association
Source: ANFAVEASource: Barclays
201.4 188.1 208.5 206.0 220.1 229.3
55.9
31.4
35.0 40.5 42.5 47.2
25.5
12.5
16.4 17.5
19.6 21.4
8.8
.5.6
7.9 8.1
8.0
8.4
356.8
284.6
319.2 326.9 344.0 364.0
2Q08 2Q09 3Q09 4Q09 1Q10 2Q10
World Crude Steel Production
million metric tons
Asia EU-27 USA Brazil World
807,835
851,341
861,620
833,979
919,222
2Q09 3Q09 4Q09 1Q10 2Q10
Production of Vehicles in Brazil
0
1
2
3
4
5
6
7
8
9
10
No.months
Brazilian distributors' inventories of
main steel products
Heavy plates HRC - Hot Rolled Coil Slabs
Market Environment - Cement Production
5
Brazil s cement production remains
close to its historical record highs, with
good prospects of investments in
capacity expansion by 2011.
Alumina products accounted for 23.6% of
refractory revenues and the cement
segment for 7.2% of total revenues.
Cement production capacity increase
projection - 2009-2011
Source: Magnesita
Group
MM tonnes
per year
Votorantim 8.0
Cimpor 5.0
Camargo Corrêa 3.5
Holcim 3.0
CSN 3.0
Others 4.5
Total 27.0
11,754
12,580
14,132
13,418
11,709
12,328
13,697 13,746
13,308
1Q08 2Q08 3Q08 4Q08 1Q09 2Q09 3Q09 4Q09 1Q10
Cement Production in Brazil
million metric tons
Source: SNIC
CPP contracts since 2008
6
CPP Cost per Performance Business Model
331.8
370.6
416.4 425.5 423.1
A 16% rise in 2Q10 revenues from the
steel industry under CPP contracts
quarter-over-quarter, and +73.4% year-
over-year.
New contracts in 2Q10:
1. ELG Haniel Metals, UK
2. ThyssenKrupp Beeckerwerth, Germany
3. Client under confidentiality, Germany
4. TISCO, China
5. Jiaxing Eastern Special Steel, China
USA/Canada
Ecuador
China
1
2
1
UK
2
Germany
2
Brazil
Chile
Peru
1
4
1
4
Mexico
23 new CPP contracts have been originated
until jun/10 under the current Management.
In 3Q10, the Company was chosen by four
North American steel mills as a refractory
supplier under the CPP model. 6
26% 25% 27% 31% 36%
74% 75%
73% 69% 64%
2Q09 3Q09 4Q09 1Q10 2Q10
Revenues from Refractories to the Steel
Industry - R$ millions
CPP Volume
Financial Performance
7
144.2
169.7
183.6
196.2 199.2
31.8
35.1
34.1 34.7
36.1
30
32
34
36
38
40
42
44
0
50
100
150
200
250
2Q09 3Q09 4Q09 1Q10 2Q10
Gross Profit and Gross Margin
Gross Profit - R$ million Gross Margin - %
110.5
108.4
19.5
19.7
19,2
19,7
20,2
90
95
100
105
110
115
1Q10 2Q10
Adjusted EBITDA and Adjusted
EBITDA Margin
Adjusted EBITDA R$ million EBITDA Margin %
71.6
110.1
138.8
123.1 119.5
15.8
22.8
25.8
21.8 21.7
10
15
20
25
30
35
40
0
20
40
60
80
100
120
140
160
2Q09 3Q09 4Q09 1Q10 2Q10
EBTIDA and EBITDA Margin
Ebitda - R$ million Ebitda margin
39.7% 45.8% 41.3% 45.9% 47.6%
60.3%
54.2% 58.7%
54.1% 52.4%
2Q09 3Q09 4Q09 1Q10 2Q10
Revenues R$ million
Domestic Market Export Market
454.2 483.6
537.7 565.9 551.7
Refractories Sales
8
191.0
219.9
238.7
258.2 258.8
57.8 69.8 77.6 80.1 78.4
133.2
150.1
161.1 178.1 180.4
2Q09 3Q09 4Q09 1Q10 2Q10
Refractories sales volume
thousand metric tons
Domestic market Overseas Market
54.3%
17.5%
22.9%
5.3%
53.8%
16.5% 18.0%
10.1%
1.6%
South
America
North
America
Europe Asia Others
Refractories Revenues by Region 2Q10
Production Destination
Magnesian
31.8%
Dolomitic
33.4%
Alumina
23.6%
Others
11.2%
Refractories Revenues by Chemical
Composition 2Q10
Steel
87.9%
Cement
7.2%
Others
4,9%
Integrated Steel
Mills
36.8%
Specialty Steels
30.7%
Others
2,5%
Mini mills
30.0%
Refractories Revenues by Industry - 2Q10
COGS Breakdown
9
Note: As of 2010, labor expenses, both the employed and outsourced labor force, related to the
production cost and service centers in the South American units have been recorded as variable
expenses.
21%
100%
60%
79%
40%
South America Other Units Total
COGS by Currency 1H10
Foreign Currency Local Currency
20% 24% 22%
80% 76% 78%
South America Other Units Total
COGS by Type 1H10
Fixed Variable
Raw
Material
40.2%
Labor
18.7%
Fuel
10.5%
Depreciation
6.7%
Maintenance
4.9%
Electricity
3.5%
Others
15.5%
Cost breakdown - 1H10
INDUSTRIAL MINERALS: China is imposing restrictions to exports of raw materials high in energy
consumption, due to a possible energy shortage in the medium term. This affects several raw
materials in the refractory industry, since the demand is growing (following the steel production
recovery) and the offer is limited. The verticalized refractory manufacturers (which have their own
raw material sources) suffer less because of the Chinese quotas.
Costs Raw material
10
Though we are a vertically integrated company, higher raw material prices impact our
costs.
Source: Industrial Minerals - www.indmin.com - For non-commercial purposes only. No parts may be reproduced, sold or quoted for any purposes, pursuant to the terms and
conditions of Euromoney Institutional Investor PLC and Institutional Investor Inc.
90
100
110
120
130
140
150
160
170
180
190
200
210
Jun-09
Jul-09
Aug-09
Sep-09
Oct-09
Nov-09
Dec-09
Jan-10
Feb-10
Mar-10
Apr-10
May-10
Jun-10
FBIJun/09=100
Average Raw Material Prices
Brown Alumina White Alumina Graphite Zirconia
Costs Freight and Inputs
Road freight prices have increased by 30%
in Brazil and by 3% in the USA on average
since January 2010.
In 2010, there have been considerable
price hikes in the main shipping freight
destinations.
Source: Magnesita and Bureau Labor of Statistics
Source: www.inflationdata.com and China Coal Resource
Oil and coal prices affect the prices of
several of Magnesita s production inputs,
such as 1A oil, natural gas, phenol and
methanol. Phenol and methanol, for
example, increased by 35% and 78% in
prices in L12M, respectively.
11
90
100
110
120
130
140
150
160
FBIJun/09=100
Average Freight Prices
By road - USA By road - Brazil
By ship - Baltimore - Germany By ship - Baltimore - China
90
100
110
120
130
140
FBIJun/09=100
Average Prices of Power Sources
Crude Oil - USA Coal China
ST 15.3% ST 11.8%
LT 84.7%
LT 88.5%
1,491.0
459.8
Gross Debt
06-30-2009
Gross Debt
06-30-2010
Cash Net Debt
Debt Profile R$ million
Indebtedness
* EBITDA in the last 12 months 12
1,919
1,434 1,415 1,413
1,491
6/30/2009 9/30/2009 12/31/2009 3/31/2010 06/30/10
Net debt - R$ million
223.8
20.9 29.2
331.0 323.1 321.5
701.3
2010 2011 2012 2013 2014 2015 2020
Debt Amortization Schedule
R$ million 5.6 5.5
3.9
3.2 3.0
4.3
2.6
1.8
1.4
1.8
2Q09 3Q09 4Q09 1Q10 2Q10
Financial Indicators
Net debt/EBITDA
EBITDA/Finacial expenses + Monetary/Exchange
Variations/Forex Liabilities
2,174.5
1,950.8
Share Performance
13
Coverage of major banks: Itaú, Credit Suisse, BTG Pactual, Merrill Lynch, Santander,
Barclays, Deutsche Bank and Safra
Average daily volume of R$ 5.7 million in 2Q10
31%
18%
Source: BM&FBOVESPA
95
115
135
155
175
195
Jun-09 Jul-09 Aug-09 Sep-09 Oct-09 Nov-09 Dec-09 Jan-10 Mar-10 Apr-10 May-10 Jun-10
FBI06/30/09=100
Stock Performance
(06/30/2009 thru 06/30/2010)
MAGG3 IBOVESPA
Flávio Rezende Barbosa
CFO and Investor Relations Officer
Adriana Fernandes Lana
Investor Relations Manager
Phone: +55 31 3368-1069
Lucas Lima Ferreira
Investor Relations Analyst
Phone: +55 31 3368-1068
ri@magnesita.com.br www.magnesita.com/ri
14

Magnesita apres tele_eng_2_t10

  • 1.
    2Q10 Results ConferenceCall August 16, 2010
  • 2.
    Magnesite Sinter 2 China accountsfor nearly half of the world s MgO sinter exports (estimated at 2.3 million metric tons). The Chinese government has altered its energy policy and imposed sinter and refractory exports quotas. As a result, there is an unsteady sinter supply worldwide, causing prices to ramp up. Source: Industrial Minerals www.indmin.com - For non-commercial purposes only. No parts may be reproduced, sold or quoted for any purposes, pursuant to the terms and conditions of Euromoney Institutional Investor PLC and Institutional Investor Inc. This situation is expected to bring forth business opportunities for Magnesita, which is highly vertically integrated in magnesite sinter, unlike its main competitors. 150 250 350 450 550 650 750 Jan-08 Feb-08 Mar-08 Apr-08 May-08 Jun-08 Jul-08 Aug-08 Sep-08 Oct-08 Nov-08 Dec-08 Jan-09 Feb-09 Mar-09 Apr-09 May-09 Jun-09 Jul-09 Aug-09 Sep-09 Oct-09 Nov-09 Dec-09 Jan-10 Feb-10 Mar-10 Apr-10 May-10 Jun-10 USD/t MgO Sinter Prices MgO Sinter 97.5% MgO Sinter 92%
  • 3.
    Capital Expenditures 3 Investments ofR$ 220 million are planned to increase capacity in the Brumado mines over the next 3 years, aimed at securing the Company's future demand for magnesite sinter. Our current M30 sinter production capacity is 180,000 metric tons per year. This investment will allow the Company to grow along with the Brazilian market, while keeping high service levels. This project is part of a multi-annual investment plan designed to increase the magnesite sinter (M30) production capacity in two phases of 60,000 metric tons/year, totaling 120,000 metric tons/year in 3 years.
  • 4.
    Market Environment -Steel Industry 4 World s crude steel production of 364 million metric tons: new record of quarterly production volume; Steel distributors inventories on the rise; The vehicles production remains heated despite the discontinuation of tax incentives. Source: World Steel Association Source: ANFAVEASource: Barclays 201.4 188.1 208.5 206.0 220.1 229.3 55.9 31.4 35.0 40.5 42.5 47.2 25.5 12.5 16.4 17.5 19.6 21.4 8.8 .5.6 7.9 8.1 8.0 8.4 356.8 284.6 319.2 326.9 344.0 364.0 2Q08 2Q09 3Q09 4Q09 1Q10 2Q10 World Crude Steel Production million metric tons Asia EU-27 USA Brazil World 807,835 851,341 861,620 833,979 919,222 2Q09 3Q09 4Q09 1Q10 2Q10 Production of Vehicles in Brazil 0 1 2 3 4 5 6 7 8 9 10 No.months Brazilian distributors' inventories of main steel products Heavy plates HRC - Hot Rolled Coil Slabs
  • 5.
    Market Environment -Cement Production 5 Brazil s cement production remains close to its historical record highs, with good prospects of investments in capacity expansion by 2011. Alumina products accounted for 23.6% of refractory revenues and the cement segment for 7.2% of total revenues. Cement production capacity increase projection - 2009-2011 Source: Magnesita Group MM tonnes per year Votorantim 8.0 Cimpor 5.0 Camargo Corrêa 3.5 Holcim 3.0 CSN 3.0 Others 4.5 Total 27.0 11,754 12,580 14,132 13,418 11,709 12,328 13,697 13,746 13,308 1Q08 2Q08 3Q08 4Q08 1Q09 2Q09 3Q09 4Q09 1Q10 Cement Production in Brazil million metric tons Source: SNIC
  • 6.
    CPP contracts since2008 6 CPP Cost per Performance Business Model 331.8 370.6 416.4 425.5 423.1 A 16% rise in 2Q10 revenues from the steel industry under CPP contracts quarter-over-quarter, and +73.4% year- over-year. New contracts in 2Q10: 1. ELG Haniel Metals, UK 2. ThyssenKrupp Beeckerwerth, Germany 3. Client under confidentiality, Germany 4. TISCO, China 5. Jiaxing Eastern Special Steel, China USA/Canada Ecuador China 1 2 1 UK 2 Germany 2 Brazil Chile Peru 1 4 1 4 Mexico 23 new CPP contracts have been originated until jun/10 under the current Management. In 3Q10, the Company was chosen by four North American steel mills as a refractory supplier under the CPP model. 6 26% 25% 27% 31% 36% 74% 75% 73% 69% 64% 2Q09 3Q09 4Q09 1Q10 2Q10 Revenues from Refractories to the Steel Industry - R$ millions CPP Volume
  • 7.
    Financial Performance 7 144.2 169.7 183.6 196.2 199.2 31.8 35.1 34.134.7 36.1 30 32 34 36 38 40 42 44 0 50 100 150 200 250 2Q09 3Q09 4Q09 1Q10 2Q10 Gross Profit and Gross Margin Gross Profit - R$ million Gross Margin - % 110.5 108.4 19.5 19.7 19,2 19,7 20,2 90 95 100 105 110 115 1Q10 2Q10 Adjusted EBITDA and Adjusted EBITDA Margin Adjusted EBITDA R$ million EBITDA Margin % 71.6 110.1 138.8 123.1 119.5 15.8 22.8 25.8 21.8 21.7 10 15 20 25 30 35 40 0 20 40 60 80 100 120 140 160 2Q09 3Q09 4Q09 1Q10 2Q10 EBTIDA and EBITDA Margin Ebitda - R$ million Ebitda margin 39.7% 45.8% 41.3% 45.9% 47.6% 60.3% 54.2% 58.7% 54.1% 52.4% 2Q09 3Q09 4Q09 1Q10 2Q10 Revenues R$ million Domestic Market Export Market 454.2 483.6 537.7 565.9 551.7
  • 8.
    Refractories Sales 8 191.0 219.9 238.7 258.2 258.8 57.869.8 77.6 80.1 78.4 133.2 150.1 161.1 178.1 180.4 2Q09 3Q09 4Q09 1Q10 2Q10 Refractories sales volume thousand metric tons Domestic market Overseas Market 54.3% 17.5% 22.9% 5.3% 53.8% 16.5% 18.0% 10.1% 1.6% South America North America Europe Asia Others Refractories Revenues by Region 2Q10 Production Destination Magnesian 31.8% Dolomitic 33.4% Alumina 23.6% Others 11.2% Refractories Revenues by Chemical Composition 2Q10 Steel 87.9% Cement 7.2% Others 4,9% Integrated Steel Mills 36.8% Specialty Steels 30.7% Others 2,5% Mini mills 30.0% Refractories Revenues by Industry - 2Q10
  • 9.
    COGS Breakdown 9 Note: Asof 2010, labor expenses, both the employed and outsourced labor force, related to the production cost and service centers in the South American units have been recorded as variable expenses. 21% 100% 60% 79% 40% South America Other Units Total COGS by Currency 1H10 Foreign Currency Local Currency 20% 24% 22% 80% 76% 78% South America Other Units Total COGS by Type 1H10 Fixed Variable Raw Material 40.2% Labor 18.7% Fuel 10.5% Depreciation 6.7% Maintenance 4.9% Electricity 3.5% Others 15.5% Cost breakdown - 1H10
  • 10.
    INDUSTRIAL MINERALS: Chinais imposing restrictions to exports of raw materials high in energy consumption, due to a possible energy shortage in the medium term. This affects several raw materials in the refractory industry, since the demand is growing (following the steel production recovery) and the offer is limited. The verticalized refractory manufacturers (which have their own raw material sources) suffer less because of the Chinese quotas. Costs Raw material 10 Though we are a vertically integrated company, higher raw material prices impact our costs. Source: Industrial Minerals - www.indmin.com - For non-commercial purposes only. No parts may be reproduced, sold or quoted for any purposes, pursuant to the terms and conditions of Euromoney Institutional Investor PLC and Institutional Investor Inc. 90 100 110 120 130 140 150 160 170 180 190 200 210 Jun-09 Jul-09 Aug-09 Sep-09 Oct-09 Nov-09 Dec-09 Jan-10 Feb-10 Mar-10 Apr-10 May-10 Jun-10 FBIJun/09=100 Average Raw Material Prices Brown Alumina White Alumina Graphite Zirconia
  • 11.
    Costs Freight andInputs Road freight prices have increased by 30% in Brazil and by 3% in the USA on average since January 2010. In 2010, there have been considerable price hikes in the main shipping freight destinations. Source: Magnesita and Bureau Labor of Statistics Source: www.inflationdata.com and China Coal Resource Oil and coal prices affect the prices of several of Magnesita s production inputs, such as 1A oil, natural gas, phenol and methanol. Phenol and methanol, for example, increased by 35% and 78% in prices in L12M, respectively. 11 90 100 110 120 130 140 150 160 FBIJun/09=100 Average Freight Prices By road - USA By road - Brazil By ship - Baltimore - Germany By ship - Baltimore - China 90 100 110 120 130 140 FBIJun/09=100 Average Prices of Power Sources Crude Oil - USA Coal China
  • 12.
    ST 15.3% ST11.8% LT 84.7% LT 88.5% 1,491.0 459.8 Gross Debt 06-30-2009 Gross Debt 06-30-2010 Cash Net Debt Debt Profile R$ million Indebtedness * EBITDA in the last 12 months 12 1,919 1,434 1,415 1,413 1,491 6/30/2009 9/30/2009 12/31/2009 3/31/2010 06/30/10 Net debt - R$ million 223.8 20.9 29.2 331.0 323.1 321.5 701.3 2010 2011 2012 2013 2014 2015 2020 Debt Amortization Schedule R$ million 5.6 5.5 3.9 3.2 3.0 4.3 2.6 1.8 1.4 1.8 2Q09 3Q09 4Q09 1Q10 2Q10 Financial Indicators Net debt/EBITDA EBITDA/Finacial expenses + Monetary/Exchange Variations/Forex Liabilities 2,174.5 1,950.8
  • 13.
    Share Performance 13 Coverage ofmajor banks: Itaú, Credit Suisse, BTG Pactual, Merrill Lynch, Santander, Barclays, Deutsche Bank and Safra Average daily volume of R$ 5.7 million in 2Q10 31% 18% Source: BM&FBOVESPA 95 115 135 155 175 195 Jun-09 Jul-09 Aug-09 Sep-09 Oct-09 Nov-09 Dec-09 Jan-10 Mar-10 Apr-10 May-10 Jun-10 FBI06/30/09=100 Stock Performance (06/30/2009 thru 06/30/2010) MAGG3 IBOVESPA
  • 14.
    Flávio Rezende Barbosa CFOand Investor Relations Officer Adriana Fernandes Lana Investor Relations Manager Phone: +55 31 3368-1069 Lucas Lima Ferreira Investor Relations Analyst Phone: +55 31 3368-1068 ri@magnesita.com.br www.magnesita.com/ri 14