This document summarizes the key points from a 1Q11 results conference call for Magnesita. The summary includes:
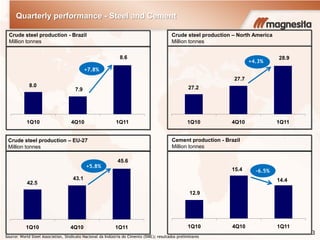
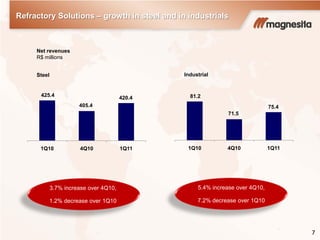
- Steel and cement production increased in Brazil in 1Q11 compared to 4Q10 and 1Q10.
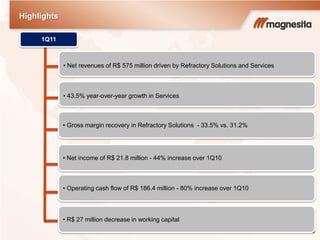
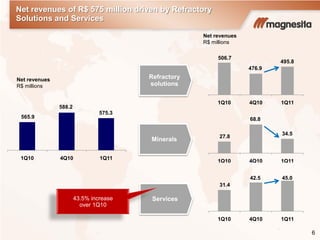
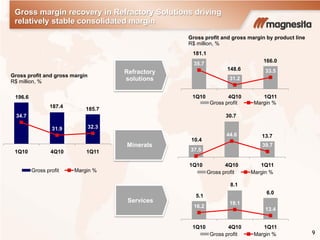
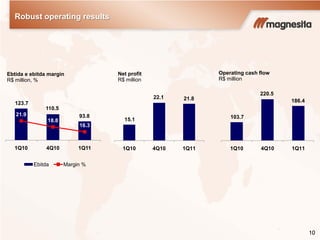
- Magnesita's net revenues were R$575 million driven by growth in refractory solutions and services. Net income increased 44% to R$21.8 million.
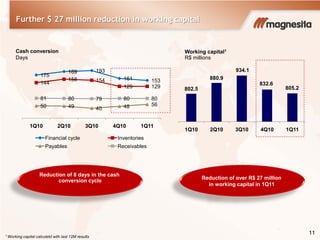
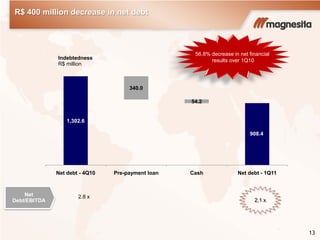
- Working capital was reduced by R$27 million through decreases in inventories and receivables. Net debt decreased significantly.
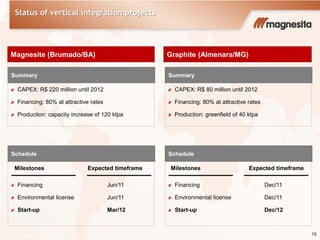
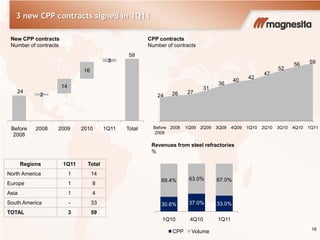
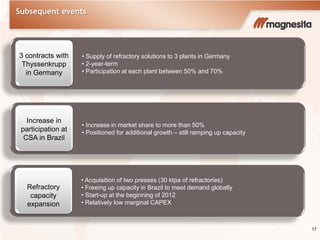
- Two new projects will increase magnesite and graphite production capacity. Three new long-term contracts for refractory solutions were signed.