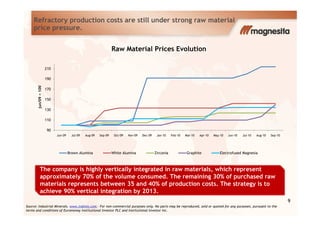
- Magnesita is moving forward with vertical integration of raw materials through expansion of M-30 sinter production and exploitation of graphite deposits. This will increase competitiveness by reducing reliance on imported materials facing price pressures.
- The company continued its global expansion of the CPP refractory solutions model, adding new contracts in various regions. This positions Magnesita as the sole provider of CPP services worldwide.
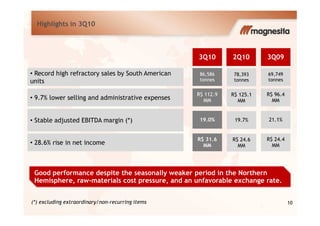
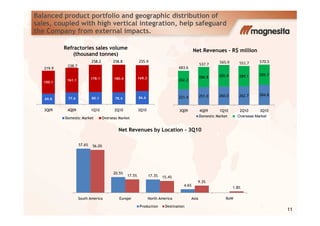
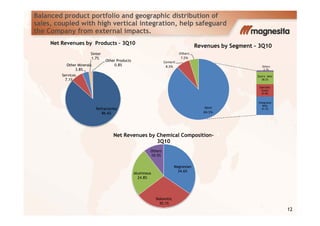
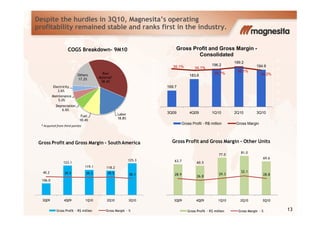
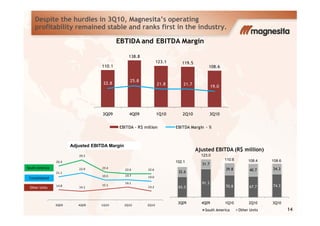
- Despite challenges in 3Q2010 like currency impacts, revenues and profitability remained stable due to the company's balanced portfolio and high vertical integration.