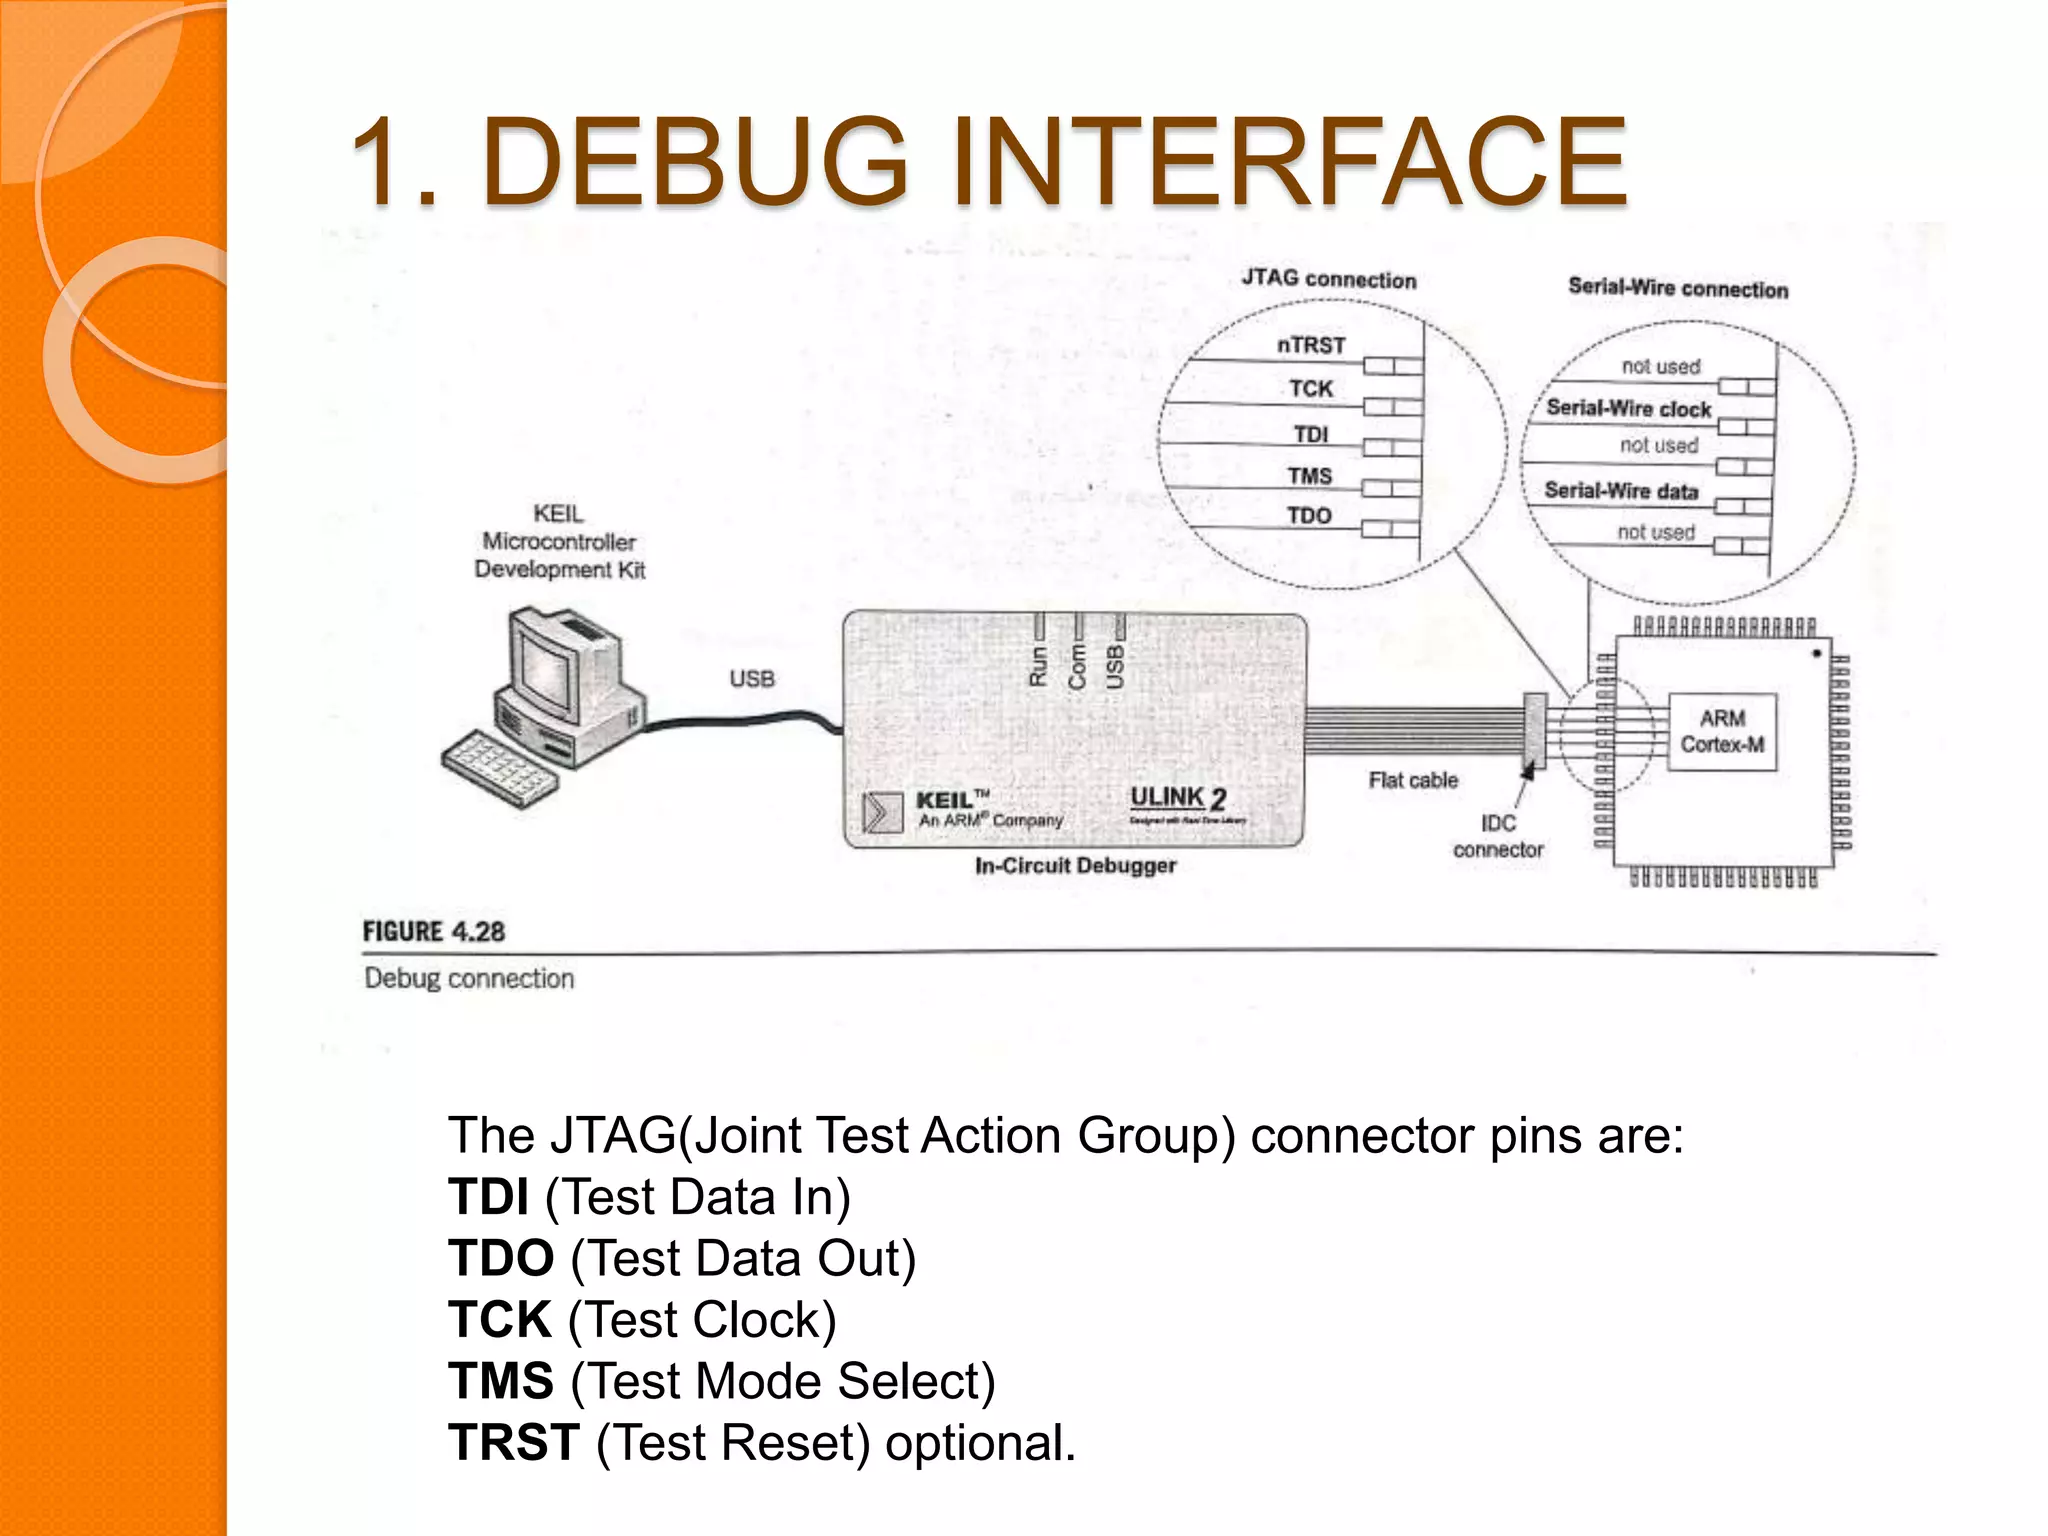
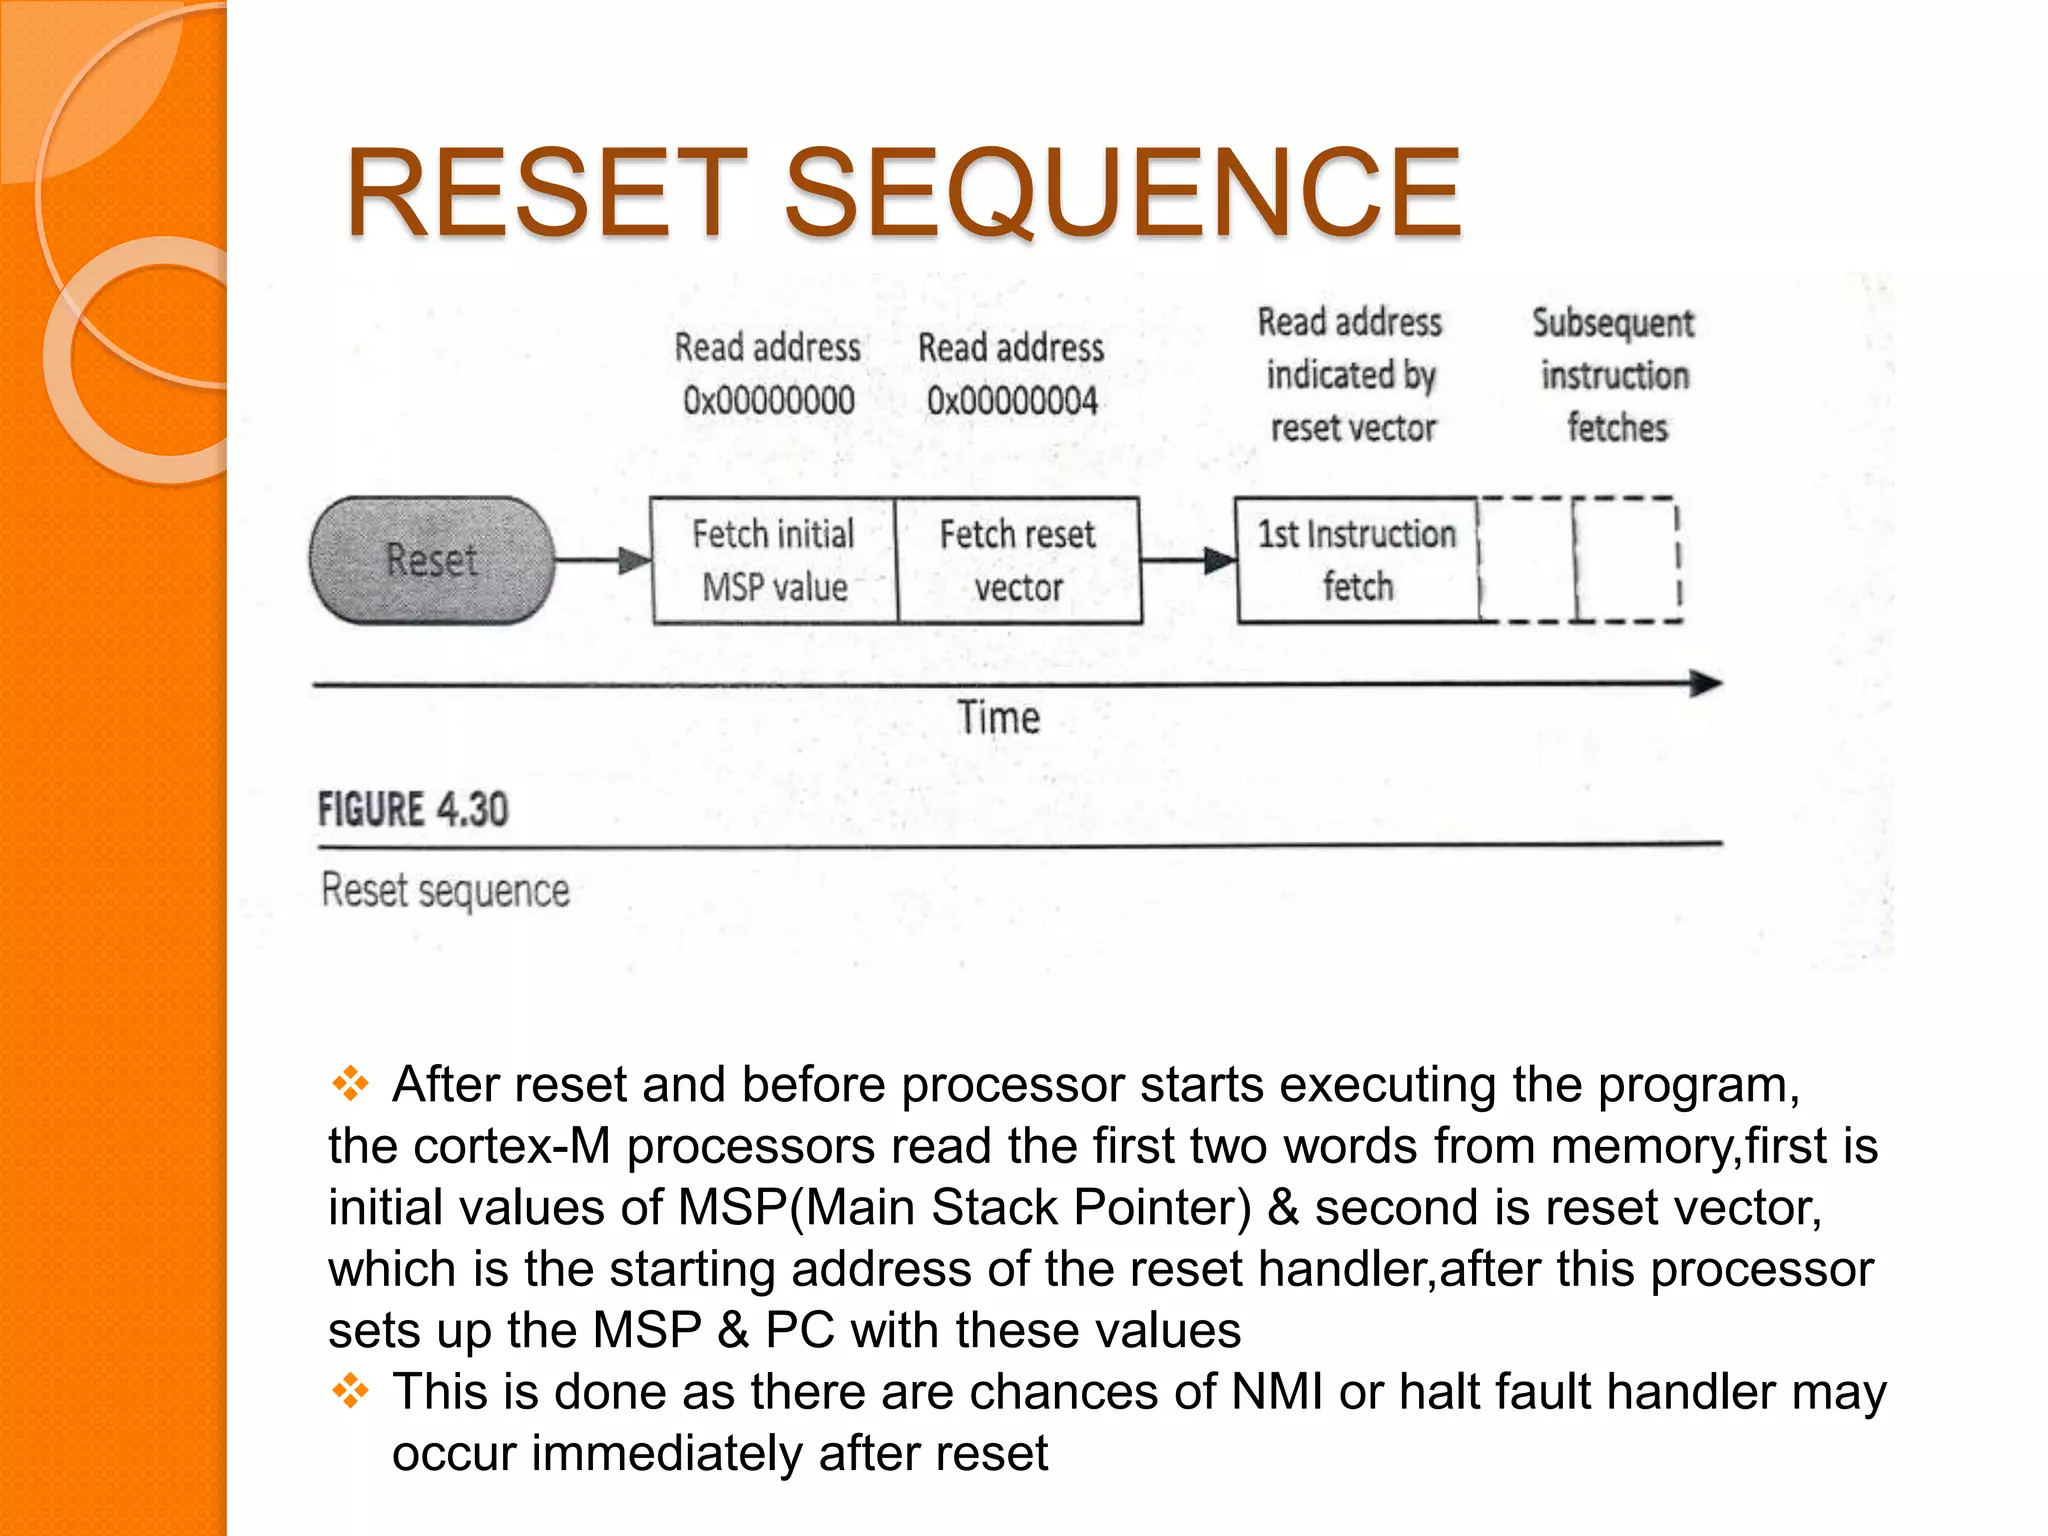
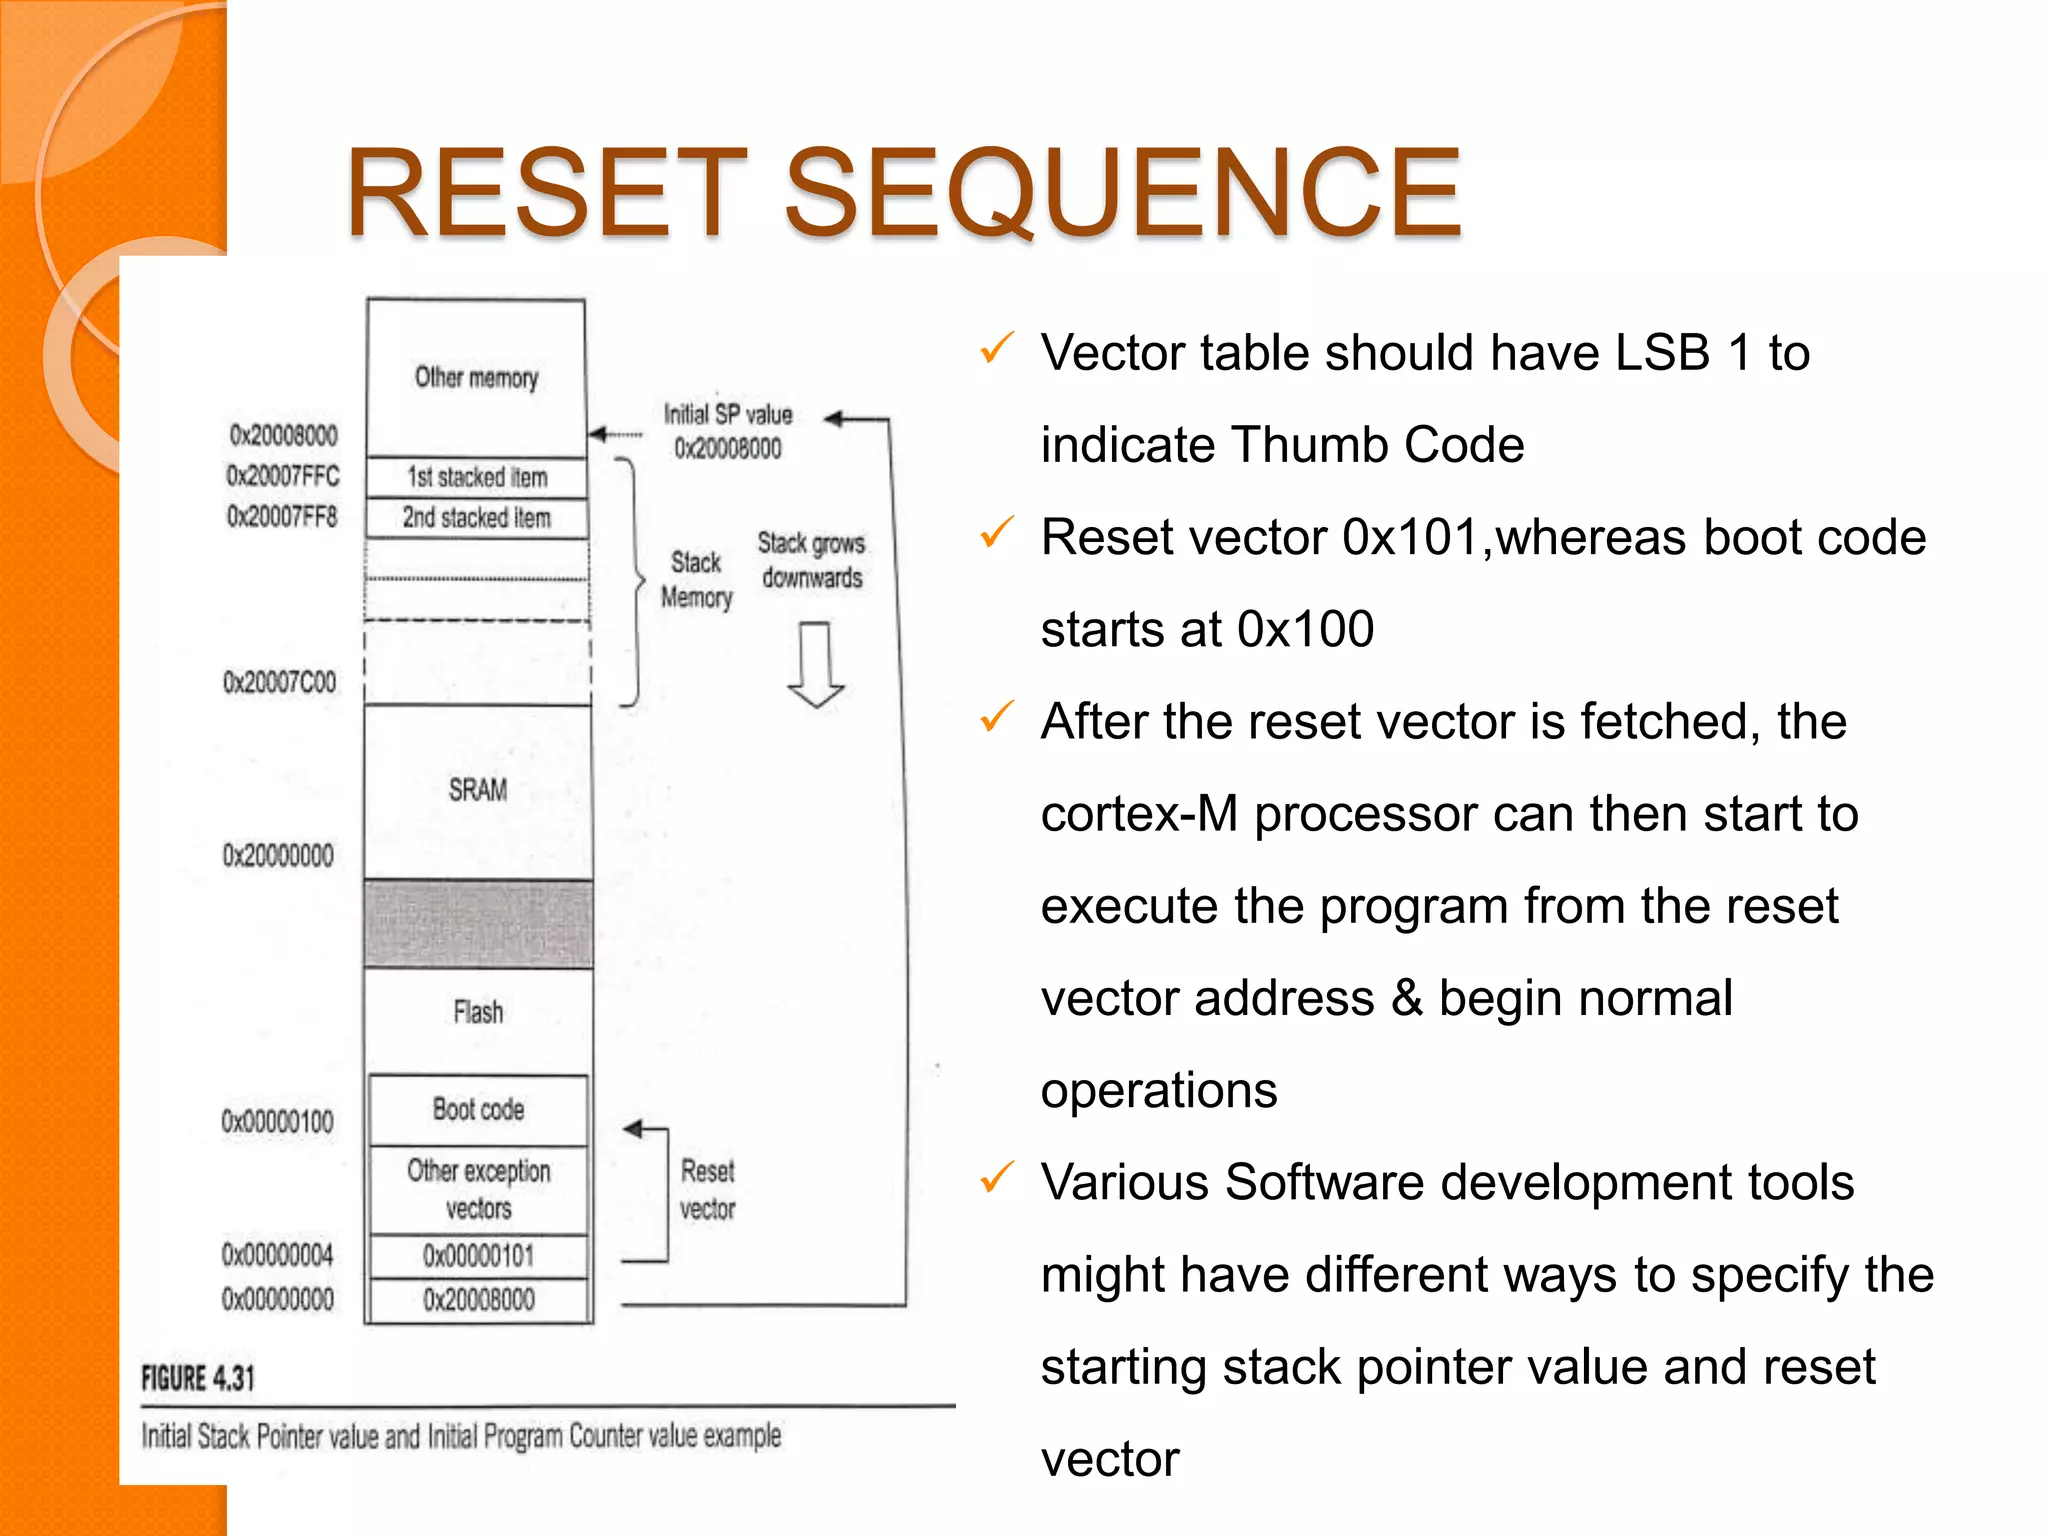
AES SUBJECT SEMINAR
ON
SCB,DEBUG,RESET
Guided By Presented By
Prof : Siddesha K Mrs.Renuka N
Asst. Prof., Dept of E&C 1TU19LVS11
SYSTEM CONTROL BLOCK(SCB)
 SCB provides the implementation information, and system
control. This includes configuration, control & reporting of the
system exceptions.
 SCB is part of the processor that is merged into NVIC(Nested
Vectored Interrupt Controller). SCB is memory mapped, and
can be accessed by using System Control Space.
 Inside SCB there is a register called CPU ID base register,
which is a read only and shows the processor type and revision
number
 Parts of SCB includes
 Control Registers: Control Registers are data registers that
the master processor can modify to configure the I/O
controller(Ex. Low power modes)
 Fault Status Register: Provides fault status information
 VTOR(Vector Table Offset Relocation): The VTOR indicates
the vector table base address from memory address
0x00000000
DEBUG
 Process of identifying the error and correcting
the error is called Debug
 As system complexity increases more featured
debug becomes vital
 Debug includes
halting,stepping,breakpoints,data watch
points,registers &memory accesses, profiling,
& Traces
 Two types of interfaces of Cortex-M Processor
are
1. Debug Interface
1. DEBUG INTERFACE
Debug Interface allows a debug adopter to
connect cortex-M µc to control debug
features & access the memory space on the
chip
 JTAG protocol uses 4 or 5 pins ,where
SWD(Serial Wire Debug) uses 2 pins for
the same opertion
1. DEBUG INTERFACE
The JTAG(Joint Test Action Group) connector pins are:
TDI (Test Data In)
TDO (Test Data Out)
TCK (Test Clock)
TMS (Test Mode Select)
TRST (Test Reset) optional.
2. TRACE INTERFACE
Trace interface is used to collect the
information from processor during the
run time such as data, event, profiling
information or even complete details
of program execution
2 types are
Serial Wire Viewer(SWV)
Trace Protocol(Multipin protocol)
2. TRACE INTERFACE
2. TRACE INTERFACE
 SWV is a low cost solution & the output of SWV is
called as SWO
 Trace Port mode uses many data ports(ususally
4)but one clock port
 The real-time program trace requires a companion
component called Embedded Trace
Macrocell(ETM),provides instruction and data
tracing of a processor. An ETM is an integral part of
an ARM RealView® debug solution.
 Ex for trace interface are Keil-ULINK-2 or segger J-
Link, which capture the data through using SWV
 The data can be displayed on debug window
RESET & RESET
SEQUENCE
A typical Cortex-M Microcontroller supports
3 types of Reset :
 Power on reset: Resets everything
(Processor, debug & Peripherals)
 System reset: Resets only processor &
peripherals, not debug support component
 Processor reset: Reset the processor only
RESET SEQUENCE
 After reset and before processor starts executing the program,
the cortex-M processors read the first two words from memory,first is
initial values of MSP(Main Stack Pointer) & second is reset vector,
which is the starting address of the reset handler,after this processor
sets up the MSP & PC with these values
 This is done as there are chances of NMI or halt fault handler may
occur immediately after reset
RESET SEQUENCE
 Vector table should have LSB 1 to
indicate Thumb Code
 Reset vector 0x101,whereas boot code
starts at 0x100
 After the reset vector is fetched, the
cortex-M processor can then start to
execute the program from the reset
vector address & begin normal
operations
 Various Software development tools
might have different ways to specify the
starting stack pointer value and reset
vector
presentation on SCB,DEBUG,RESET of Arm Cortex processor

presentation on SCB,DEBUG,RESET of Arm Cortex processor

  • 1.
    AES SUBJECT SEMINAR ON SCB,DEBUG,RESET GuidedBy Presented By Prof : Siddesha K Mrs.Renuka N Asst. Prof., Dept of E&C 1TU19LVS11
  • 2.
    SYSTEM CONTROL BLOCK(SCB) SCB provides the implementation information, and system control. This includes configuration, control & reporting of the system exceptions.  SCB is part of the processor that is merged into NVIC(Nested Vectored Interrupt Controller). SCB is memory mapped, and can be accessed by using System Control Space.  Inside SCB there is a register called CPU ID base register, which is a read only and shows the processor type and revision number  Parts of SCB includes  Control Registers: Control Registers are data registers that the master processor can modify to configure the I/O controller(Ex. Low power modes)  Fault Status Register: Provides fault status information  VTOR(Vector Table Offset Relocation): The VTOR indicates the vector table base address from memory address 0x00000000
  • 3.
    DEBUG  Process ofidentifying the error and correcting the error is called Debug  As system complexity increases more featured debug becomes vital  Debug includes halting,stepping,breakpoints,data watch points,registers &memory accesses, profiling, & Traces  Two types of interfaces of Cortex-M Processor are 1. Debug Interface
  • 4.
    1. DEBUG INTERFACE DebugInterface allows a debug adopter to connect cortex-M µc to control debug features & access the memory space on the chip  JTAG protocol uses 4 or 5 pins ,where SWD(Serial Wire Debug) uses 2 pins for the same opertion
  • 5.
    1. DEBUG INTERFACE TheJTAG(Joint Test Action Group) connector pins are: TDI (Test Data In) TDO (Test Data Out) TCK (Test Clock) TMS (Test Mode Select) TRST (Test Reset) optional.
  • 6.
    2. TRACE INTERFACE Traceinterface is used to collect the information from processor during the run time such as data, event, profiling information or even complete details of program execution 2 types are Serial Wire Viewer(SWV) Trace Protocol(Multipin protocol)
  • 7.
  • 8.
    2. TRACE INTERFACE SWV is a low cost solution & the output of SWV is called as SWO  Trace Port mode uses many data ports(ususally 4)but one clock port  The real-time program trace requires a companion component called Embedded Trace Macrocell(ETM),provides instruction and data tracing of a processor. An ETM is an integral part of an ARM RealView® debug solution.  Ex for trace interface are Keil-ULINK-2 or segger J- Link, which capture the data through using SWV  The data can be displayed on debug window
  • 9.
    RESET & RESET SEQUENCE Atypical Cortex-M Microcontroller supports 3 types of Reset :  Power on reset: Resets everything (Processor, debug & Peripherals)  System reset: Resets only processor & peripherals, not debug support component  Processor reset: Reset the processor only
  • 10.
    RESET SEQUENCE  Afterreset and before processor starts executing the program, the cortex-M processors read the first two words from memory,first is initial values of MSP(Main Stack Pointer) & second is reset vector, which is the starting address of the reset handler,after this processor sets up the MSP & PC with these values  This is done as there are chances of NMI or halt fault handler may occur immediately after reset
  • 11.
    RESET SEQUENCE  Vectortable should have LSB 1 to indicate Thumb Code  Reset vector 0x101,whereas boot code starts at 0x100  After the reset vector is fetched, the cortex-M processor can then start to execute the program from the reset vector address & begin normal operations  Various Software development tools might have different ways to specify the starting stack pointer value and reset vector