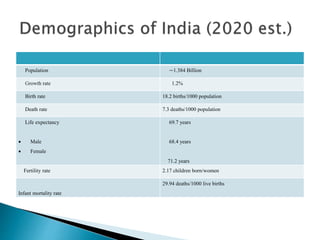
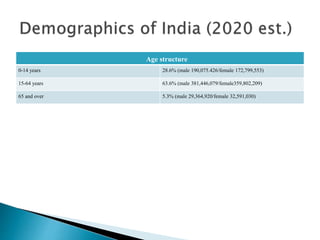
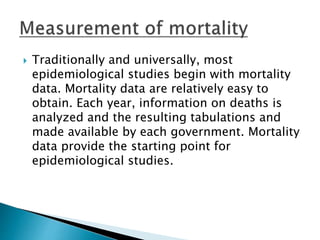
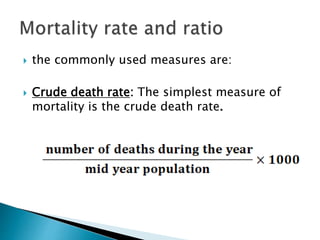
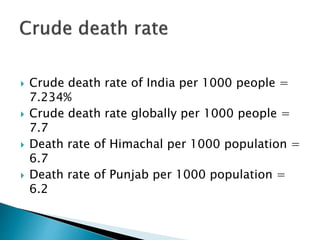
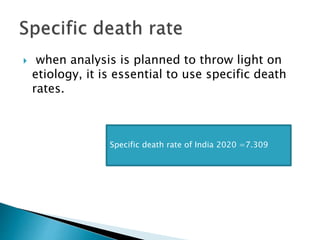
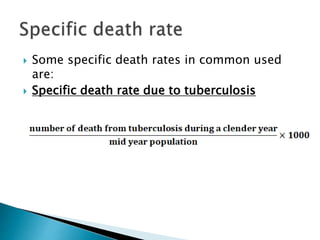
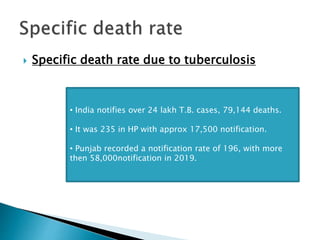
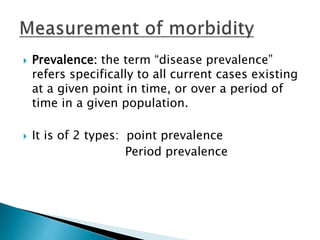
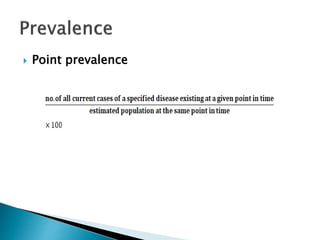
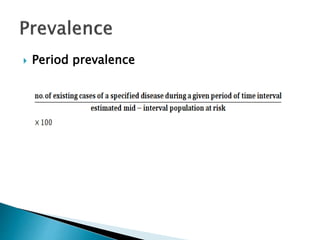
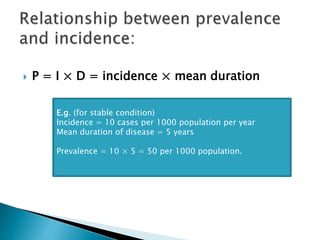
Presented by: Sonali Katoch
 Mortality rate: The number of death in a given
area or period, or from a particular cause.
 Morbidity rate: Measures the portion of
people in a specific geographical location
who contracted a particular disease during a
specific period of time. It indicates the
frequency of the disease appearing in a
population.
 India is the second most populated country
in the world with nearly a fifth of the world’s
population. According to the 2019 revision of
the world population prospects the
population stood at 1,352,642,280.
Population ⁓1.384 Billion
Growth rate 1.2%
Birth rate 18.2 births/1000 population
Death rate 7.3 deaths/1000 population
Life expectancy
 Male
 Female
69.7 years
68.4 years
71.2 years
Fertility rate 2.17 children born/women
Infant mortality rate
29.94 deaths/1000 live births
Age structure
0-14 years 28.6% (male 190,075.426/female 172,799,553)
15-64 years 63.6% (male 381,446,079/female359,802,209)
65 and over 5.3% (male 29,364,920/female 32,591,030)
 Traditionally and universally, most
epidemiological studies begin with mortality
data. Mortality data are relatively easy to
obtain. Each year, information on deaths is
analyzed and the resulting tabulations and
made available by each government. Mortality
data provide the starting point for
epidemiological studies.
 the commonly used measures are:
 Crude death rate: The simplest measure of
mortality is the crude death rate.
 Crude death rate of India per 1000 people =
7.234%
 Crude death rate globally per 1000 people =
7.7
 Death rate of Himachal per 1000 population =
6.7
 Death rate of Punjab per 1000 population =
6.2
 when analysis is planned to throw light on
etiology, it is essential to use specific death
rates.
Specific death rate of India 2020 =7.309
 Some specific death rates in common used
are:
 Specific death rate due to tuberculosis
• India notifies over 24 lakh T.B. cases, 79,144 deaths.
• It was 235 in HP with approx 17,500 notification.
• Punjab recorded a notification rate of 196, with more
then 58,000notification in 2019.
 Specific death rate of male
Mortality rate for men was at 203.63 per 1000 male
adult in India. While foe women it was 147.16 per
1000female adults.
 Specific death rate in age group 15-20 years
Death rate in age group 15-20 years in India =
63.6% (male 203.62 per 1000 and female 147.16
per 1000)
Death rate of person per 100 population (15 – 59
years of age) in HP = 2.6
 Case fatality rate
E.g. COVID-19
In India- overall deaths due to infection remain at 1.5% of
total confirmed cases.
(Till Monday, India recorded 109856 deaths due to covid-
19, where as total confirmed cases of infection stood at
7175880).
In HP- fatality rate was 1.2%.
In Punjab- fatality rate was 3%
 It is sometime useful to know what
proportions of total deaths are due to a
particular cause or what proportions of
deaths are occurring in a particular age
group.
 Proportional mortality from a specific disease
 under-5 proportionate mortality rate
• India’s under-5 mortality rate = 34.3% deaths per
1000 live birth.
• Under-5 mortality rate of HP = 46 deaths per
1000 live birth.
• Under-5 mortality rate of Punjab =23% deaths per
1000 live birth.
 Proportional mortality rate for aged 50 years
and above
• India’s mortality rate for aged 50y and above =
5.3%
• Mortality rate for age 50y and above of HP = 41
 It is the proportion of survivors in a group,
studies and followed over a period.
 Morbidity has been defined as “any
department, subjective or objective, from a
state of physiological well-being”. The term is
used equivalent to such terms as sickness,
illness, disability etc.
 Incidence: defined as the no. of new cases
occurring in defined population during a
specified period of time.
E.g. if there had been 500 new cases of an illness in
a population of 30,000 in a year, the incidence rate
would be:
= 500/30000×1000 = 16.7
per 1000 per year.
 Prevalence: the term “disease prevalence”
refers specifically to all current cases existing
at a given point in time, or over a period of
time in a given population.
 It is of 2 types: point prevalence
Period prevalence
 Point prevalence
 Period prevalence
 P = I × D = incidence × mean duration
E.g. (for stable condition)
Incidence = 10 cases per 1000 population per year
Mean duration of disease = 5 years
Prevalence = 10 × 5 = 50 per 1000 population.
 Two measures which are generally used for
epidemiological surveillance are mortality and
morbidity. These measures describe the
progression and severity of the given health
events.
 The mortality and morbidity are often
related, but not identical. Mortality is the
state of being unhealthy for a particular
disease or situation, whereas, mortality is the
number of deaths that occur in a population.
 Mortality is the condition of being mortal, or
susceptible to death; the opposite of
immortality.
 Morbidity relates to disease states, although
mortality relates to death. Both terms are
generally used in health and death related
statistics.
presentation on mortality and morbidity rate.

presentation on mortality and morbidity rate.

  • 1.
  • 2.
     Mortality rate:The number of death in a given area or period, or from a particular cause.  Morbidity rate: Measures the portion of people in a specific geographical location who contracted a particular disease during a specific period of time. It indicates the frequency of the disease appearing in a population.
  • 3.
     India isthe second most populated country in the world with nearly a fifth of the world’s population. According to the 2019 revision of the world population prospects the population stood at 1,352,642,280.
  • 4.
    Population ⁓1.384 Billion Growthrate 1.2% Birth rate 18.2 births/1000 population Death rate 7.3 deaths/1000 population Life expectancy  Male  Female 69.7 years 68.4 years 71.2 years Fertility rate 2.17 children born/women Infant mortality rate 29.94 deaths/1000 live births
  • 5.
    Age structure 0-14 years28.6% (male 190,075.426/female 172,799,553) 15-64 years 63.6% (male 381,446,079/female359,802,209) 65 and over 5.3% (male 29,364,920/female 32,591,030)
  • 6.
     Traditionally anduniversally, most epidemiological studies begin with mortality data. Mortality data are relatively easy to obtain. Each year, information on deaths is analyzed and the resulting tabulations and made available by each government. Mortality data provide the starting point for epidemiological studies.
  • 7.
     the commonlyused measures are:  Crude death rate: The simplest measure of mortality is the crude death rate.
  • 8.
     Crude deathrate of India per 1000 people = 7.234%  Crude death rate globally per 1000 people = 7.7  Death rate of Himachal per 1000 population = 6.7  Death rate of Punjab per 1000 population = 6.2
  • 9.
     when analysisis planned to throw light on etiology, it is essential to use specific death rates. Specific death rate of India 2020 =7.309
  • 10.
     Some specificdeath rates in common used are:  Specific death rate due to tuberculosis
  • 11.
     Specific deathrate due to tuberculosis • India notifies over 24 lakh T.B. cases, 79,144 deaths. • It was 235 in HP with approx 17,500 notification. • Punjab recorded a notification rate of 196, with more then 58,000notification in 2019.
  • 12.
     Specific deathrate of male Mortality rate for men was at 203.63 per 1000 male adult in India. While foe women it was 147.16 per 1000female adults.
  • 13.
     Specific deathrate in age group 15-20 years Death rate in age group 15-20 years in India = 63.6% (male 203.62 per 1000 and female 147.16 per 1000) Death rate of person per 100 population (15 – 59 years of age) in HP = 2.6
  • 14.
     Case fatalityrate E.g. COVID-19 In India- overall deaths due to infection remain at 1.5% of total confirmed cases. (Till Monday, India recorded 109856 deaths due to covid- 19, where as total confirmed cases of infection stood at 7175880). In HP- fatality rate was 1.2%. In Punjab- fatality rate was 3%
  • 15.
     It issometime useful to know what proportions of total deaths are due to a particular cause or what proportions of deaths are occurring in a particular age group.  Proportional mortality from a specific disease
  • 16.
     under-5 proportionatemortality rate • India’s under-5 mortality rate = 34.3% deaths per 1000 live birth. • Under-5 mortality rate of HP = 46 deaths per 1000 live birth. • Under-5 mortality rate of Punjab =23% deaths per 1000 live birth.
  • 17.
     Proportional mortalityrate for aged 50 years and above • India’s mortality rate for aged 50y and above = 5.3% • Mortality rate for age 50y and above of HP = 41
  • 18.
     It isthe proportion of survivors in a group, studies and followed over a period.
  • 19.
     Morbidity hasbeen defined as “any department, subjective or objective, from a state of physiological well-being”. The term is used equivalent to such terms as sickness, illness, disability etc.
  • 20.
     Incidence: definedas the no. of new cases occurring in defined population during a specified period of time. E.g. if there had been 500 new cases of an illness in a population of 30,000 in a year, the incidence rate would be: = 500/30000×1000 = 16.7 per 1000 per year.
  • 21.
     Prevalence: theterm “disease prevalence” refers specifically to all current cases existing at a given point in time, or over a period of time in a given population.  It is of 2 types: point prevalence Period prevalence
  • 22.
  • 23.
  • 24.
     P =I × D = incidence × mean duration E.g. (for stable condition) Incidence = 10 cases per 1000 population per year Mean duration of disease = 5 years Prevalence = 10 × 5 = 50 per 1000 population.
  • 25.
     Two measureswhich are generally used for epidemiological surveillance are mortality and morbidity. These measures describe the progression and severity of the given health events.  The mortality and morbidity are often related, but not identical. Mortality is the state of being unhealthy for a particular disease or situation, whereas, mortality is the number of deaths that occur in a population.
  • 26.
     Mortality isthe condition of being mortal, or susceptible to death; the opposite of immortality.  Morbidity relates to disease states, although mortality relates to death. Both terms are generally used in health and death related statistics.