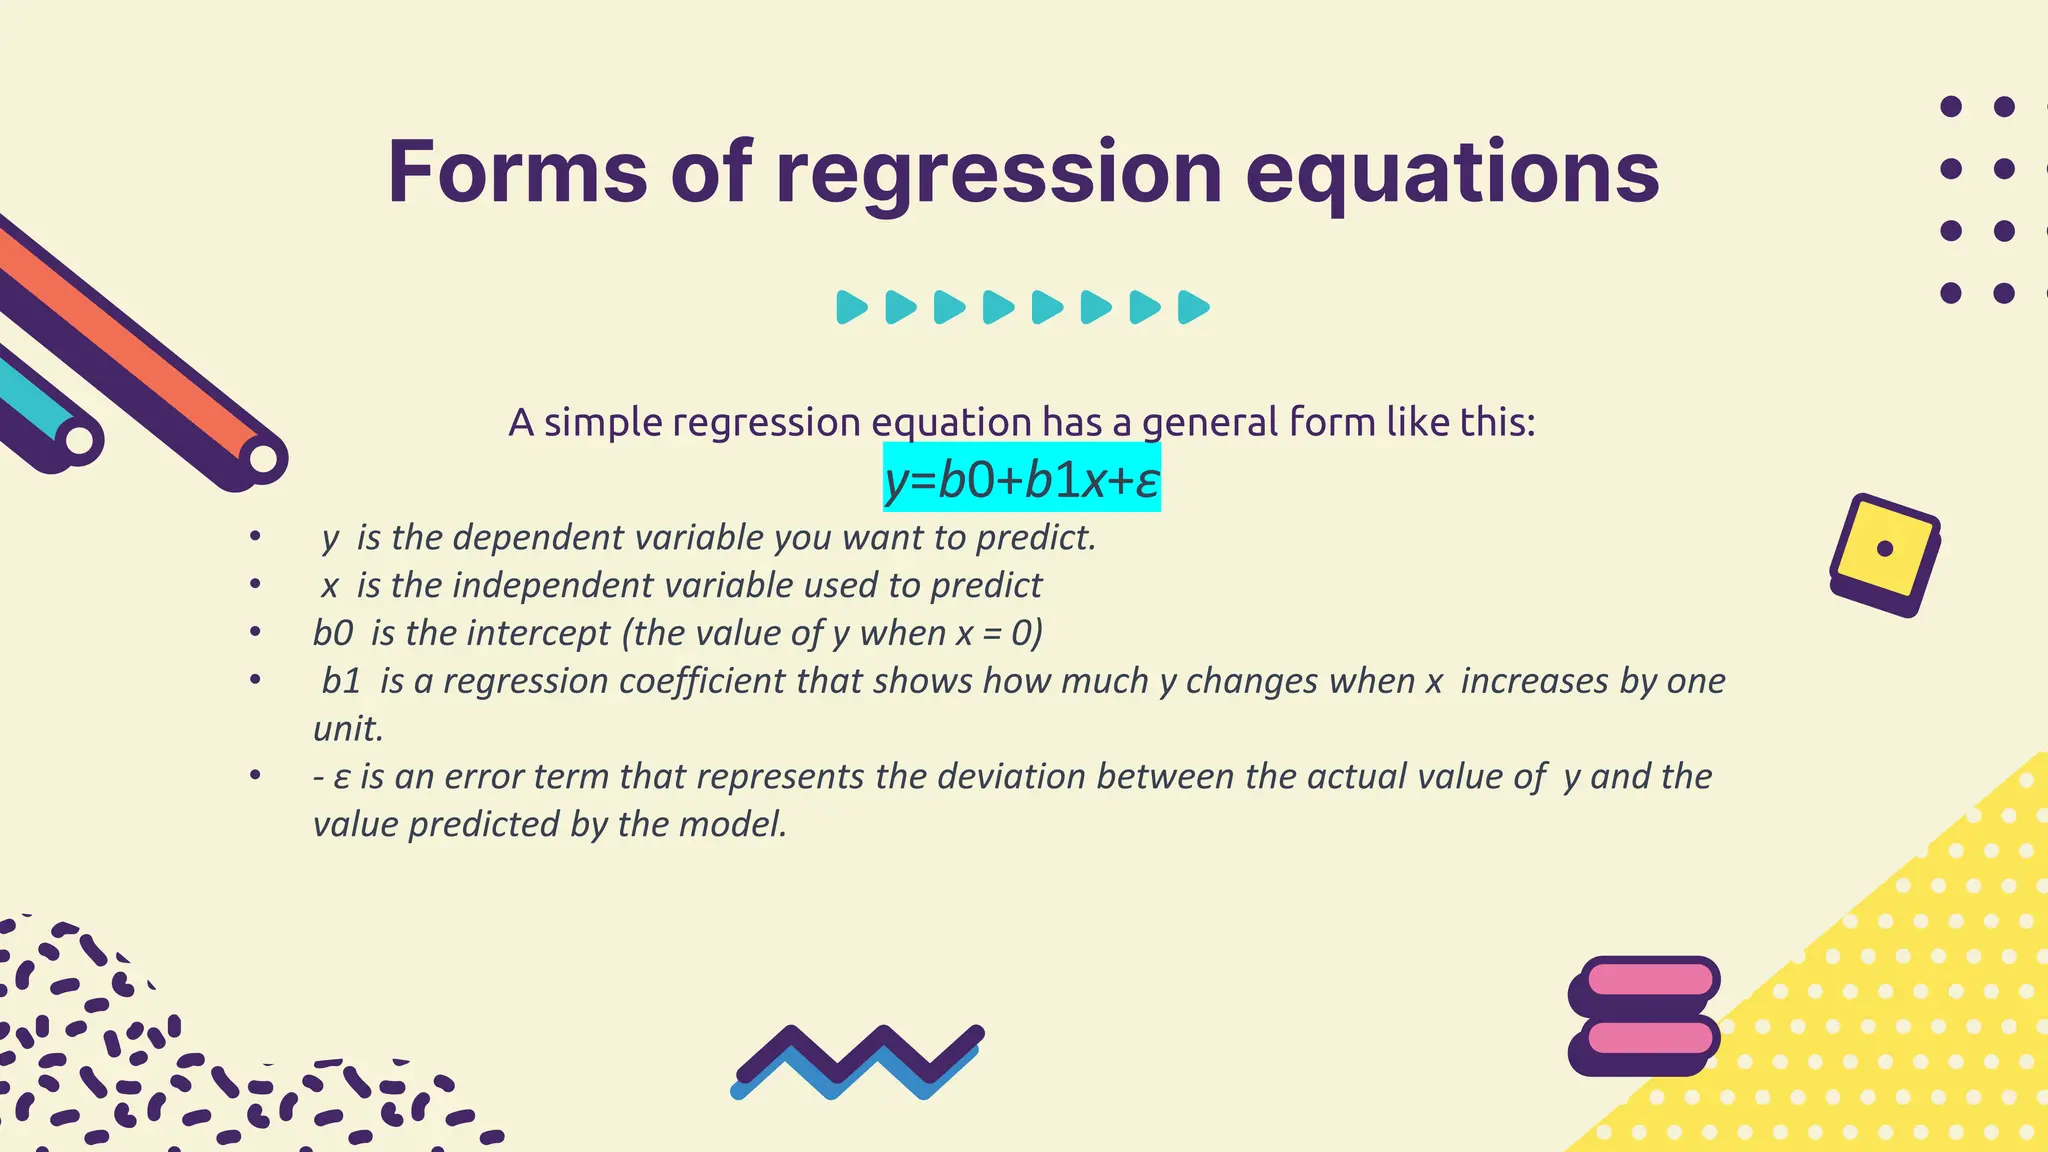
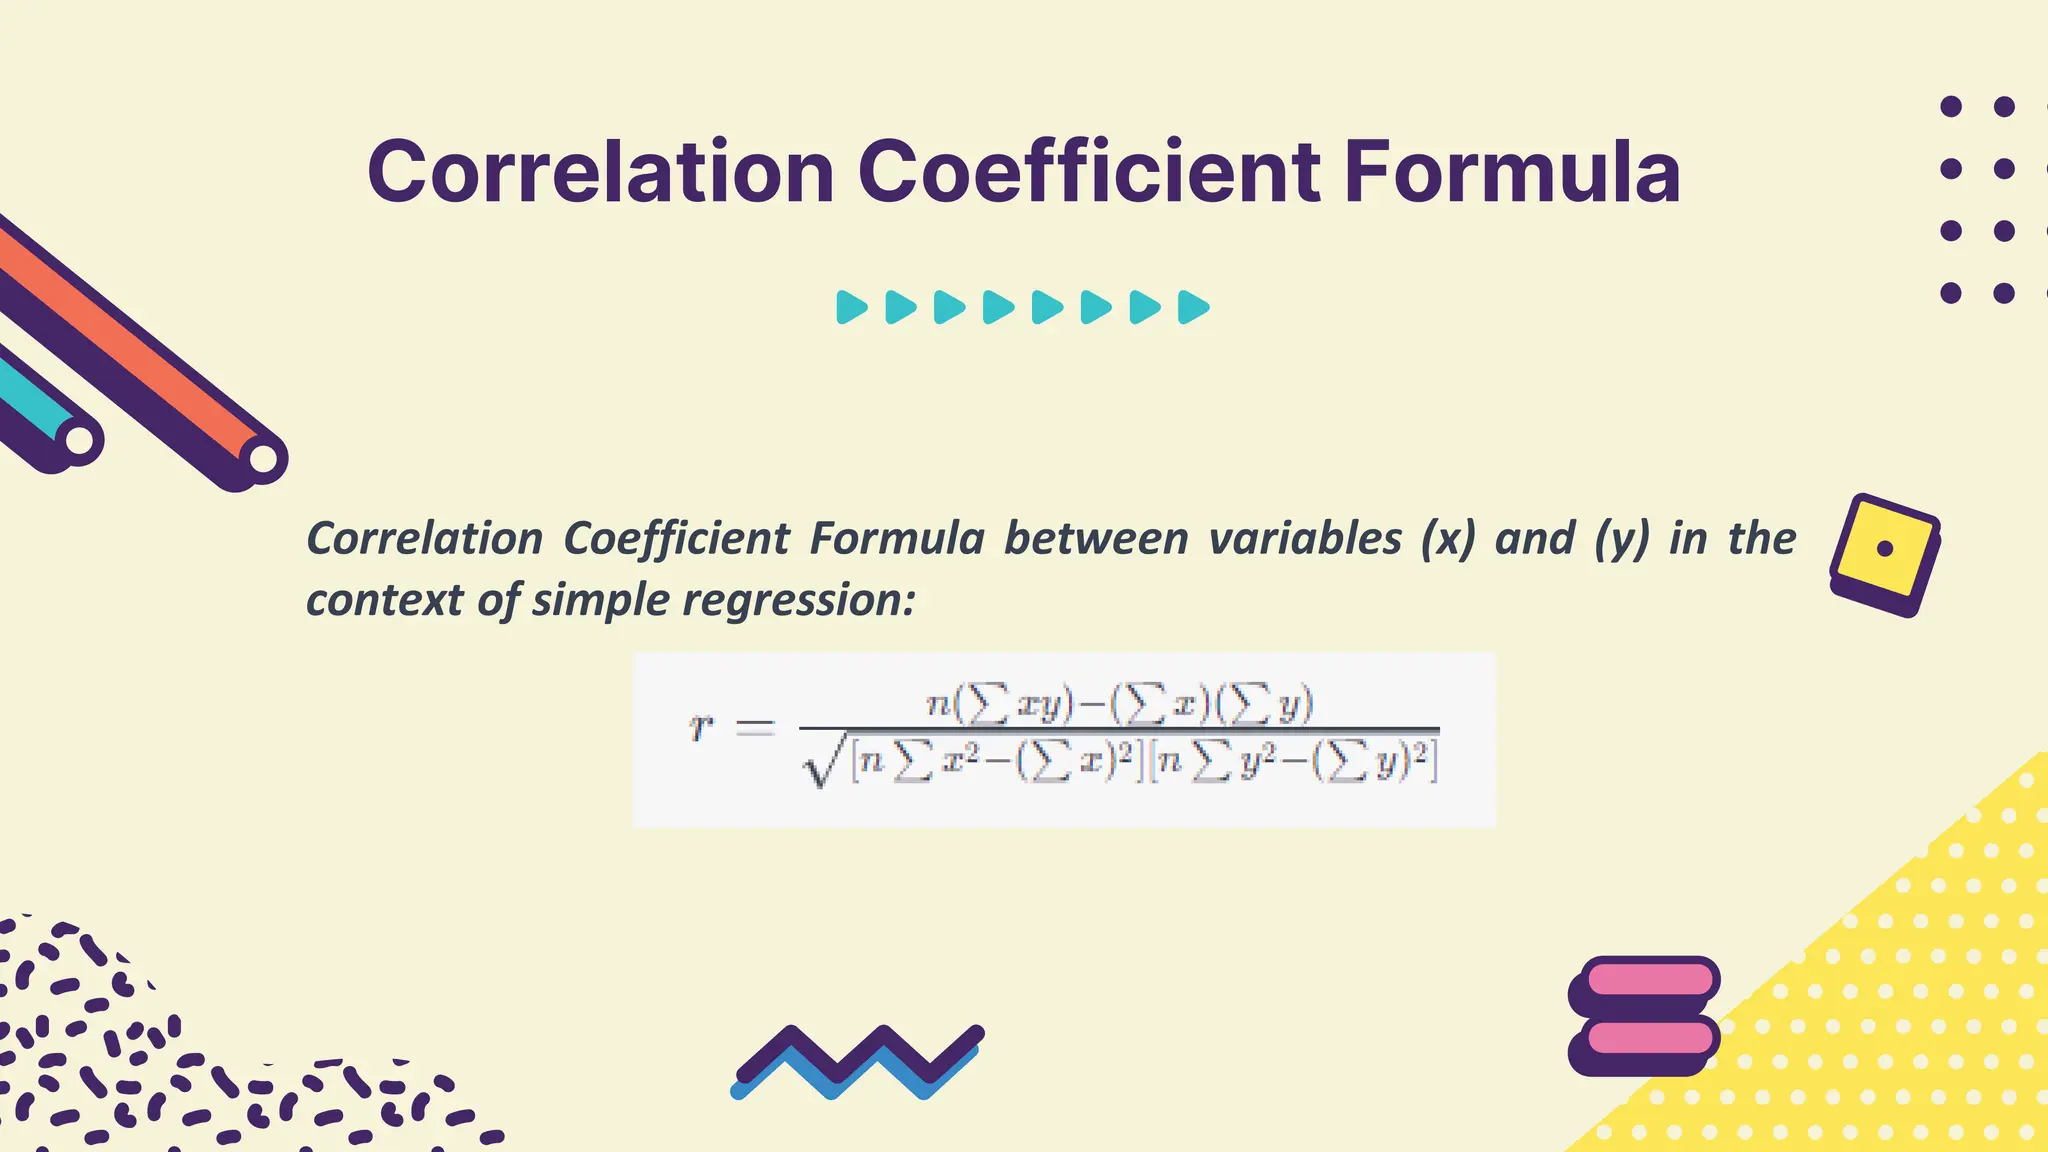
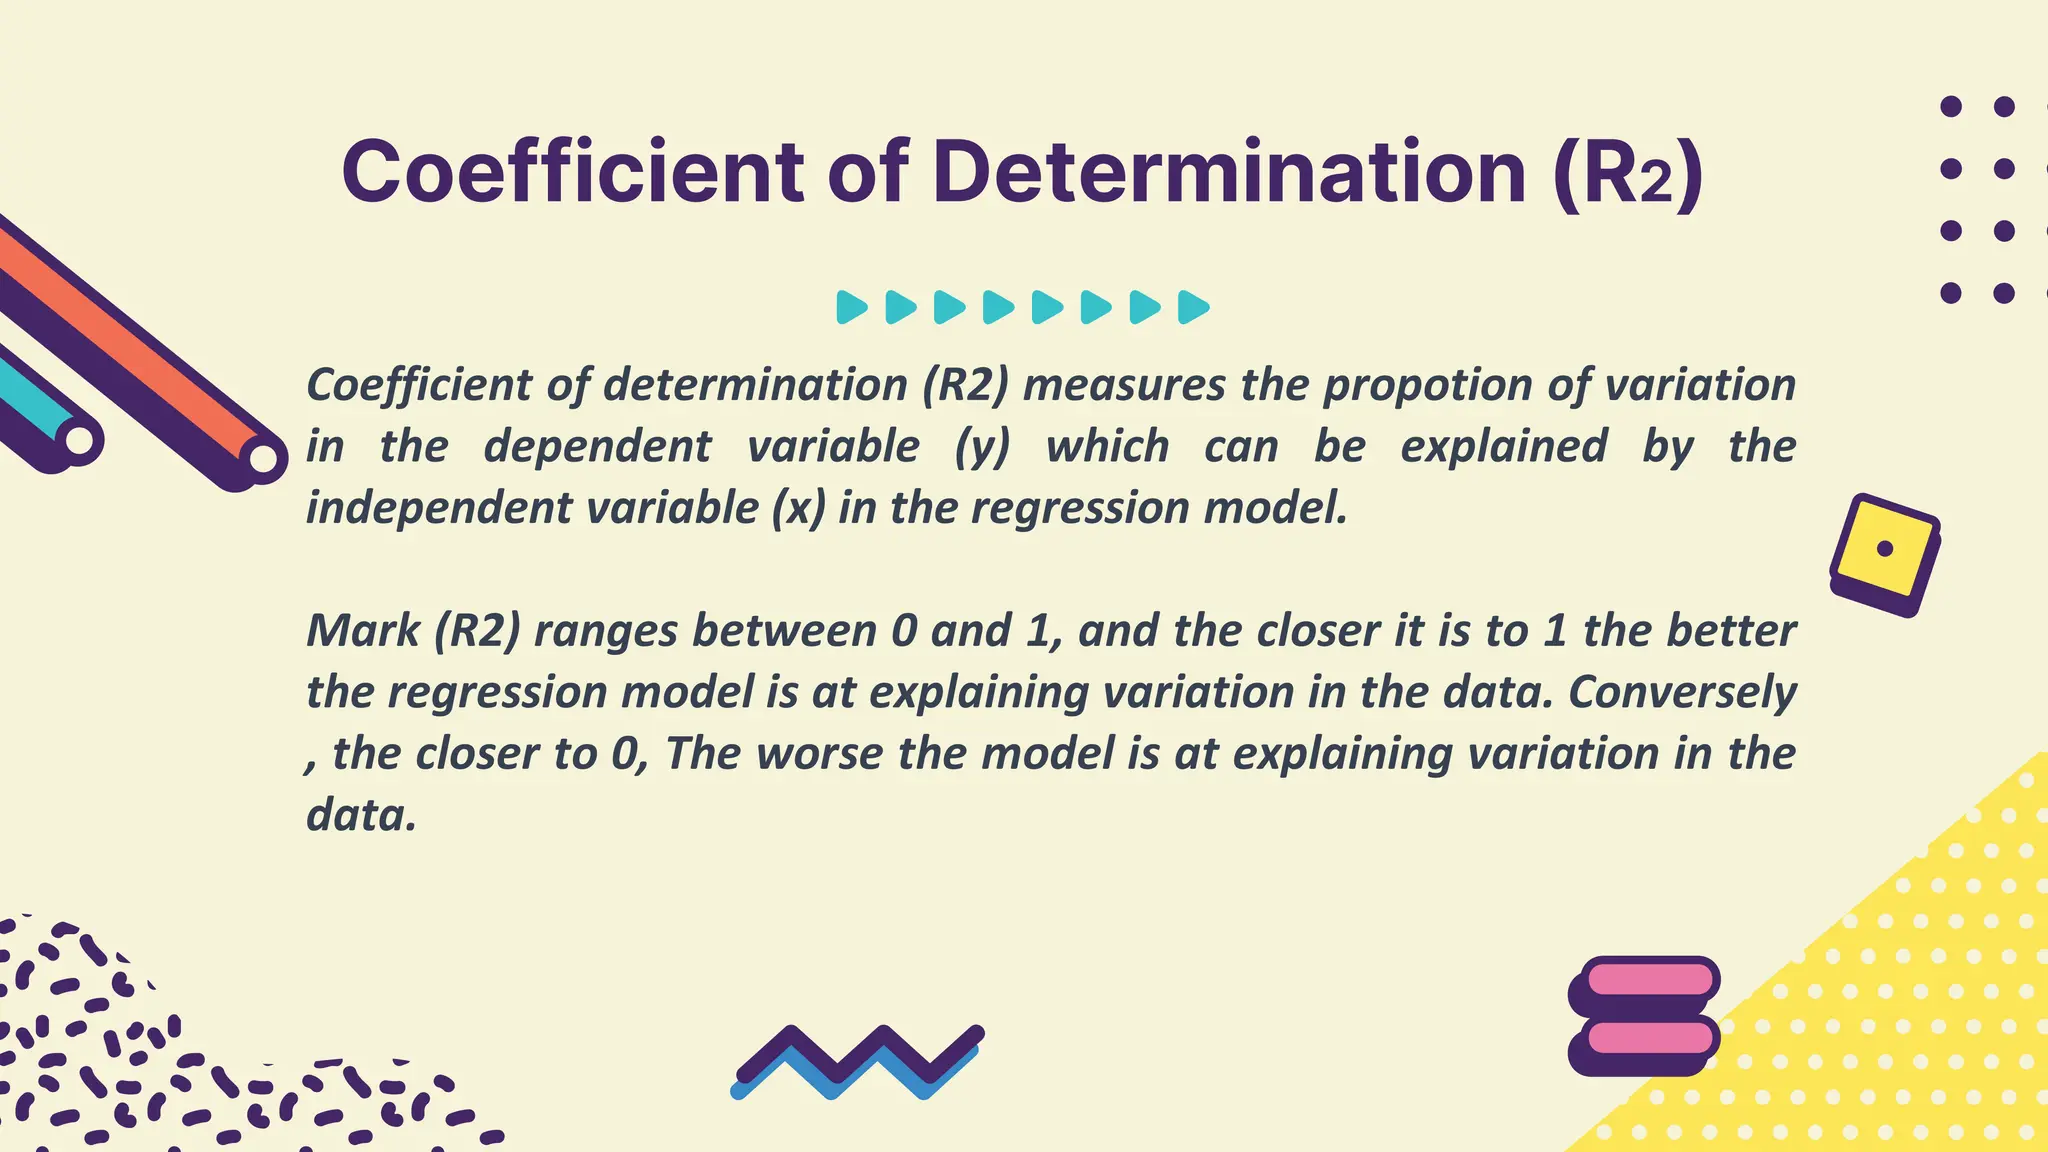
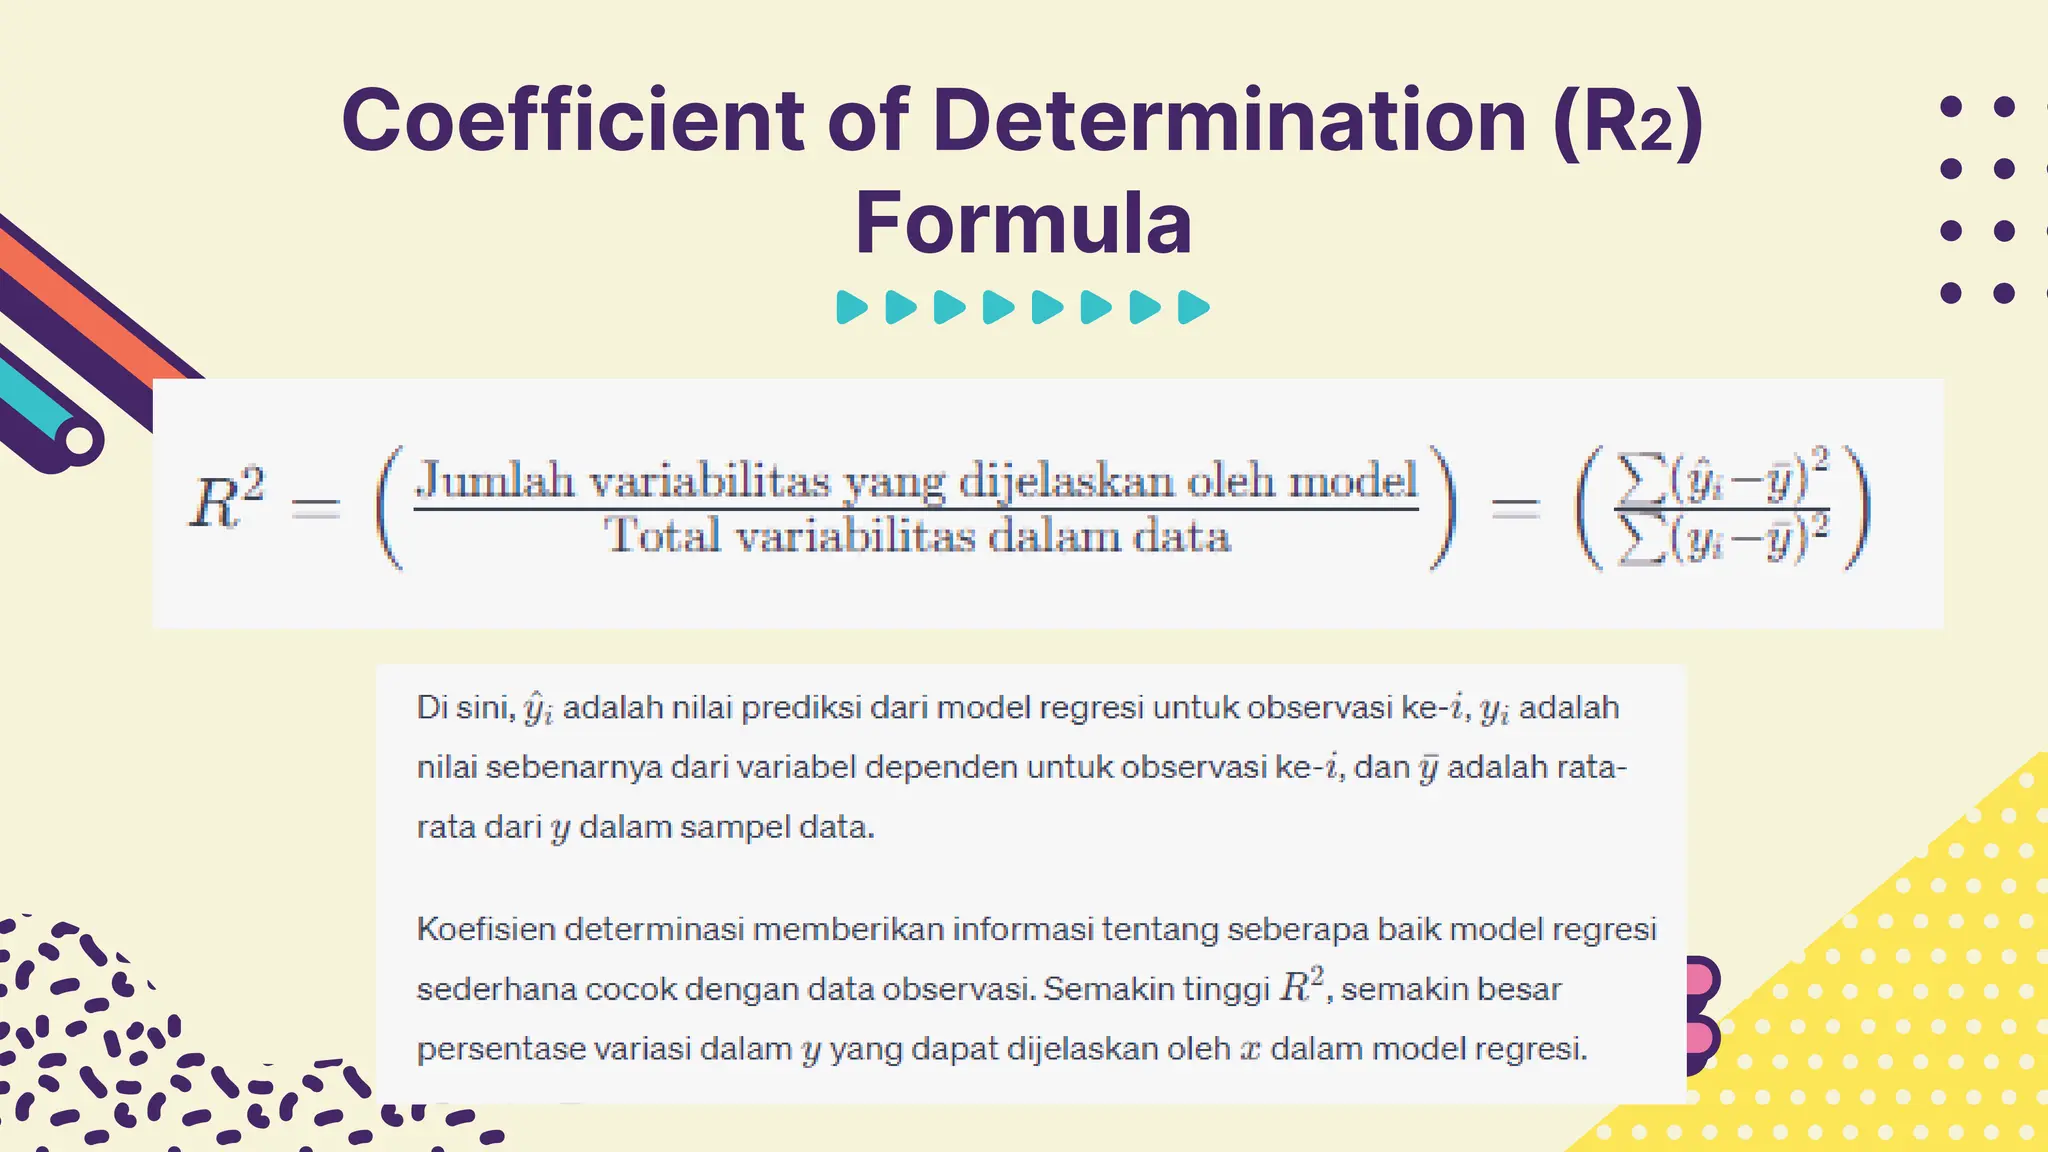
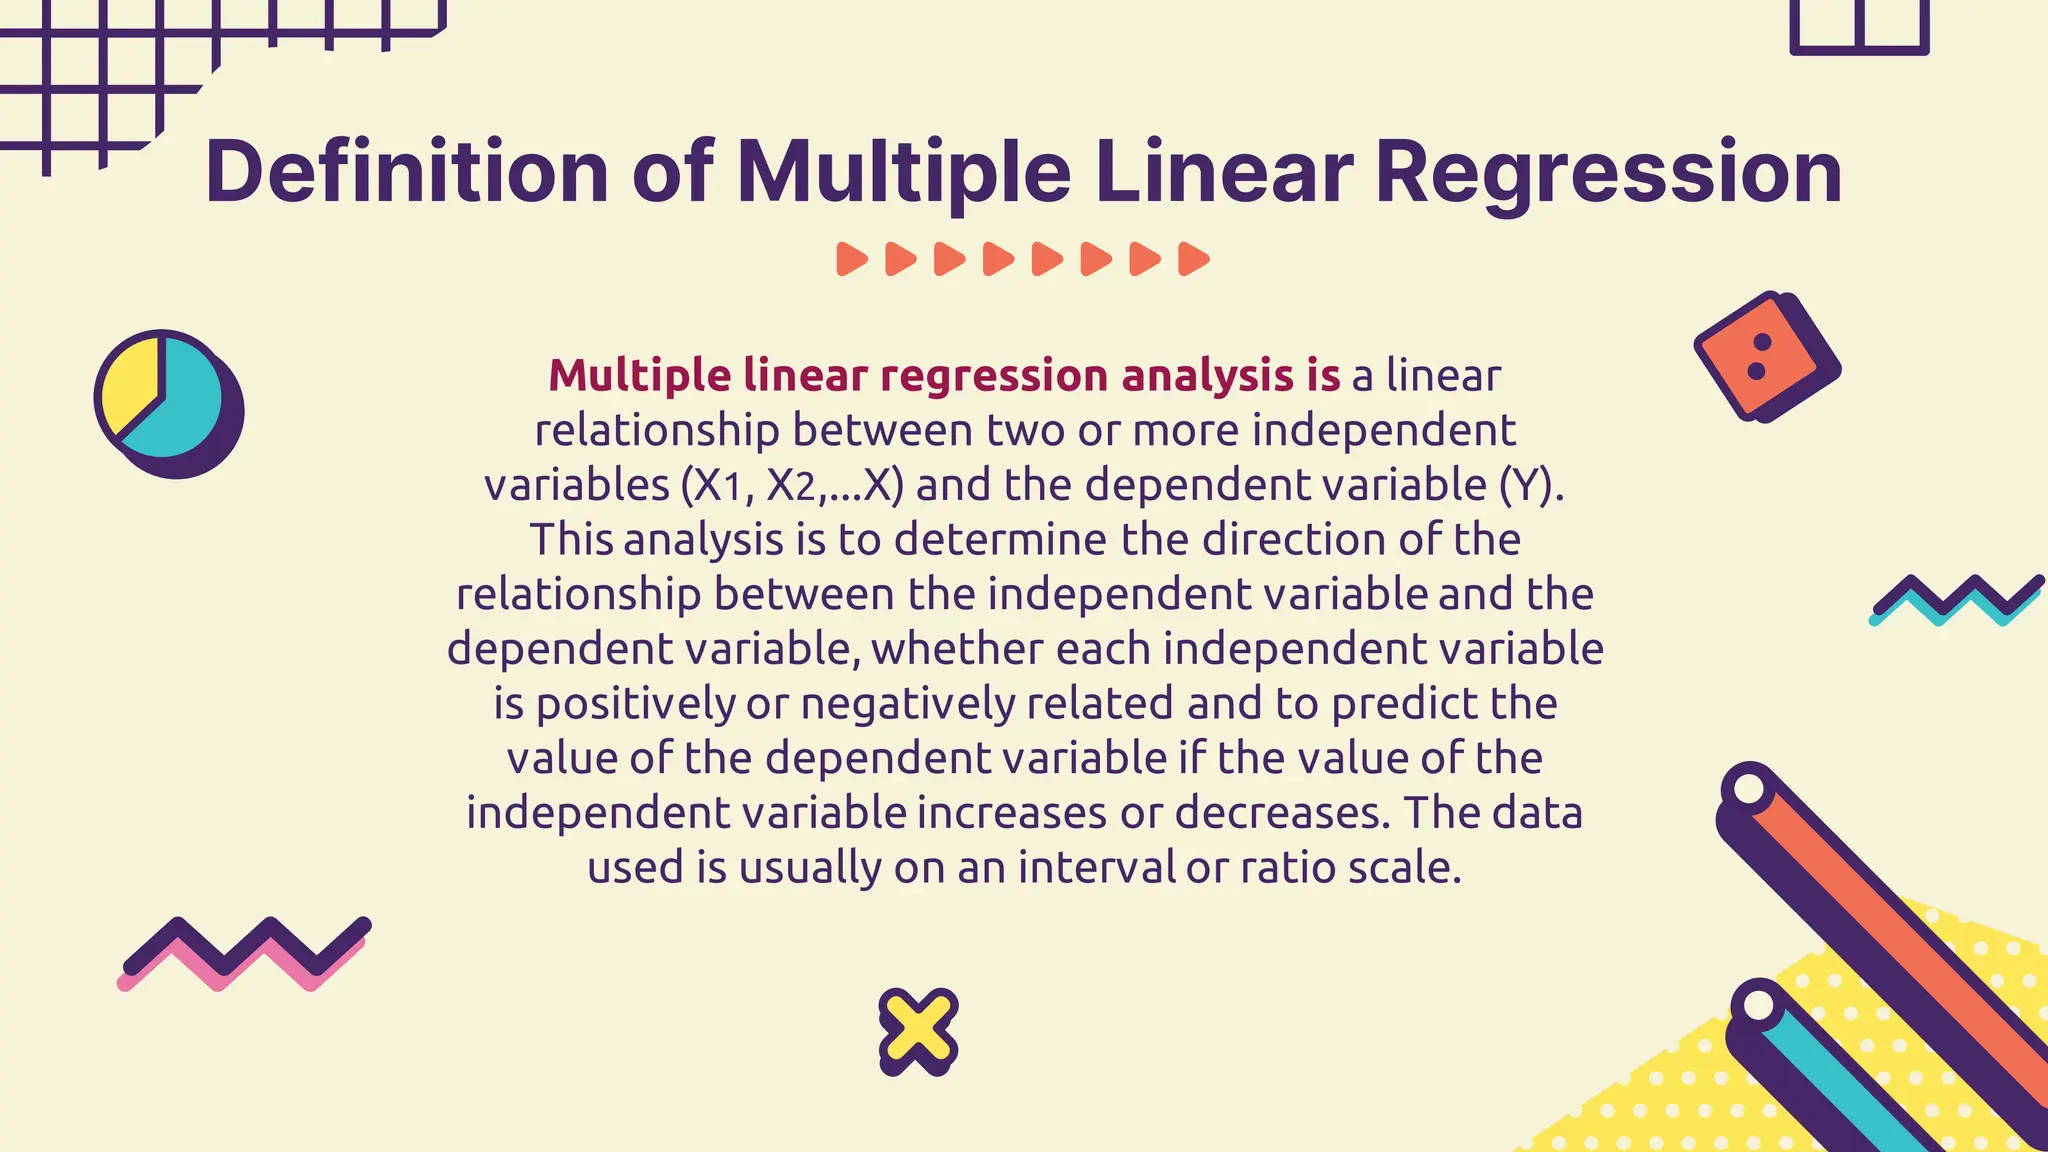
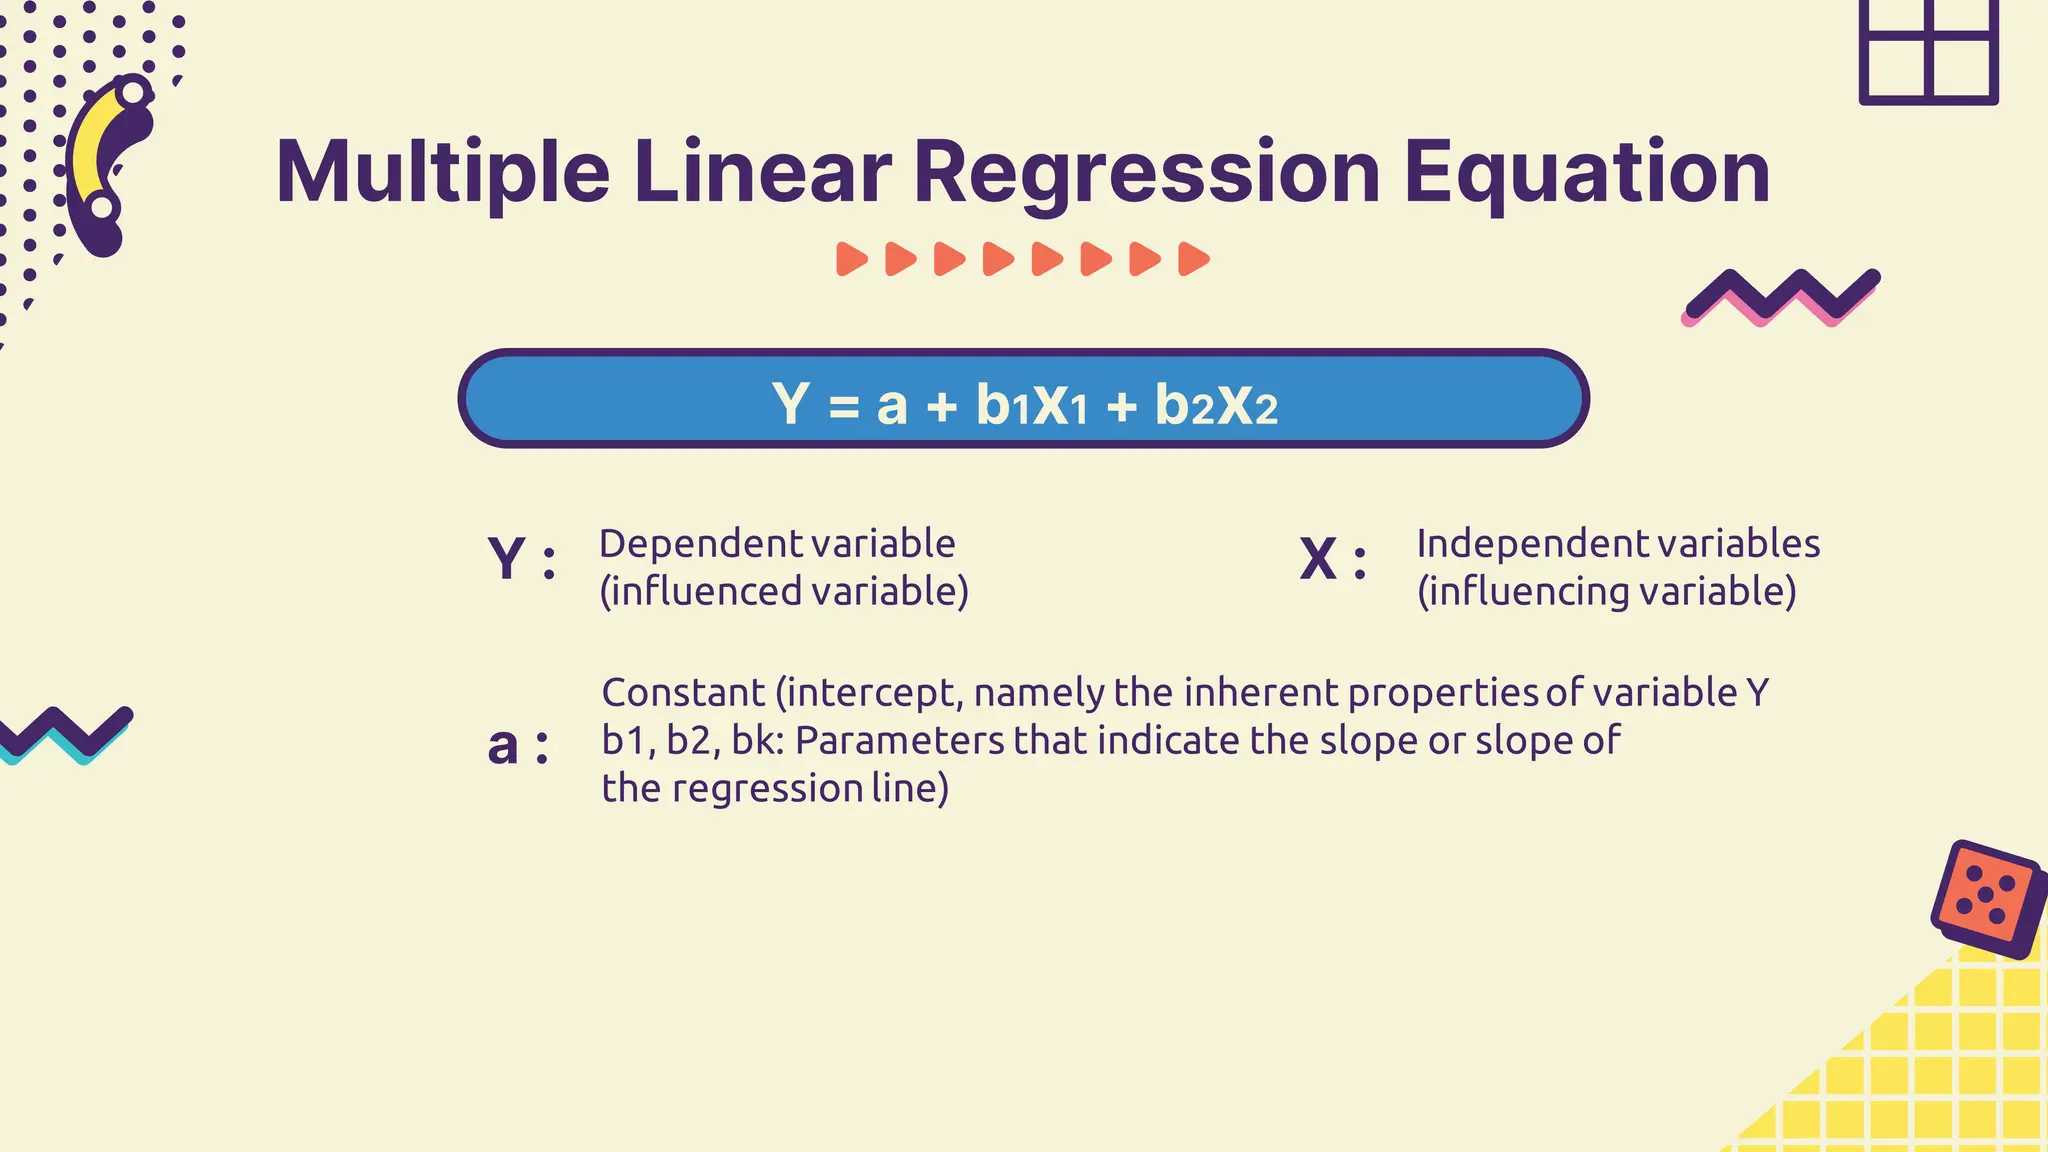
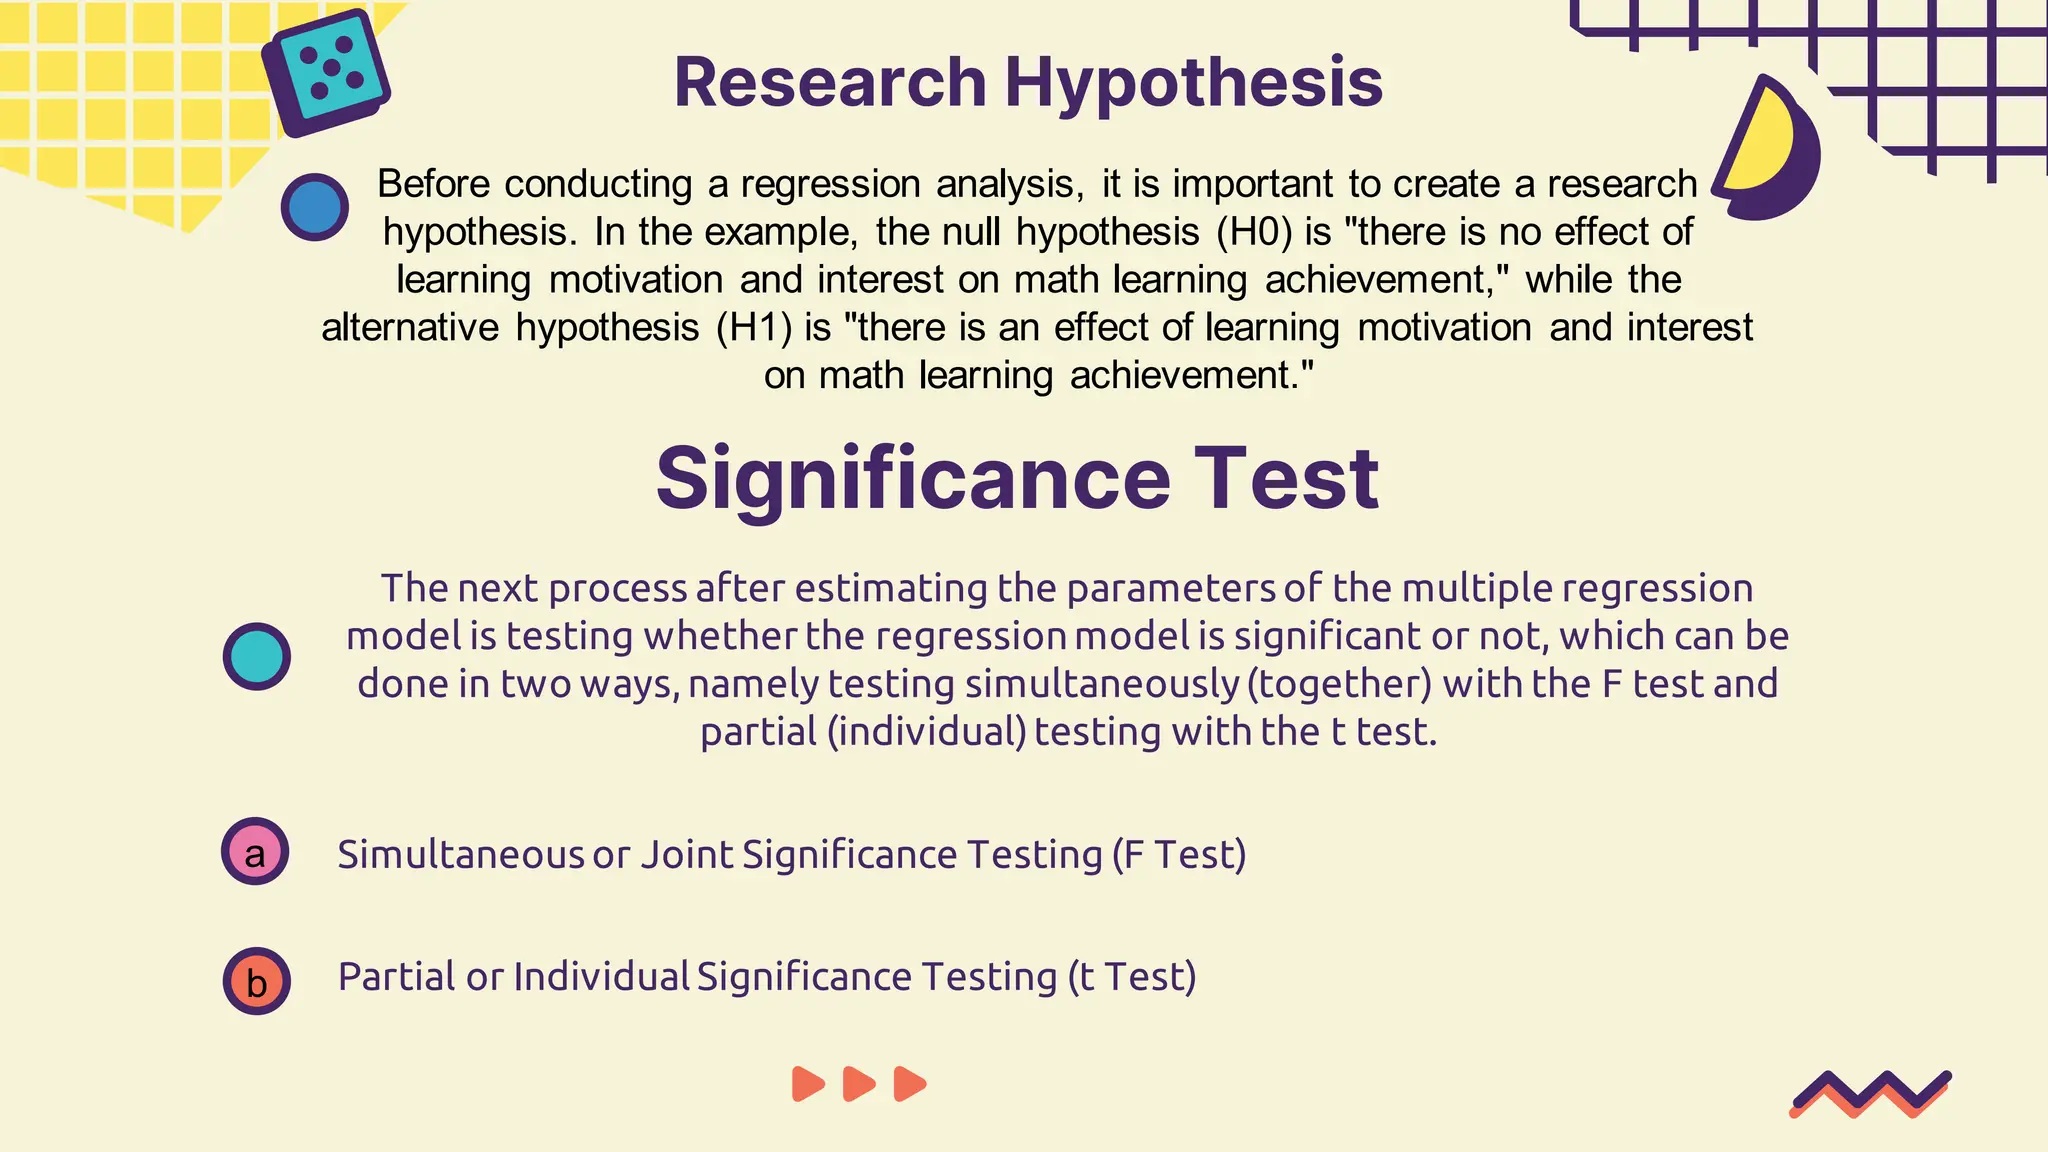
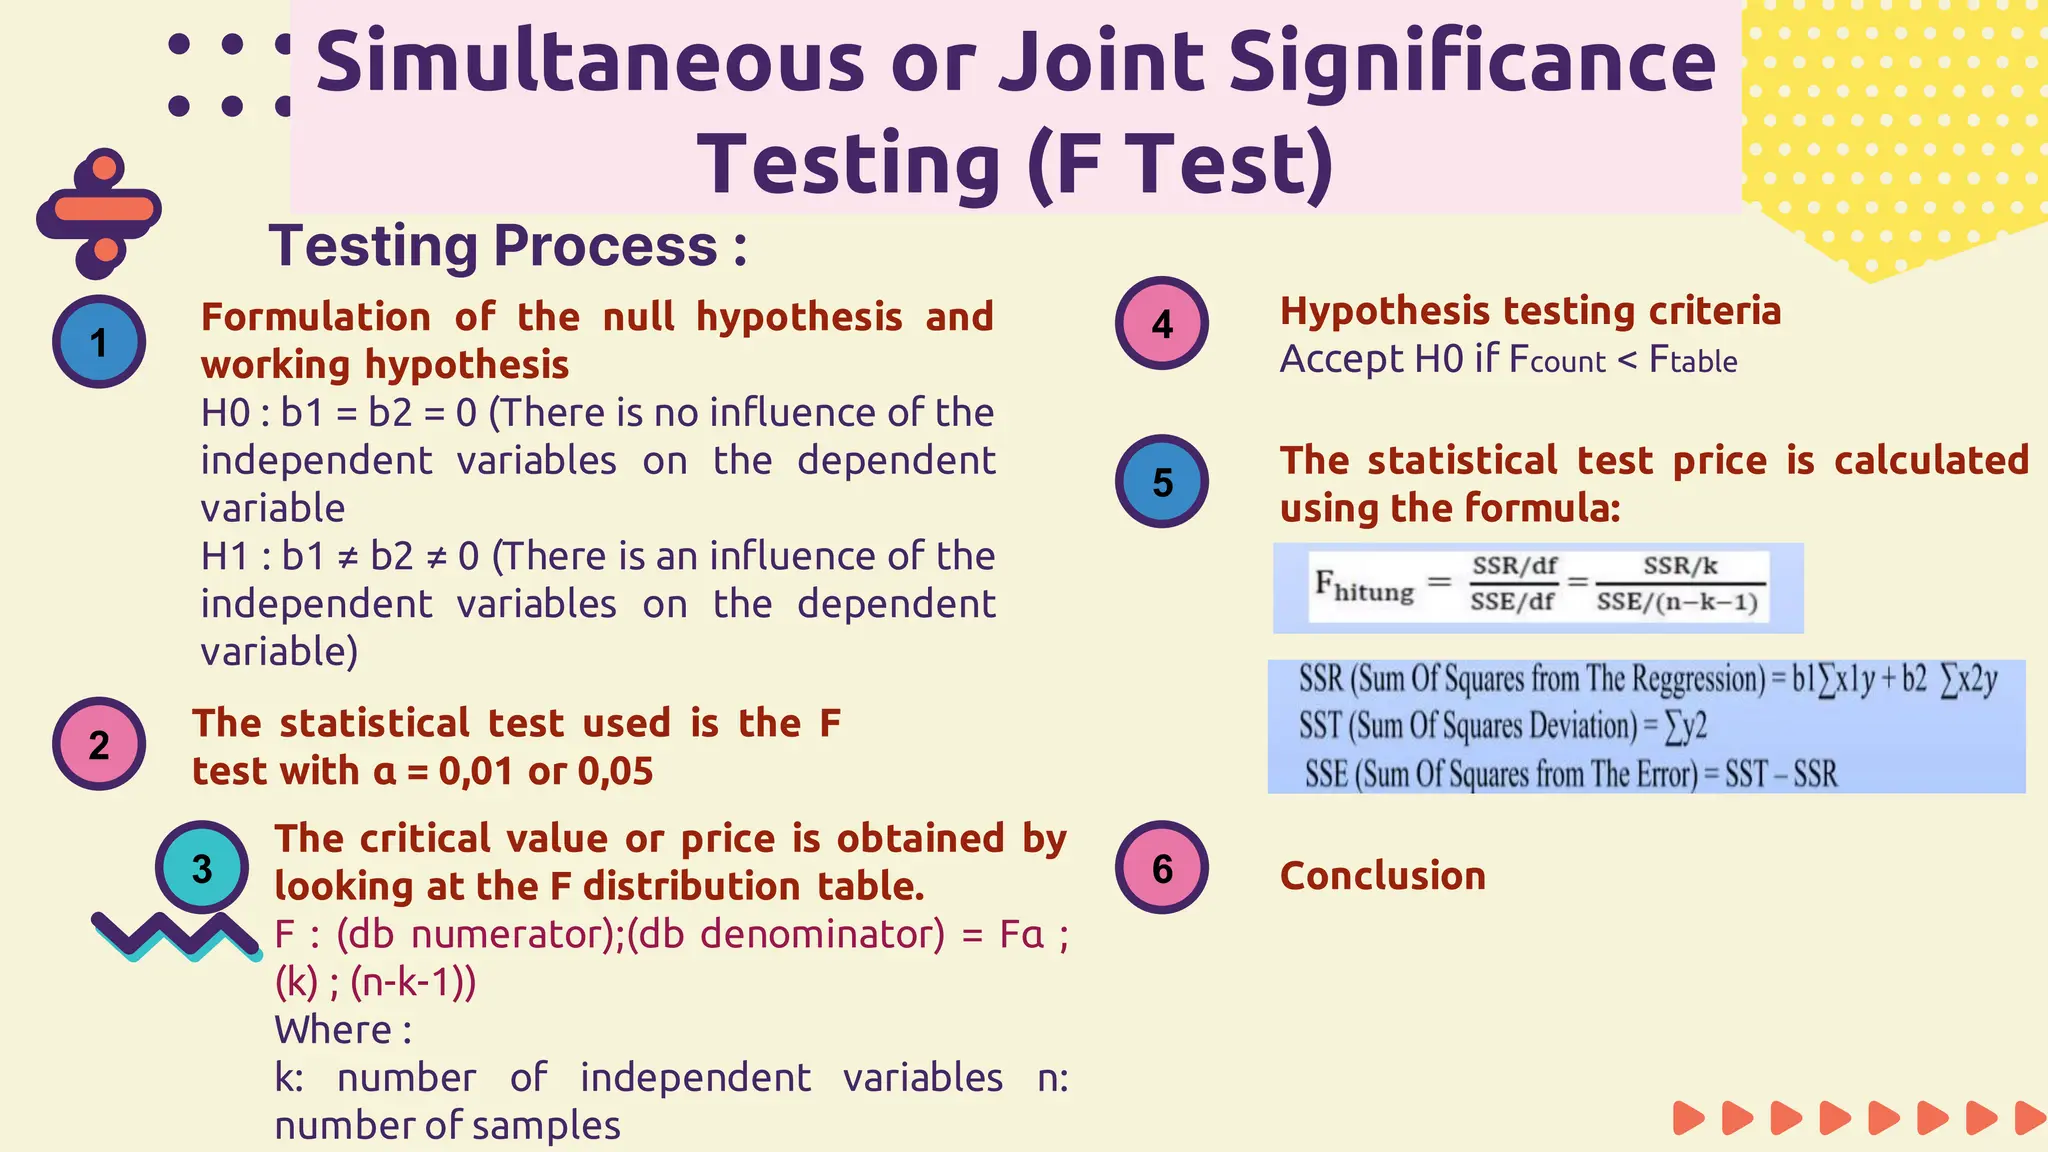
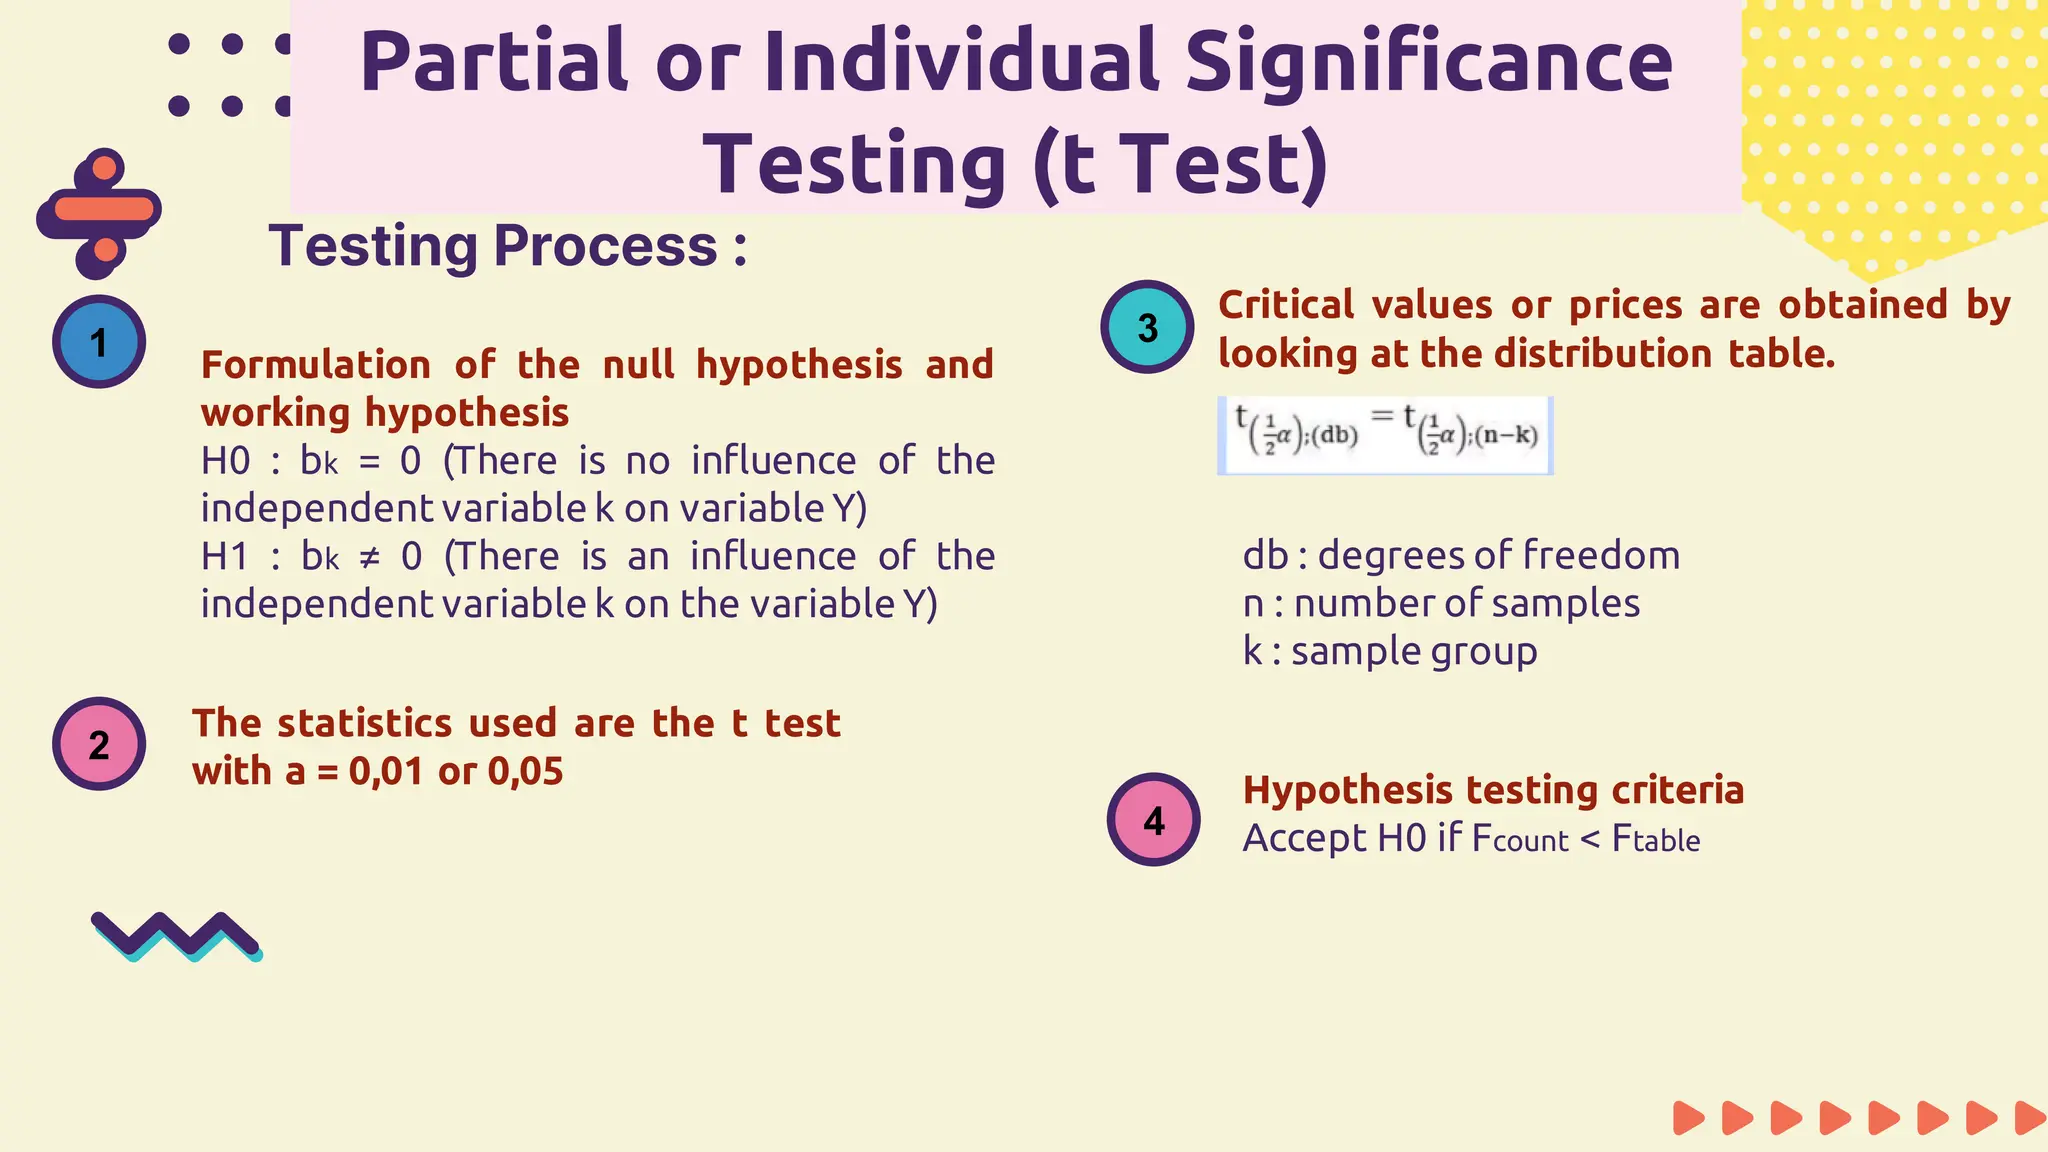
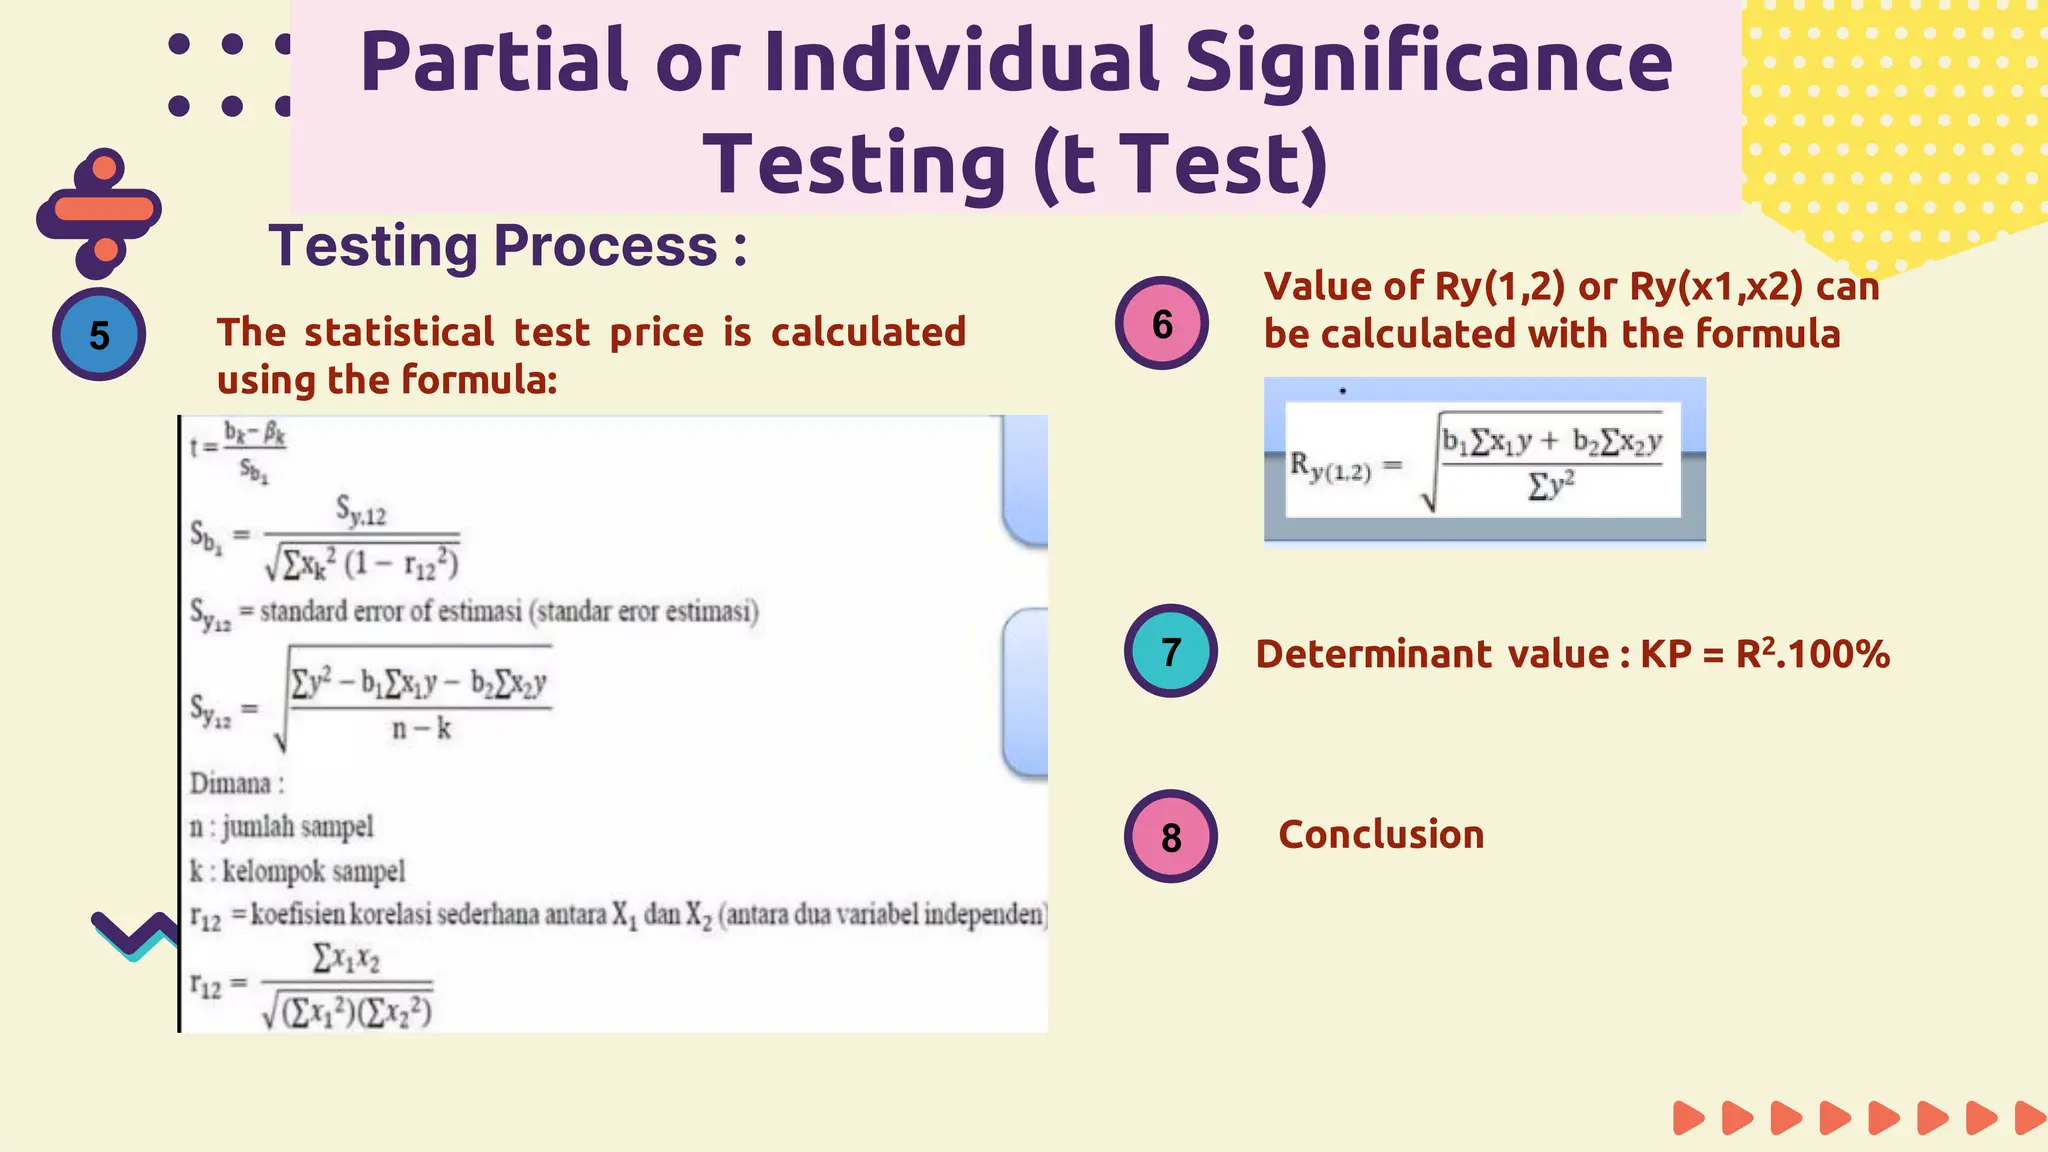
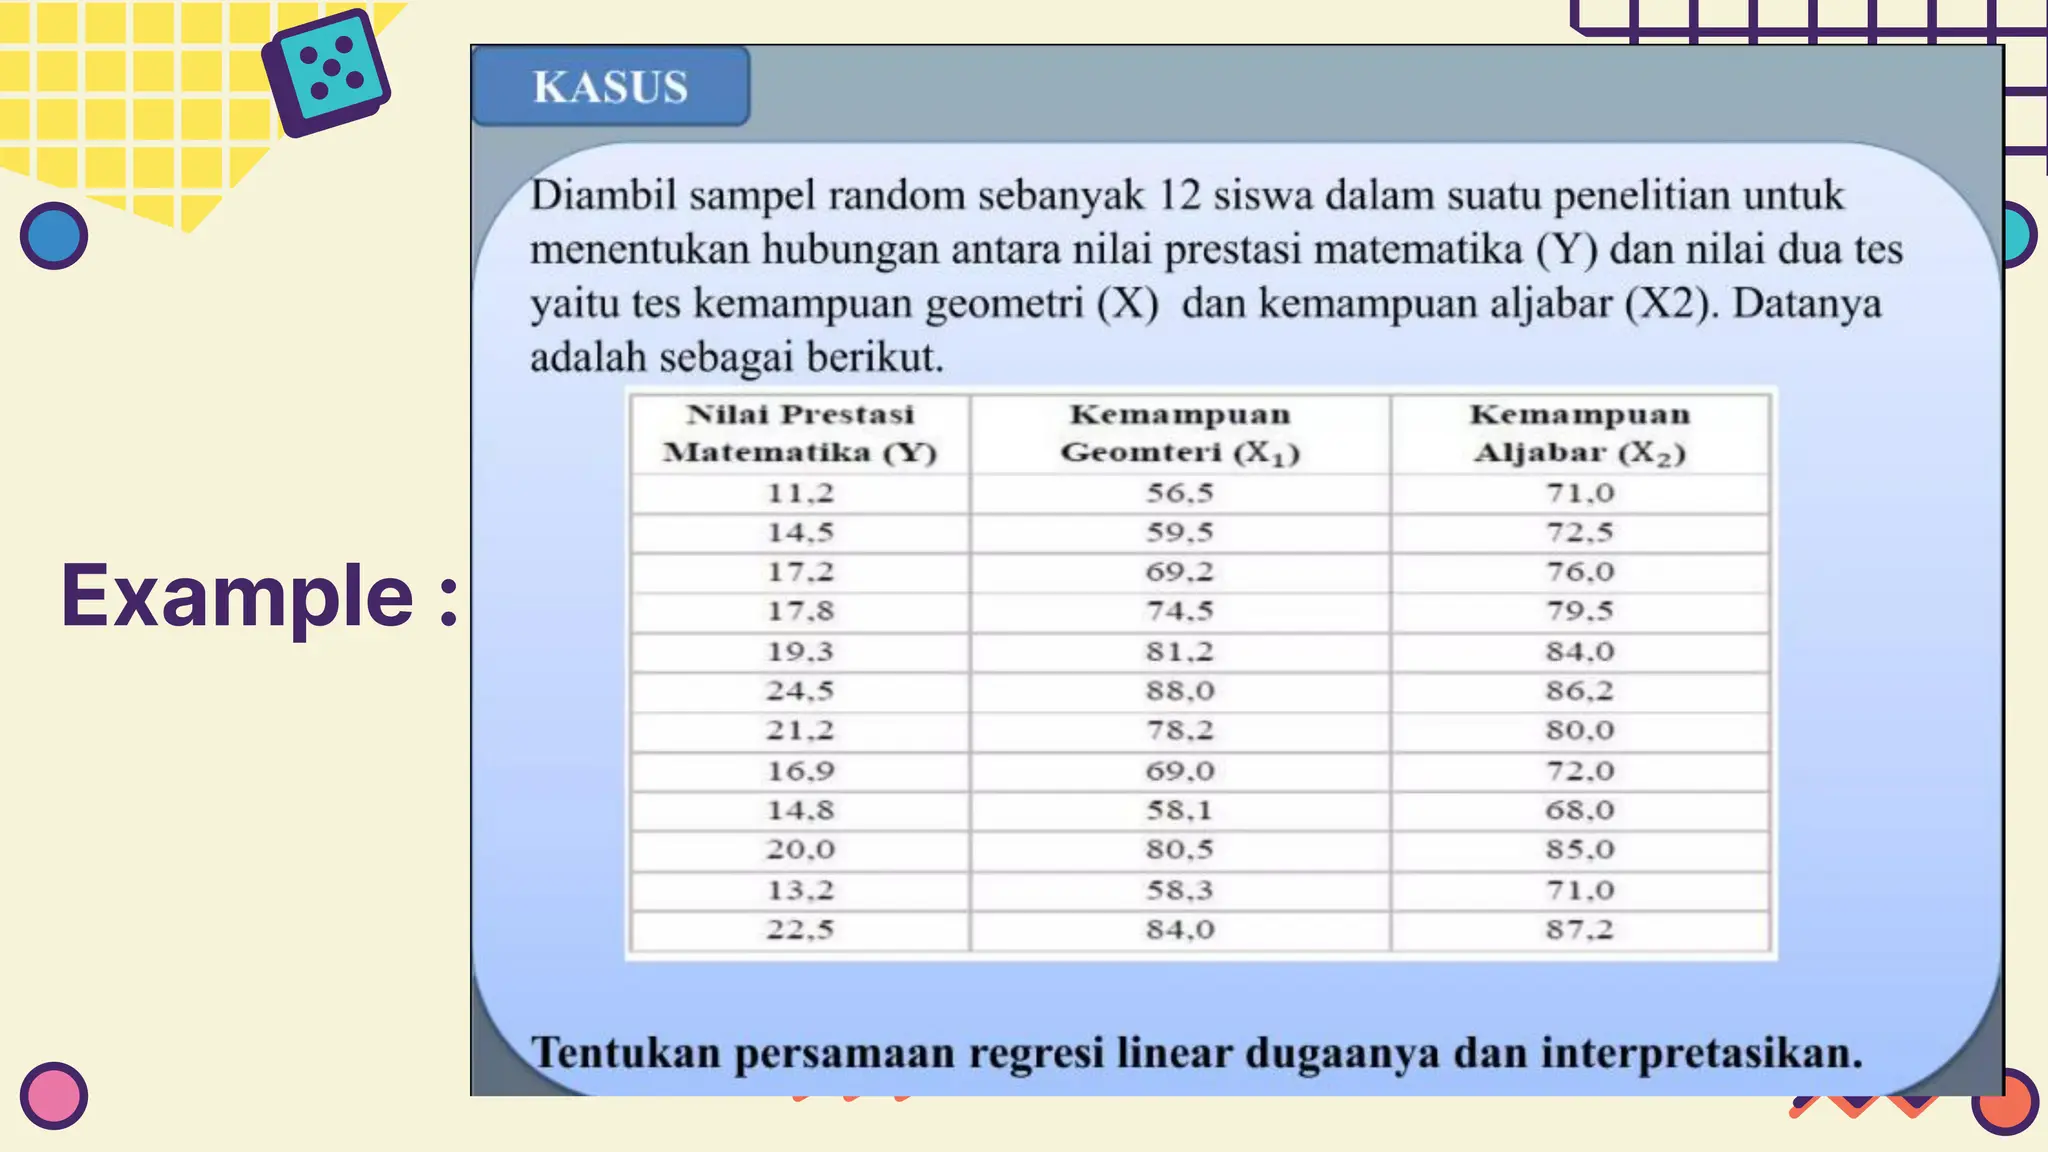
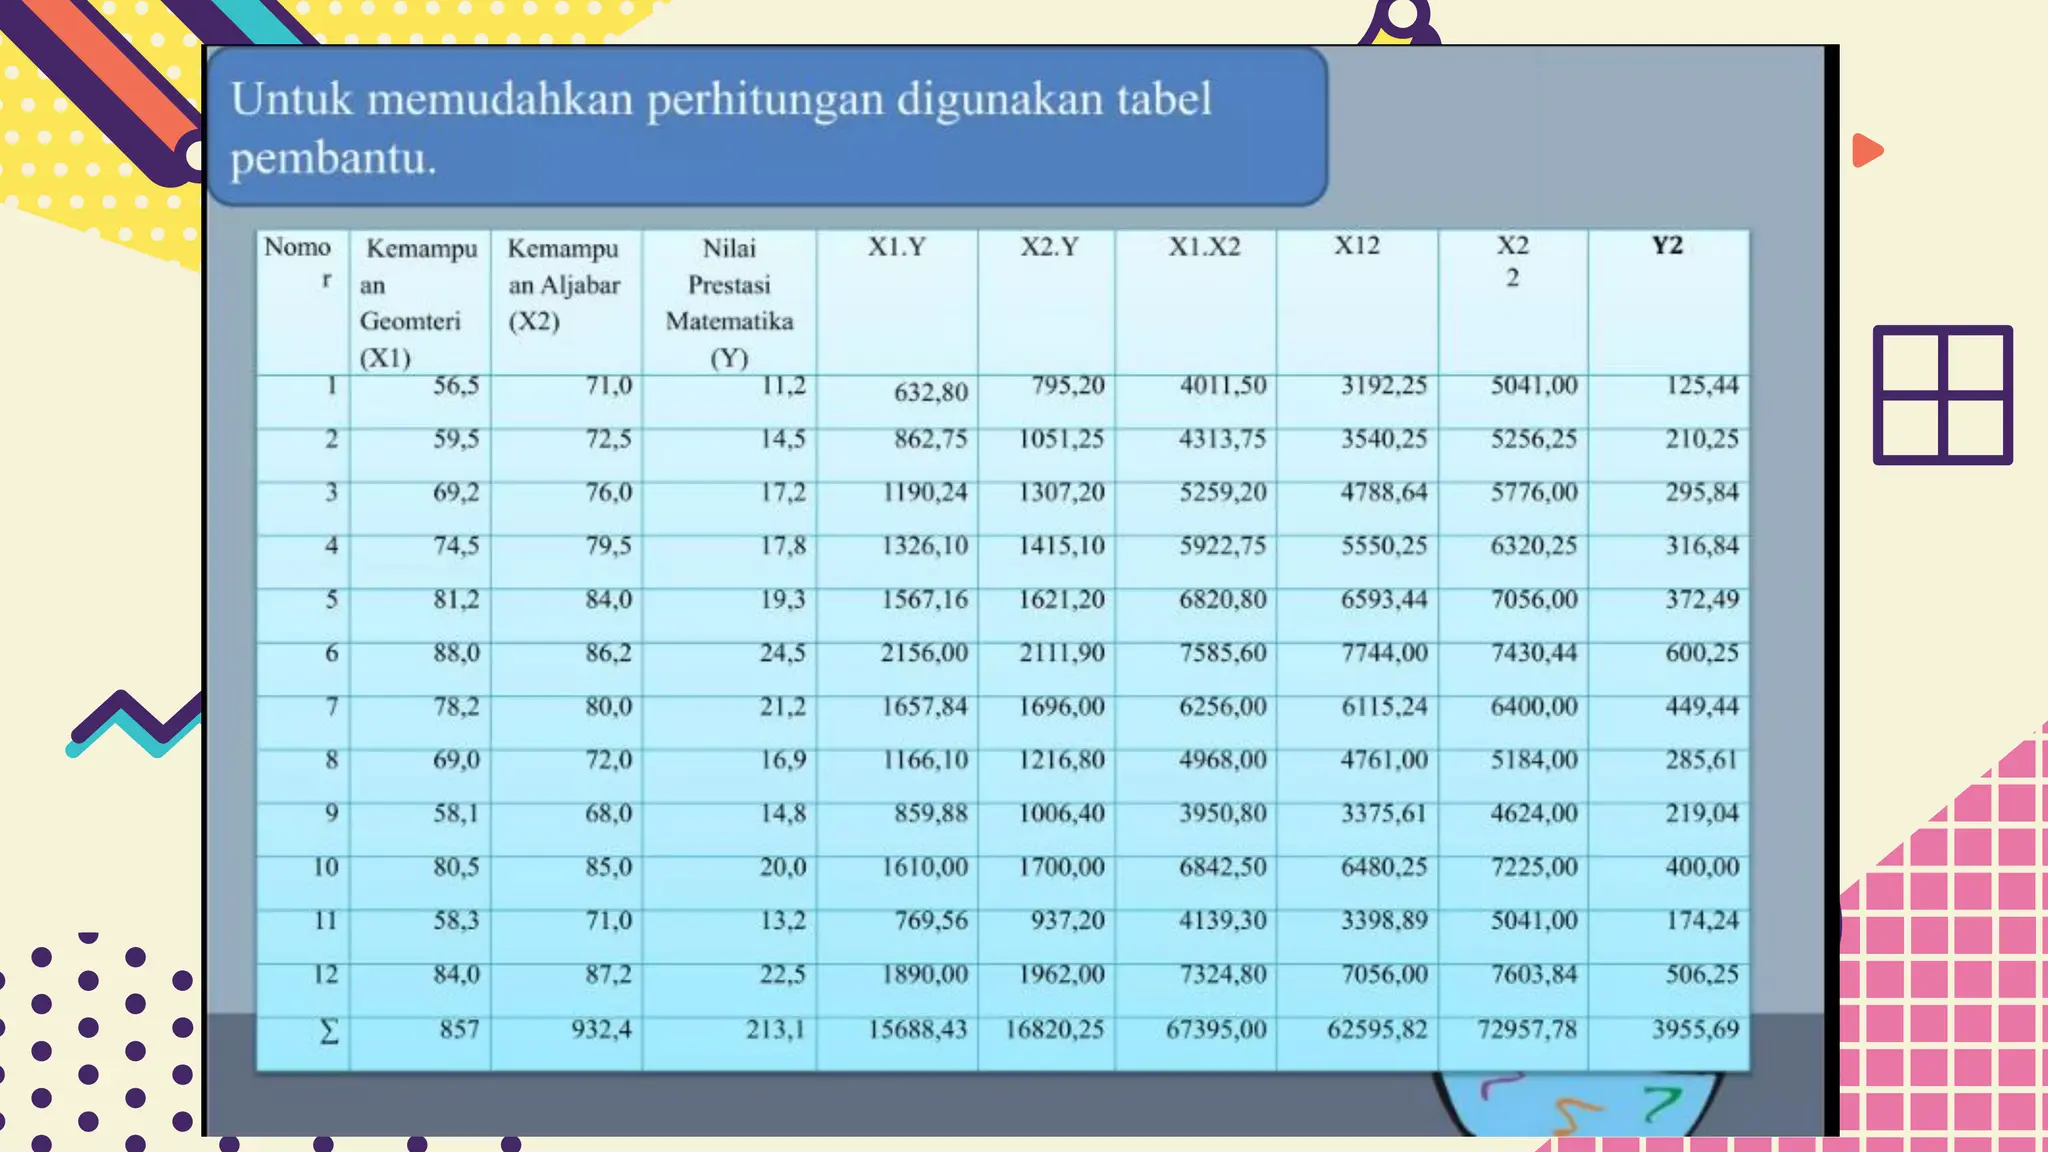
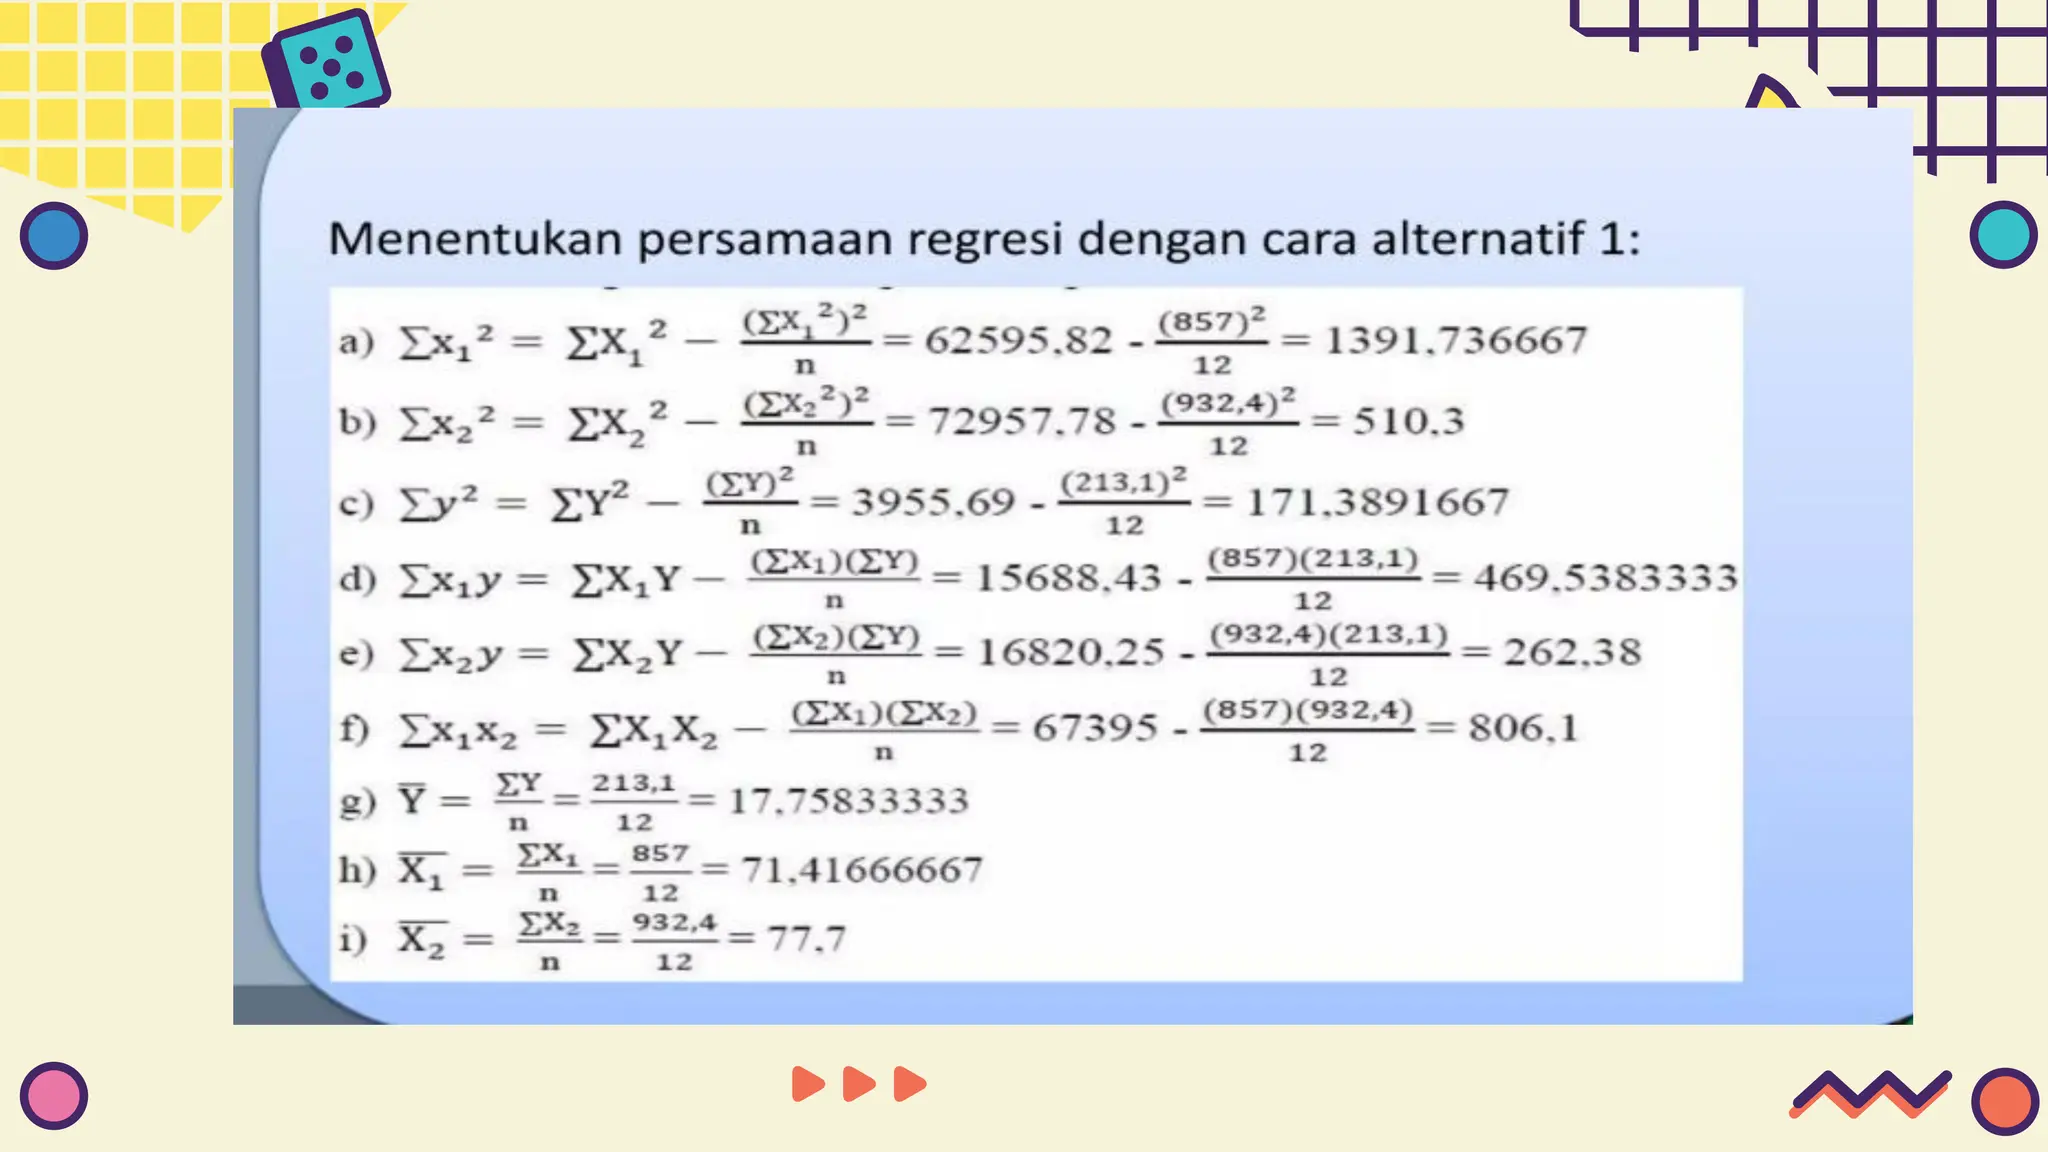
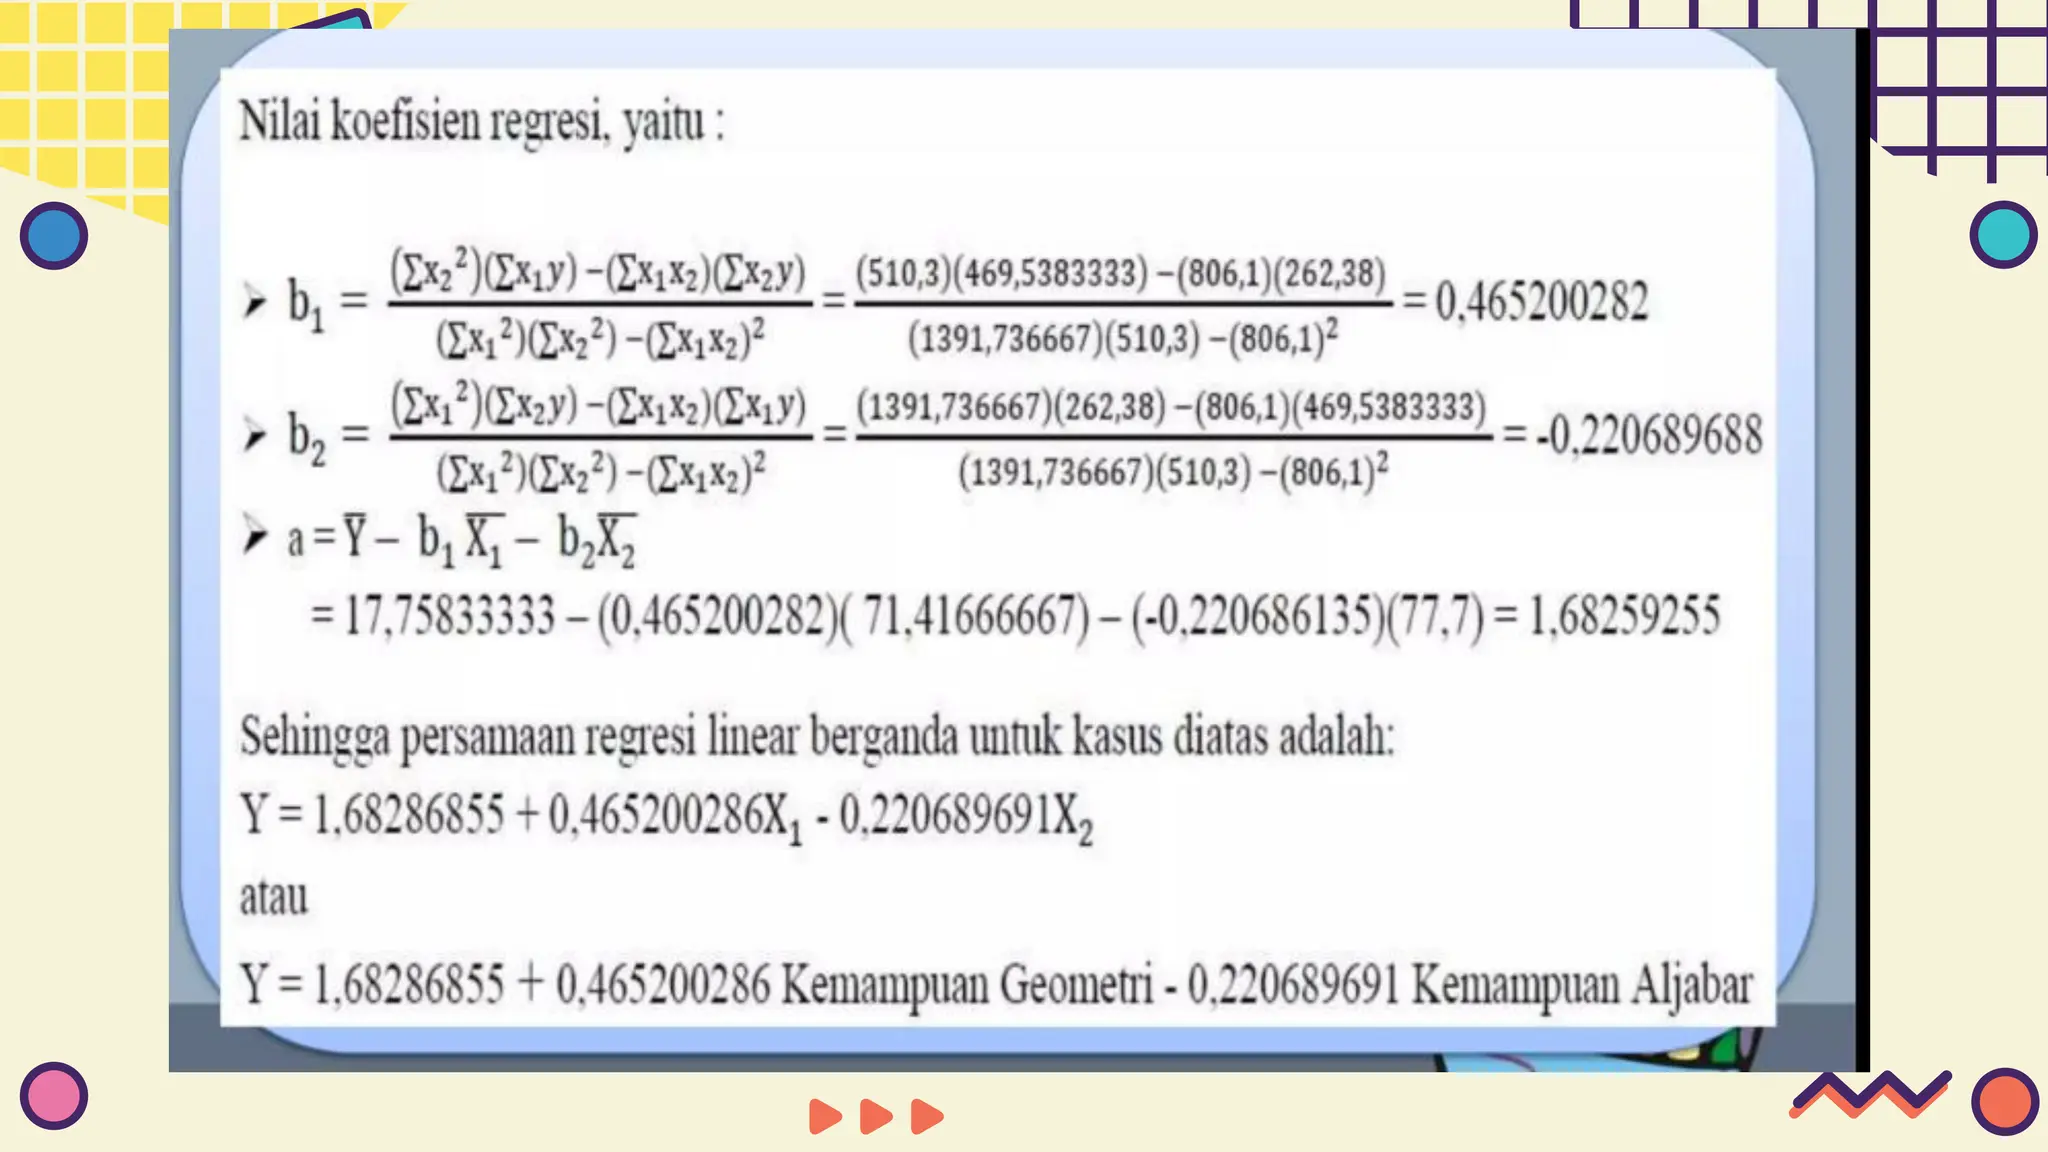
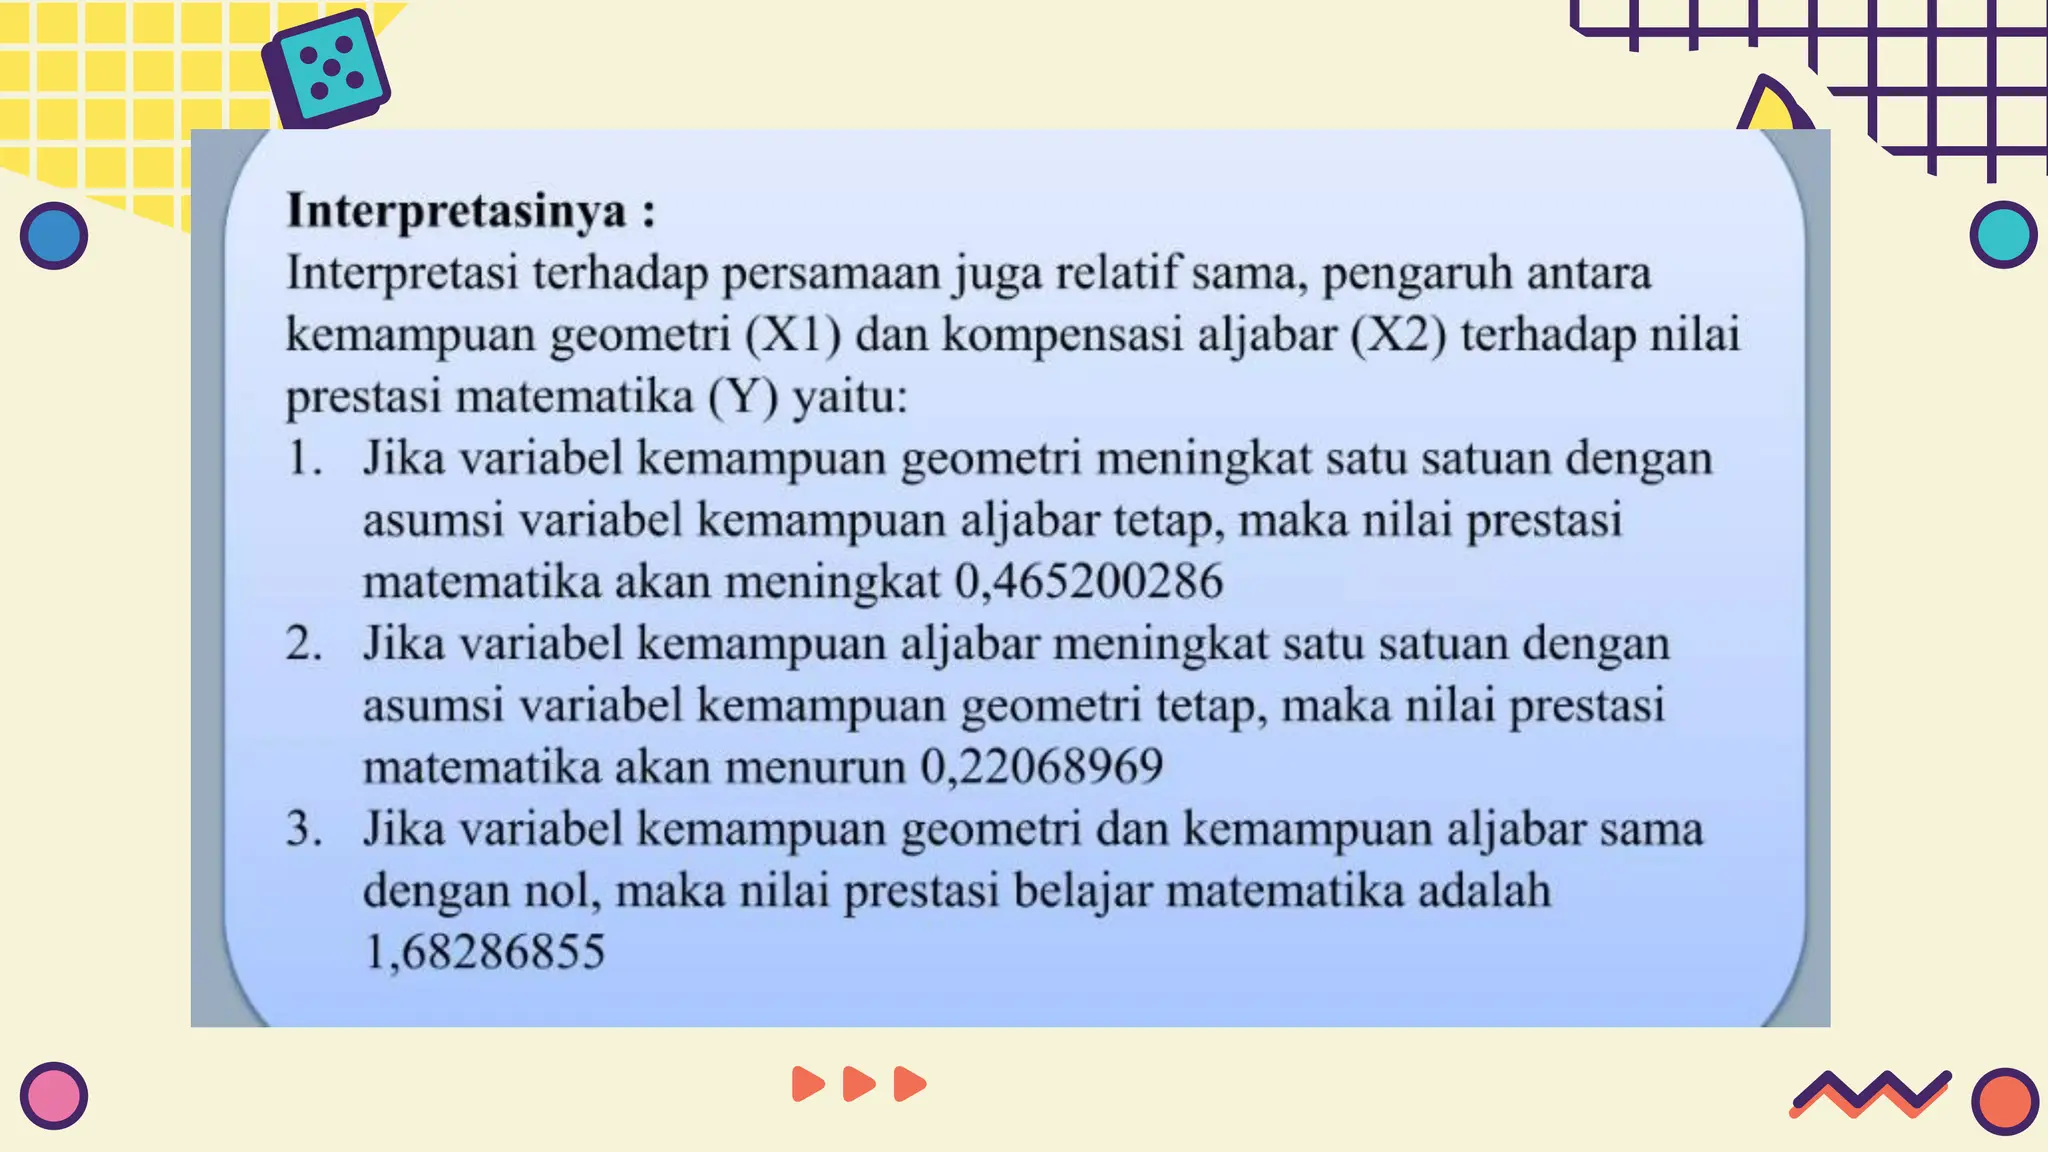
Testing a Multiple
Correlative Hypothesis
Educational Statistic
Regression Analysis
9th
GRADE
● Aisya Salsabila Nafis (216121082)
● Moch Daffa Rajaasyah (216121090)
● Safira Ega Rosanti (216121094)
● Salma Hanna Alifia (216121108)
● Noviatun Nadifah (216121126)
Simple
Regression
Multiple
Regression
TABLE OF CONTENTS
Simple Regression
Analysis
Definition
Simple regression analysis is a statistical method used to
explore and quantify the relationship between two
variables. In this analysis, one variable, known as the
dependent variable, is predicted or explained in terms of the
other variable, known as the independent variable. The main
goal of simple regression analysis is to understand how
changes in the independent variable are associated with
changes in the dependent variable.
Forms of regression equations
A simple regression equation has a general form like this:
y=b0​+b1​x+ε
• y is the dependent variable you want to predict.
• x is the independent variable used to predict
• b0 is the intercept (the value of y when x = 0)
• b1 is a regression coefficient that shows how much y changes when x increases by one
unit.
• - ε is an error term that represents the deviation between the actual value of y and the
value predicted by the model.
Types of regression equations
• Linear Regression
This is a type of regression where the relationship between the independent variable and the
dependent variable is linear. That is, changes in the dependent variable are proportional to
changes in the independent variable. The linear regression equation follows the form described
above.
• Nonlinear Regression
In some cases, the relationship between the independent variable and the dependent variable is
not linear. In this case, simple regression models can use nonlinear forms such as polynomial,
exponential, or logarithmic, depending on the nature of the relationships in the data.
Types of regression equations
Correlation Coefficient
Correlation coefficient measures the strength and direction of the linear relationship
between two variables. In the context of simple regression, the correlation coefficient (r)
measures the extent to which the independent variable (x) and the dependent variable (y)
linearly correlated. Correlation coefficient has a value between -1 and 1, with the following
interpretation:
Correlation Coefficient Formula
Correlation Coefficient Formula between variables (x) and (y) in the
context of simple regression:
Coefficient of Determination (R2)
Coefficient of determination (R2) measures the propotion of variation
in the dependent variable (y) which can be explained by the
independent variable (x) in the regression model.
Mark (R2) ranges between 0 and 1, and the closer it is to 1 the better
the regression model is at explaining variation in the data. Conversely
, the closer to 0, The worse the model is at explaining variation in the
data.
Coefficient of Determination (R2)
Formula
Multiple Linear
Regression
Multiple linear regression analysis is a linear
relationship between two or more independent
variables (X1, X2,...X) and the dependent variable (Y).
This analysis is to determine the direction of the
relationship between the independent variable and the
dependent variable, whether each independent variable
is positively or negatively related and to predict the
value of the dependent variable if the value of the
independent variable increases or decreases. The data
used is usually on an interval or ratio scale.
Definition of Multiple Linear Regression
Y = a + b1x1 + b2x2
Multiple Linear Regression Equation
Dependent variable
(influenced variable)
Y :
Constant (intercept, namely the inherent propertiesof variable Y
b1, b2, bk: Parameters that indicate the slope or slope of
the regression line)
a :
Independent variables
(influencing variable)
X :
Research Hypothesis
Before conducting a regression analysis, it is important to create a research
hypothesis. In the example, the null hypothesis (H0) is "there is no effect of
learning motivation and interest on math learning achievement," while the
alternative hypothesis (H1) is "there is an effect of learning motivation and interest
on math learning achievement."
The next process after estimating the parameters of the multiple regression
model is testing whether the regressionmodel is significant or not, which can be
done in two ways, namely testing simultaneously(together) with the F test and
partial (individual)testing with the t test.
Simultaneous or Joint Significance Testing (F Test)
a
Partial or Individual Significance Testing (t Test)
b
Significance Test
Simultaneous or Joint Significance
Testing (F Test)
1
Formulation of the null hypothesis and
working hypothesis
H0 : b1 = b2 = 0 (There is no influence of the
independent variables on the dependent
variable
H1 : b1 ≠ b2 ≠ 0 (There is an influence of the
independent variables on the dependent
variable)
Testing Process :
3
The critical value or price is obtained by
looking at the F distribution table.
F : (db numerator);(db denominator) = Fα ;
(k) ; (n-k-1))
Where :
k: number of independent variables n:
number of samples
2
The statistical test used is the F
test with α = 0,01 or 0,05
Hypothesis testing criteria
Accept H0 if Fcount < Ftable
4
The statistical test price is calculated
using the formula:
5
Conclusion
6
Partial or Individual Significance
Testing (t Test)
1
Formulation of the null hypothesis and
working hypothesis
H0 : bk = 0 (There is no influence of the
independent variable k on variable Y)
H1 : bk ≠ 0 (There is an influence of the
independent variable k on the variable Y)
Testing Process :
3
Critical values ​​or prices are obtained by
looking at the distribution table.
2
The statistics used are the t test
with a = 0,01 or 0,05 Hypothesis testing criteria
Accept H0 if Fcount < Ftable
4
db : degrees of freedom
n : number of samples
k : sample group
Partial or Individual Significance
Testing (t Test)
Testing Process :
7 Determinant value : KP = R2.100%
Value of Ry(1,2) or Ry(x1,x2) can
be calculated with the formula
6
The statistical test price is calculated
using the formula:
5
Conclusion
8
Example :
CREDITS: This presentation template was created
by Slidesgo, including icons by Flaticon, and
infographics & images by Freepik
THANKS
Do you have any questions?

Group 5 - Regression Analysis.pdf

  • 1.
    Testing a Multiple CorrelativeHypothesis Educational Statistic Regression Analysis 9th GRADE
  • 2.
    ● Aisya SalsabilaNafis (216121082) ● Moch Daffa Rajaasyah (216121090) ● Safira Ega Rosanti (216121094) ● Salma Hanna Alifia (216121108) ● Noviatun Nadifah (216121126)
  • 3.
  • 4.
  • 5.
    Definition Simple regression analysisis a statistical method used to explore and quantify the relationship between two variables. In this analysis, one variable, known as the dependent variable, is predicted or explained in terms of the other variable, known as the independent variable. The main goal of simple regression analysis is to understand how changes in the independent variable are associated with changes in the dependent variable.
  • 6.
    Forms of regressionequations A simple regression equation has a general form like this: y=b0​+b1​x+ε • y is the dependent variable you want to predict. • x is the independent variable used to predict • b0 is the intercept (the value of y when x = 0) • b1 is a regression coefficient that shows how much y changes when x increases by one unit. • - ε is an error term that represents the deviation between the actual value of y and the value predicted by the model.
  • 7.
    Types of regressionequations • Linear Regression This is a type of regression where the relationship between the independent variable and the dependent variable is linear. That is, changes in the dependent variable are proportional to changes in the independent variable. The linear regression equation follows the form described above. • Nonlinear Regression In some cases, the relationship between the independent variable and the dependent variable is not linear. In this case, simple regression models can use nonlinear forms such as polynomial, exponential, or logarithmic, depending on the nature of the relationships in the data.
  • 8.
  • 9.
    Correlation Coefficient Correlation coefficientmeasures the strength and direction of the linear relationship between two variables. In the context of simple regression, the correlation coefficient (r) measures the extent to which the independent variable (x) and the dependent variable (y) linearly correlated. Correlation coefficient has a value between -1 and 1, with the following interpretation:
  • 10.
    Correlation Coefficient Formula CorrelationCoefficient Formula between variables (x) and (y) in the context of simple regression:
  • 11.
    Coefficient of Determination(R2) Coefficient of determination (R2) measures the propotion of variation in the dependent variable (y) which can be explained by the independent variable (x) in the regression model. Mark (R2) ranges between 0 and 1, and the closer it is to 1 the better the regression model is at explaining variation in the data. Conversely , the closer to 0, The worse the model is at explaining variation in the data.
  • 12.
  • 13.
  • 14.
    Multiple linear regressionanalysis is a linear relationship between two or more independent variables (X1, X2,...X) and the dependent variable (Y). This analysis is to determine the direction of the relationship between the independent variable and the dependent variable, whether each independent variable is positively or negatively related and to predict the value of the dependent variable if the value of the independent variable increases or decreases. The data used is usually on an interval or ratio scale. Definition of Multiple Linear Regression
  • 15.
    Y = a+ b1x1 + b2x2 Multiple Linear Regression Equation Dependent variable (influenced variable) Y : Constant (intercept, namely the inherent propertiesof variable Y b1, b2, bk: Parameters that indicate the slope or slope of the regression line) a : Independent variables (influencing variable) X :
  • 16.
    Research Hypothesis Before conductinga regression analysis, it is important to create a research hypothesis. In the example, the null hypothesis (H0) is "there is no effect of learning motivation and interest on math learning achievement," while the alternative hypothesis (H1) is "there is an effect of learning motivation and interest on math learning achievement." The next process after estimating the parameters of the multiple regression model is testing whether the regressionmodel is significant or not, which can be done in two ways, namely testing simultaneously(together) with the F test and partial (individual)testing with the t test. Simultaneous or Joint Significance Testing (F Test) a Partial or Individual Significance Testing (t Test) b Significance Test
  • 17.
    Simultaneous or JointSignificance Testing (F Test) 1 Formulation of the null hypothesis and working hypothesis H0 : b1 = b2 = 0 (There is no influence of the independent variables on the dependent variable H1 : b1 ≠ b2 ≠ 0 (There is an influence of the independent variables on the dependent variable) Testing Process : 3 The critical value or price is obtained by looking at the F distribution table. F : (db numerator);(db denominator) = Fα ; (k) ; (n-k-1)) Where : k: number of independent variables n: number of samples 2 The statistical test used is the F test with α = 0,01 or 0,05 Hypothesis testing criteria Accept H0 if Fcount < Ftable 4 The statistical test price is calculated using the formula: 5 Conclusion 6
  • 18.
    Partial or IndividualSignificance Testing (t Test) 1 Formulation of the null hypothesis and working hypothesis H0 : bk = 0 (There is no influence of the independent variable k on variable Y) H1 : bk ≠ 0 (There is an influence of the independent variable k on the variable Y) Testing Process : 3 Critical values ​​or prices are obtained by looking at the distribution table. 2 The statistics used are the t test with a = 0,01 or 0,05 Hypothesis testing criteria Accept H0 if Fcount < Ftable 4 db : degrees of freedom n : number of samples k : sample group
  • 19.
    Partial or IndividualSignificance Testing (t Test) Testing Process : 7 Determinant value : KP = R2.100% Value of Ry(1,2) or Ry(x1,x2) can be calculated with the formula 6 The statistical test price is calculated using the formula: 5 Conclusion 8
  • 20.
  • 25.
    CREDITS: This presentationtemplate was created by Slidesgo, including icons by Flaticon, and infographics & images by Freepik THANKS Do you have any questions?