
Downloaded 90 times


![©CopyrightFirstSolar,Inc.October2016
5
Module Mismatch
variations in the current-voltage characteristics of photovoltaic modules
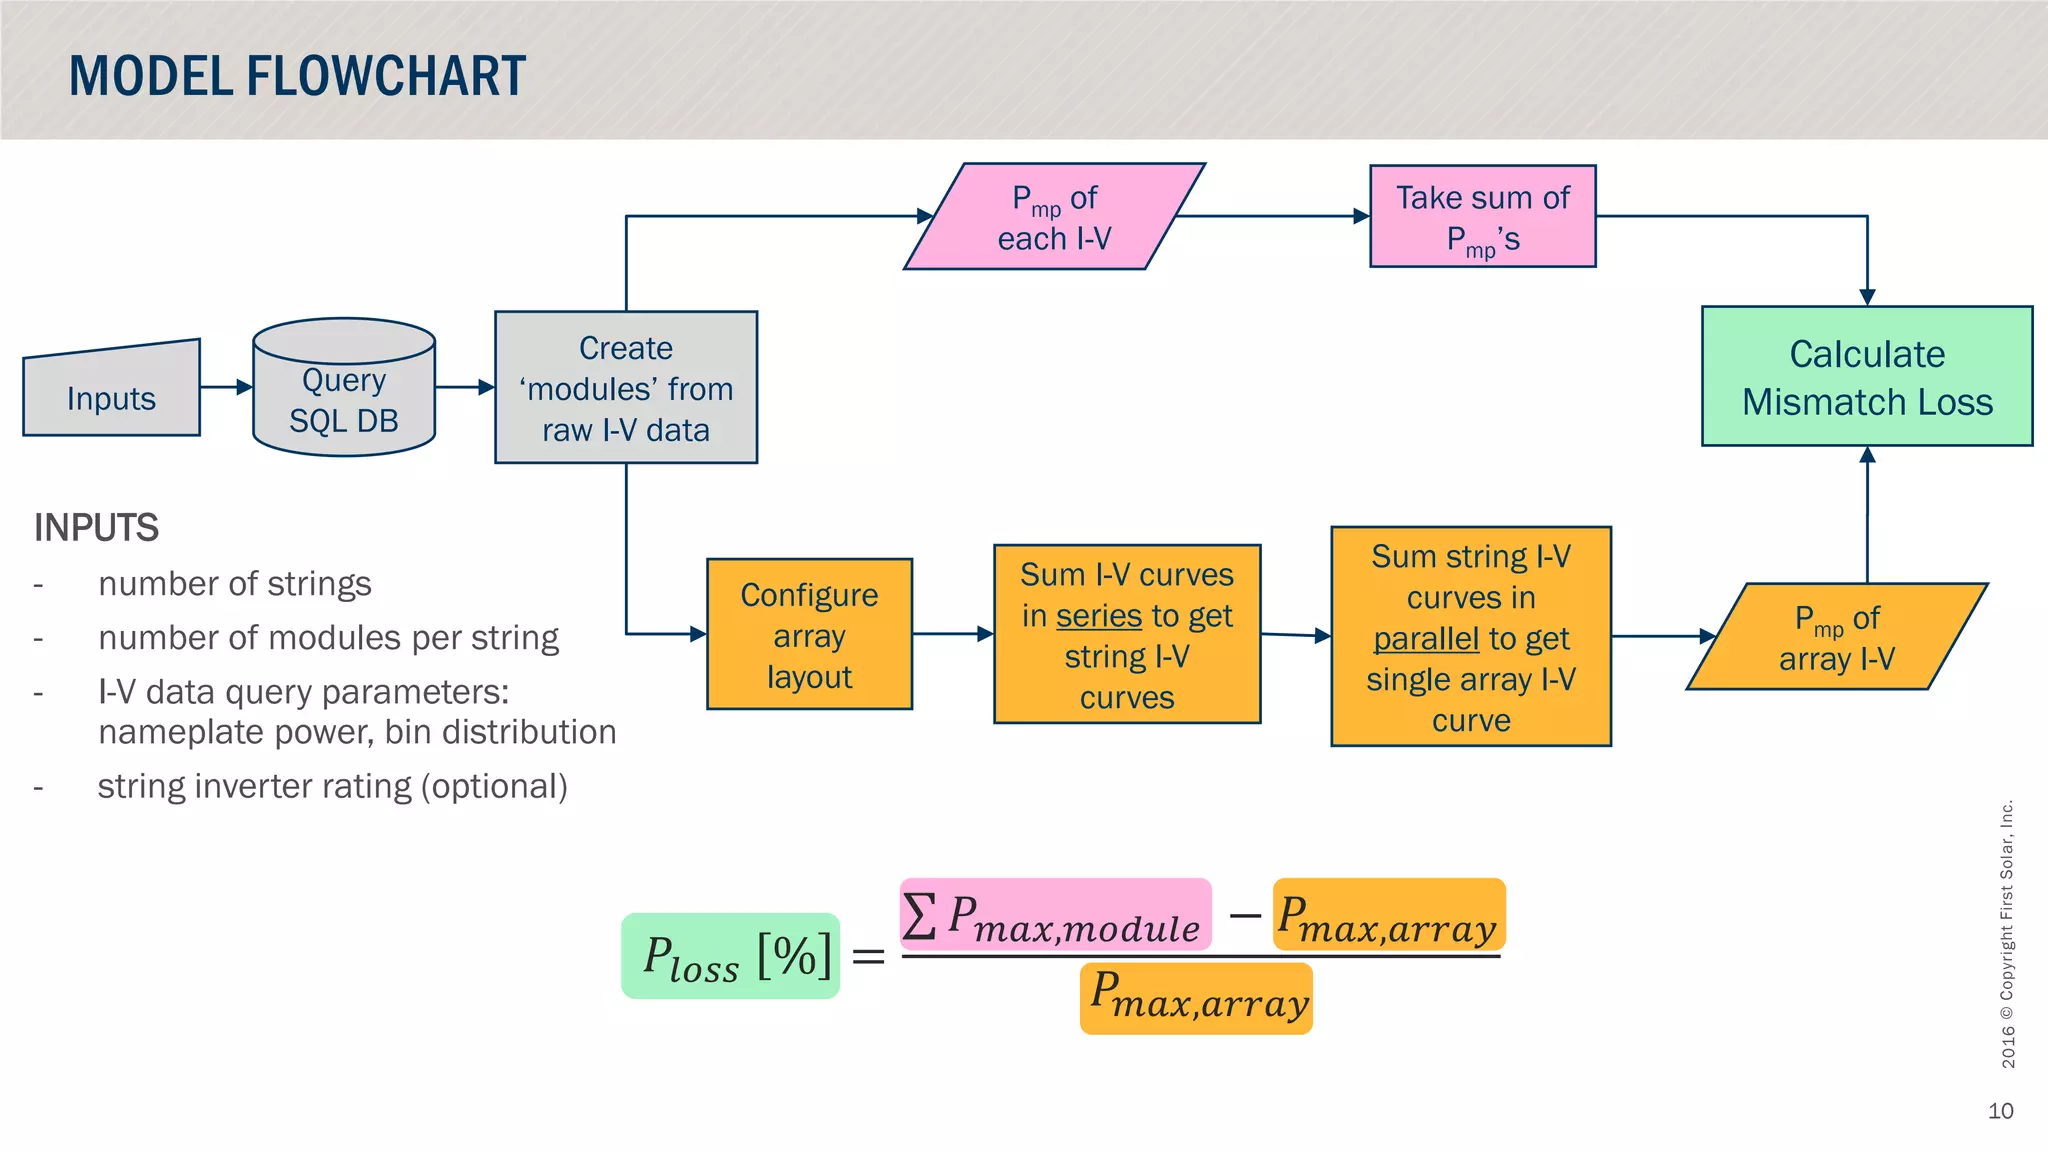
Mismatch Loss [Ploss]
the overall loss in power when modules are connected together in a network, compared to the sum
of their individual maximum power points
𝑃𝑙𝑜𝑠𝑠 % =
𝑃 𝑚𝑎𝑥,𝑚𝑜𝑑𝑢𝑙𝑒 − 𝑃𝑚𝑎𝑥,𝑎𝑟𝑟𝑎𝑦
𝑃𝑚𝑎𝑥,𝑎𝑟𝑟𝑎𝑦
ELECTRICAL MISMATCH: A BRIEF BACKGROUND
SERIES PARALLEL
I = constant
Ploss α σI
V = constant
Ploss α σV](https://image.slidesharecdn.com/63pvpmfreiburgstephenkaplanfirstsolar-161102151254/75/Predicting-mismatch-losses-in-utility-scale-photovoltaic-systems-5-2048.jpg)

![©CopyrightFirstSolar,Inc.October2016
7
PREVIOUS WORK
• Bucciarelli’s statistical approach… mismatch loss is
proportional to the variance of module electrical
characteristics within a bin [1]
• F. Iannone et al. Monte Carlo approach…validates
Bucciarelli’s work, especially at low standard deviations [2]
• Chamberlin et al. achieves mismatches of 0.1-0.53% for
randomly arranged small arrays [3]
• S. MacAlpine et al. suggests that 1-2% derate is applicable
for mismatch at the string-level [4]
MOTIVATION
…to study mismatch at the utility-scale with the most recent
technology, and reevaluate industry wide energy prediction
assumptions.
MOTIVATION
[1] L.L. Buciarelli Jr., “Power loss in photovoltaic arrays due to mismatch in cell characteristics,” Solar Energy, vol. 23, no. 4, pp. 277-288, 1979.
[2] F. Iannone, G. Noviello, A. Sarno, “Monte Carlo techniques to analyse the electrical mismatch losses in large-scale photovoltaic generators,” Solar Energy Vol. 62, No. 2, pp. 85-92, 1998.
[3] C.E. Chamberlin, P. Lehman, J. Zoellick, G. Pauletto, “Effects of mismatch losses in photovoltaic arrays,” Solar Energy, Vol. 54, No. 3, 1995.
[4] S. MacAlpine, M. Brandemuehl, R. Erickson, “Beyond the Module Model and Into the Array: Mismatch in Series Strings,” 38th IEEE PVSC, Austin, TX, 2012.](https://image.slidesharecdn.com/63pvpmfreiburgstephenkaplanfirstsolar-161102151254/75/Predicting-mismatch-losses-in-utility-scale-photovoltaic-systems-7-2048.jpg)


![©CopyrightFirstSolar,Inc.October2016
15
# Strings Inverter Rating [kW]
0 0
100 168.75
200 337.5
300 506.25
400 675
500 843.75
600 1012.5
700 1181.25
800 1350
900 1518.75
1000 1687.5
IMPACT OF DC ARRAY SIZE
Module First Solar Series 4V3
Bin
110.0 W (-0/+2.5W)& 112.5 W (-0/+2.5W)
Effectively5.0W bin.
# SimulationRunsAveraged 5
Inverter Rating ?
# Strings in Array ?
Modules Per String 15
For an effective bin distribution of 5W, mismatch loss decreases as the array size
increases, with a diminishing effect. Mismatch loss remains relatively constant for arrays
above 1.5MW.](https://image.slidesharecdn.com/63pvpmfreiburgstephenkaplanfirstsolar-161102151254/75/Predicting-mismatch-losses-in-utility-scale-photovoltaic-systems-15-2048.jpg)
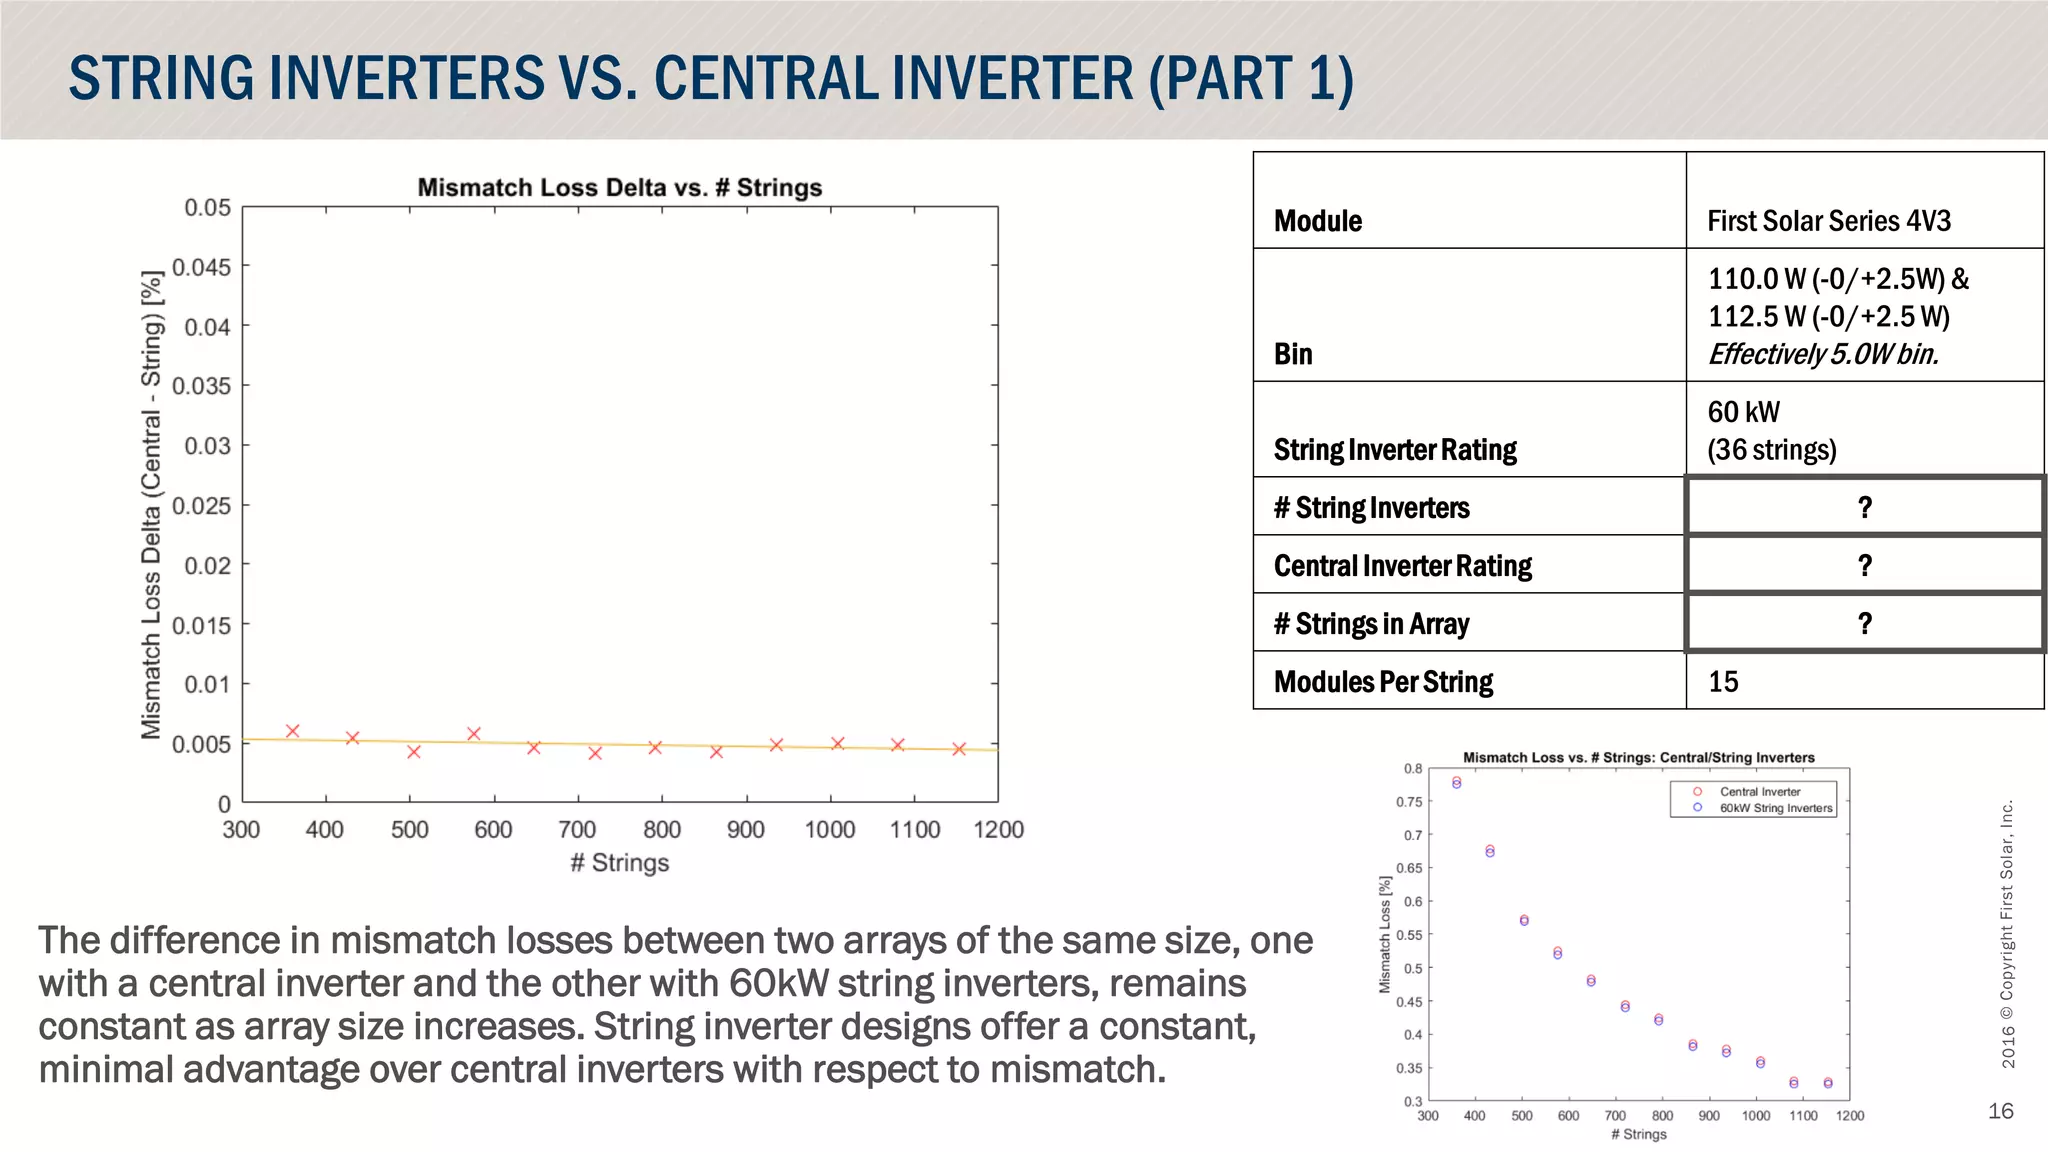
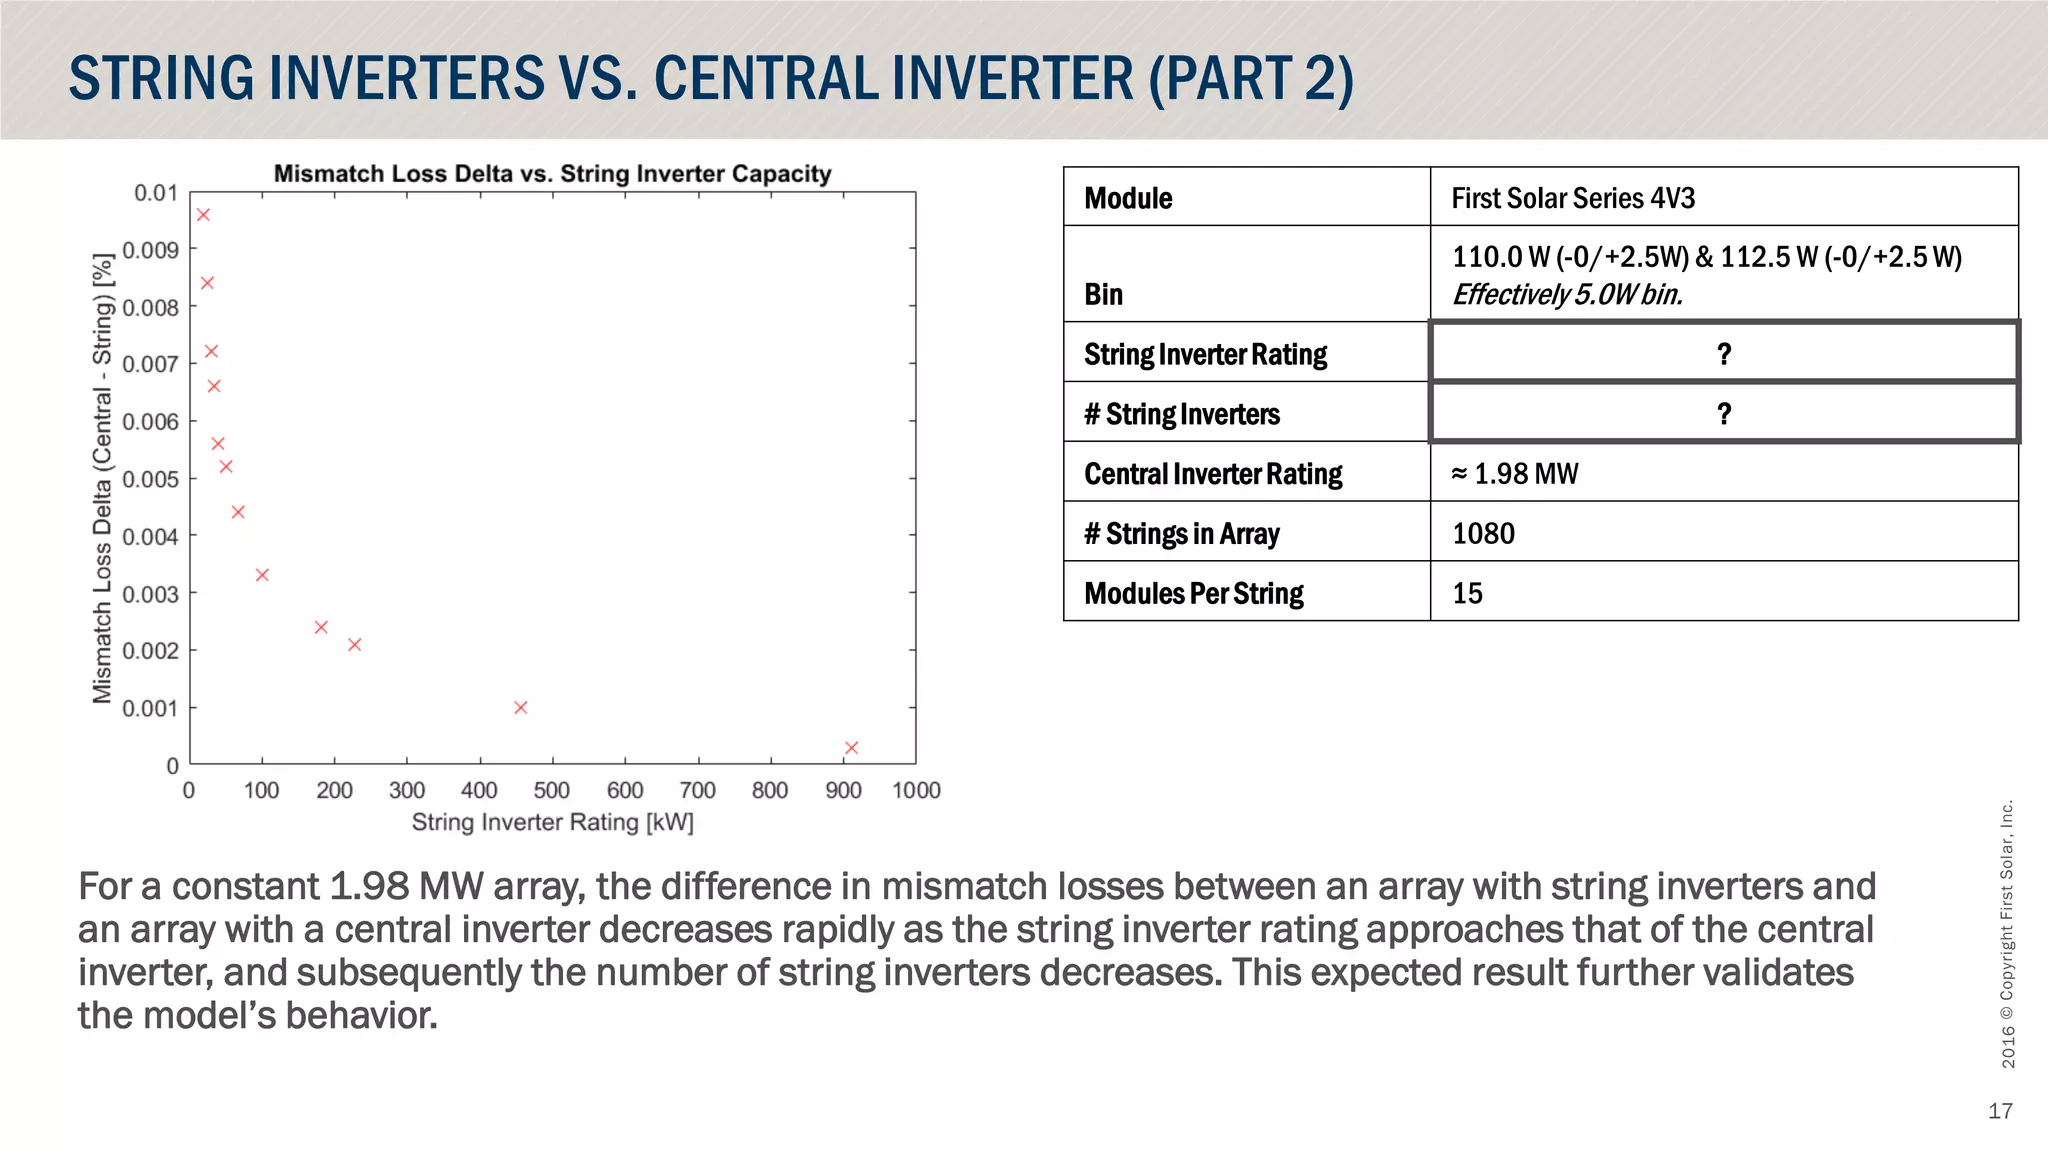


This document summarizes research on predicting mismatch losses in utility-scale photovoltaic systems. The key findings are: 1) For a 1 MW array with a common 5W module power tolerance, mismatch loss is 0.501% of total power. Loss increases with wider distributions. 2) For a 5W distribution, loss decreases as array size increases up to 1.5MW, above which it remains constant. 3) For the same sized array, string inverters offer a constant, minimal advantage over central inverters with respect to mismatch. The difference in losses remains small as array size increases.


![Vibe Coding vs. Spec-Driven Development [Free Meetup]](https://cdn.slidesharecdn.com/ss_thumbnails/vibecodingvsspecdrivendevelopment-251209105622-43f455e7-thumbnail.jpg?width=640&height=640&fit=bounds)


