Data presentation/ How to present Research outcome dataDr-Jitendra Patel
In this power point viewer will be able to know about how to present data which is the out comes of any sincere research. The way of presentation is very very important because ultimately it should reach to the particular audience in proper and effective way.
In this PPT viewers will be able to know how to present data obtained as a result of any kind of Research. In report writing the information received need to reach to targeted audience and received data need to reflect in impressive and understandable manner therefore data presentation is very important.
portion covered
1. Data presentation
2. Textual data presentation
3. Tabular data presentation
4. Qualitative Tabular data presentation
5. Quantitative tabular data presentation
6. Temporal tabular data presentation
7. Spatial tabular data presentation
Lecture on Introduction to Descriptive Statistics - Part 1 and Part 2. These slides were presented during a lecture at the Colombo Institute of Research and Psychology.
Quantitative Methods of Research-Intro to research
Once a researcher has written the research question, the next step is to determine the appropriate research methodology necessary to study the question. The three main types of research design methods are qualitative, quantitative and mixed methods.
Quantitative research involves the systematic collection and analysis of data.
Statistical methods and analyses are used to communicate research findings and give credibility to research methodology and conclusions. It is important for researchers and also consumers of research to understand statistics so that they can be informed, evaluate the credibility and usefulness of information, and make appropriate decisions.
The data, collected for research, has to be processed, analyzed and interpreted to develop a solution to the research question.
Data analysis is a practice in which unorganized or unfinished data is ordered and organized so that useful information can be extracted from it.
It is the most enjoyable part of carrying out the research since after all of the hard works and waiting the researcher gets the chance to find out the answers. So analyzing the data and interpreting the results are the “reward” for the work of collecting the data.
It helps to you understand about statistics and helps in acquiring knowledge and helps to analysing the answers , and in the present generation helps to study about statistics
Definition, functions, scope, limitations of statistics; diagrams and graphs; basic definitions and rules for probability, conditional probability and independence of events.
Statistics as a subject (field of study):
Statistics is defined as the science of collecting, organizing, presenting, analyzing and interpreting numerical data to make decision on the bases of such analysis.(Singular sense)
Statistics as a numerical data:
Statistics is defined as aggregates of numerical expressed facts (figures) collected in a systematic manner for a predetermined purpose. (Plural sense) In this course, we shall be mainly concerned with statistics as a subject, that is, as a field of study
Welcome to TechSoup New Member Orientation and Q&A (May 2024).pdfTechSoup
In this webinar you will learn how your organization can access TechSoup's wide variety of product discount and donation programs. From hardware to software, we'll give you a tour of the tools available to help your nonprofit with productivity, collaboration, financial management, donor tracking, security, and more.
Embracing GenAI - A Strategic ImperativePeter Windle
Artificial Intelligence (AI) technologies such as Generative AI, Image Generators and Large Language Models have had a dramatic impact on teaching, learning and assessment over the past 18 months. The most immediate threat AI posed was to Academic Integrity with Higher Education Institutes (HEIs) focusing their efforts on combating the use of GenAI in assessment. Guidelines were developed for staff and students, policies put in place too. Innovative educators have forged paths in the use of Generative AI for teaching, learning and assessments leading to pockets of transformation springing up across HEIs, often with little or no top-down guidance, support or direction.
This Gasta posits a strategic approach to integrating AI into HEIs to prepare staff, students and the curriculum for an evolving world and workplace. We will highlight the advantages of working with these technologies beyond the realm of teaching, learning and assessment by considering prompt engineering skills, industry impact, curriculum changes, and the need for staff upskilling. In contrast, not engaging strategically with Generative AI poses risks, including falling behind peers, missed opportunities and failing to ensure our graduates remain employable. The rapid evolution of AI technologies necessitates a proactive and strategic approach if we are to remain relevant.
Model Attribute Check Company Auto PropertyCeline George
In Odoo, the multi-company feature allows you to manage multiple companies within a single Odoo database instance. Each company can have its own configurations while still sharing common resources such as products, customers, and suppliers.
Read| The latest issue of The Challenger is here! We are thrilled to announce that our school paper has qualified for the NATIONAL SCHOOLS PRESS CONFERENCE (NSPC) 2024. Thank you for your unwavering support and trust. Dive into the stories that made us stand out!
How to Make a Field invisible in Odoo 17Celine George
It is possible to hide or invisible some fields in odoo. Commonly using “invisible” attribute in the field definition to invisible the fields. This slide will show how to make a field invisible in odoo 17.
Introduction to AI for Nonprofits with Tapp NetworkTechSoup
Dive into the world of AI! Experts Jon Hill and Tareq Monaur will guide you through AI's role in enhancing nonprofit websites and basic marketing strategies, making it easy to understand and apply.
Biological screening of herbal drugs: Introduction and Need for
Phyto-Pharmacological Screening, New Strategies for evaluating
Natural Products, In vitro evaluation techniques for Antioxidants, Antimicrobial and Anticancer drugs. In vivo evaluation techniques
for Anti-inflammatory, Antiulcer, Anticancer, Wound healing, Antidiabetic, Hepatoprotective, Cardio protective, Diuretics and
Antifertility, Toxicity studies as per OECD guidelines
2. INTRODUCTION TO STATISTICS
In the modern world of computers and
information technology, the importance
of statistics is very well recognized by
all the disciplines. Statistics has
applications in Agriculture, Economics,
Commerce, Biology, Medicine, Industry,
planning, education and so on.
3. STATISTICS
Meaning of Statistics:
Statistics is concerned with scientific methods for
collecting, organizing, summarizing, presenting and
analyzing data as well as deriving valid
conclusions and making reasonable decisions on
the basis of this analysis..
4. The word ‘ statistic’ is used to refer to
1. Numerical facts, such as the
number of people living in
particular area.
2. The study of ways of collecting,
analyzing and interpreting the
facts.
5. DEFINITION
The science of collectiong, organizing, presenting,
analyzing, and interpreting data to assist in making
more effective decisions
Statistical analysis – used to manipulate
summarize, and investigate data, so that useful
decision-making information results.
7. INFERENTIAL STATISTICS
Branch deals with procedure for making inferences
about the characteristics that describe the large
group of data called population
8. Descriptive statistics
Branch of statistics which deals with concepts and
methods concern with summarization and
description of the important aspects of numerical
data. This area of study includes graphical display
of data and the computation of information about
centre of data.
9. Descriptive Statistics
• Collect data
• e.g., Survey
• Present data
• e.g., Tables and graphs
• Summarize data
• e.g., Sample mean =
iX
n
10. 10
Variables
• A variable is a characteristic or condition that can
change or take on different values.
• Most research begins with a general question
about the relationship between two variables for a
specific group of individuals.
11. 11
Types of Variables
• Variables can be classified as
• Discrete variables (such as class size) consist of
indivisible categories.
• continuous variables (such as time or weight) are
infinitely divisible into whatever units a researcher
may choose. For example, time can be measured
to the nearest minute, second, half-second, etc.
12. Data
Statistical data are usually obtained by counting or
measuring items. Most data can be put into the
following categories:
• Qualitative - data are measurements that each fail
into one of several categories. (hair color, ethnic
groups and other attributes of the population)
• quantitative - data are observations that are
measured on a numerical scale (distance traveled
to college, number of children in a family, etc.)
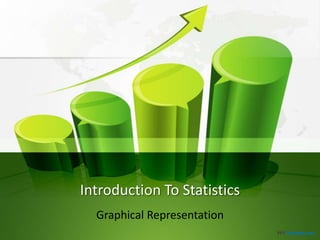
13. GRAPHICAL REPRESENTATION
THE VISUAL DISPLAY OF STATISTICA
DATA IN THE FORM OF POINTS,
LINES, AREAS AND OTHER
GEMETRICAL FORMS AND
SYMBOLS, IS IN THE MOST GENRAL
TERMS KNOWN AS GRAPHICAL
REPRESENTATION.
14. BAR GRAPH
A bar graph is a chart that uses either horizontal or
vertical bars to show comparisons among
categories.
16. A simple bar graph to display profit a bank
for 5 years:
17.
18. LINE DIAGRAM
A graph that shows information that is connected
in some way (such as change over time). Line
graph represent data or information in the form of
dots, and these dots shows like a line in the
particular graph.
19.
20. PIE DIAGRAM
Pie diagram is a circular diagram
where the whole circle represents
a total and the components of the
total are representated by sectors
of the pie diagram. Pie diagram is
also called sector diagram.
21. Example (Pie Chart)
The Chart below shows the percentage of usage of different browser in
Europe. In this chart 37.9% of people in Europe use Firefox and 15.5% of
people use chrome, vice versa.
22. PICTOGRAM
A pictogram is a popular device for
portraying the statistical data by
means of pictures or small
symbols.
23.
24. HISTOGRAM
A histogram consists of a set of
adjacent rectangles whose bases
are marked off by class boundaries
(not class limits) on the X- axis
and whose heights are proportional
to the frequencies associated with
respective classes.