Downloaded 47 times


![Item-to-Item Collaborative Filtering
Made famous by Amazon ~2003
Couldn’t scale traditional User-to-Item algos
Offline: Generates ItemID::List[CustomerID] vectors
Online: For each item in shopping cart, find similar
items based on closest List[CustomerID] vector](https://image.slidesharecdn.com/practicaldatascienceonsparkrecommendationsstratany2015-151002025129-lva1-app6891/85/Practical-Data-Science-Workshop-Recommendation-Systems-Collaborative-Filtering-Strata-NY-2015-31-320.jpg)


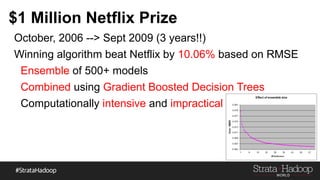


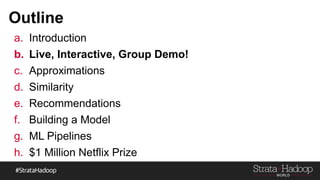
The document discusses practical data science applications using Spark and Hadoop, focusing on collaborative filtering recommendation systems. It covers concepts like approximations, similarity measures, model building, and machine learning pipelines, incorporating a live demo and key terms required in recommendation ML. Furthermore, it highlights the $1 million Netflix prize and the winning algorithm's intricacies and performance gains.