SlideShare a Scribd company logo
1 of 8
Line Charts and Candlestick Charts
A line chart is a graphical representation of a stock's historical price
action that connects a series of data points with a continuous line.
This is the most basic type of chart used in finance and typically only
depicts a security's closing prices over time.
A candlestick is a type of price chart used in technical analysis that
displays the high, low, open, and closing prices of a security for a
specific period.
A candlestick chart is made up of candlesticks for a given time
frame. Candlestick charts are the preferred tool of analysis for
traders since they provide all the required information in a glance.
Price Action Terms
Price action: It is the movement of a security's price plotted over time. Price action forms the basis for all
technical analysis of a stock. Many short-term traders rely exclusively on price action and the formations
and trends extrapolated from it to make trading decisions.
Support: A support level is a level where the price tends to find support as it falls. This means that the price
is more likely to "bounce" off this level rather than break through it. However, once the price has breached
this level, by an amount exceeding some noise, it is likely to continue falling until meeting another support
level.
Resistance: A resistance level is the opposite of a support level. It is where the price tends to find resistance
as it rises. Again, this means that the price is more likely to "bounce" off this level rather than break through
it. However, once the price has breached this level, by an amount exceeding some noise, it is likely to
continue rising until meeting another resistance level.
Stoploss: A stop-loss is designed to limit an investor's loss on a security position that makes an unfavorable
move. It is generally a pre-set price below the buy price or above the sell price at which the trader decides
to square off positions at a loss.
Marubozu
The green Marubozu indicates that the stock price
moved up through the day with the opening price
near the day’s low and closing price near the day’s
high. It is a very bullish indicator.
The red Marubozu indicates that the stock price fell
through the day with the opening price near the day’s
high and closing price near the day’s low. It is a very
bearish indicator.
Doji
When a market’s open and close are almost at
the same price point, the candlestick resembles
a cross or plus sign.
The doji pattern conveys a struggle between
buyers and sellers that results in no net gain for
either side. It is neutral signal by itself but can
also be found in reversal patterns.
Hammer
The hammer candlestick pattern is formed of a
short body with a long lower wick and is found at
the bottom of a downward trend.
A hammer shows that although there were selling
pressures during the day, ultimately a strong
buying pressure drove the price back up.
Inverse Hammer
The only difference with the hammer is that the
upper wick is long, while the lower wick is short.
It indicates a buying pressure, followed by a
selling pressure that was not strong enough to
drive the market price down. The inverse
hammer suggests that buyers will soon have
control of the market.
Bullish Engulfing
The bullish engulfing pattern is formed of two
candlesticks. The first candle is a short red
body that is completely engulfed by a larger
green candle.
Though the second day opens lower than the
first, the bullish market pushes the price up.
Morning star
The morning star candlestick pattern is
considered a sign of hope in a bleak market
downtrend. It is a three-stick pattern: one short-
bodied candle between a long red and a long
green.
It signals that the selling pressure of the first
day is subsiding, and a bull market is on the
horizon.
Three white soldiers
The three white soldiers pattern occurs over
three time periods. It consists of consecutive
long green candles with small wicks, which
open and close progressively higher than the
previous day.
It is a very strong bullish signal that occurs
after a downtrend and shows a steady
advance of buying pressure.
Piercing line
The piercing line is a two-stick pattern,
made up of a long red candle, followed by a
long green candle.
There is usually a significant gap down
between the first candlestick’s closing price,
and the green candlestick’s opening. It
indicates a strong buying pressure, as the
price is pushed up to or above the mid-price
of the previous day.
Hanging man
The hanging man is the bearish equivalent of
a hammer; it has the same shape but forms at
the end of an uptrend.
It indicates that there was a significant sell-off
during the day, but that buyers were able to
push the price up again. The large sell-off is
often seen as an indication that the bulls are
losing control of the market.
Bearish Engulfing
A bearish engulfing pattern occurs at the end of
an uptrend. The first candle has a small green
body that is engulfed by a subsequent long red
candle.
It signifies a peak or slowdown of price
movement and is a sign of an impending
market downturn. The lower the second candle
goes, the more significant the trend is likely to
be.
Shooting Star
The shooting star is the same shape as the
inverted hammer but is formed in an uptrend: it
has a small lower body, and a long upper wick.
Usually, the market will gap slightly higher on
opening and rally to an intra-day high before
closing at a price just above the open – like a
star falling to the ground.
Evening Star
The evening star is a three-candlestick pattern
that is the equivalent of the bullish morning
star. It is formed of a short candle sandwiched
between a long green candle and a large red
candlestick.
It indicates the reversal of an uptrend and is
particularly strong when the third candlestick
erases the gains of the first candle.

More Related Content

What's hot

Techincal analysis chart patterns part 2
Techincal analysis chart patterns part 2Techincal analysis chart patterns part 2
Techincal analysis chart patterns part 2Indranil Bhattacharjee
 
Scalping in Day Trading
Scalping in Day TradingScalping in Day Trading
Scalping in Day TradingInvestingTips
 
Stock chart-Chart patterns and formations-Analysis of chart pattern
Stock chart-Chart patterns and formations-Analysis of chart patternStock chart-Chart patterns and formations-Analysis of chart pattern
Stock chart-Chart patterns and formations-Analysis of chart patternAkbarAli309
 
LC's Forex Trading System
LC's Forex Trading SystemLC's Forex Trading System
LC's Forex Trading Systemlcchong76
 
Forex Trading - How to Create a Trading Strategy
Forex Trading - How to Create a Trading StrategyForex Trading - How to Create a Trading Strategy
Forex Trading - How to Create a Trading StrategyBlueMax Capital
 
Trade like pro supply & demand
Trade like pro supply & demandTrade like pro supply & demand
Trade like pro supply & demandalkaserr
 
Trade what you see not what you think
Trade what you see not what you thinkTrade what you see not what you think
Trade what you see not what you thinkNinja Tan
 
Stop Trading Support And Resistance The Wrong Way
Stop Trading Support And Resistance The Wrong WayStop Trading Support And Resistance The Wrong Way
Stop Trading Support And Resistance The Wrong WayNetpicksTrading
 
Candlestick presentation
Candlestick presentationCandlestick presentation
Candlestick presentationJenn Astwood
 
What are Key Chart Levels and How to Trade Them
What are Key Chart Levels and How to Trade ThemWhat are Key Chart Levels and How to Trade Them
What are Key Chart Levels and How to Trade Them My Trading Skills
 
How to Identify and Draw Support and Resistance Levels on Any Chart
How to Identify and Draw Support and Resistance Levels on Any ChartHow to Identify and Draw Support and Resistance Levels on Any Chart
How to Identify and Draw Support and Resistance Levels on Any Chart My Trading Skills
 
Binary Options-STEALTH-Trading-Strategy
Binary Options-STEALTH-Trading-StrategyBinary Options-STEALTH-Trading-Strategy
Binary Options-STEALTH-Trading-StrategyMichael Selim
 
Introduction to Technical Analysis
Introduction to Technical AnalysisIntroduction to Technical Analysis
Introduction to Technical Analysismediafin
 
Best Swing Trading Indicators and Oscillators
Best Swing Trading Indicators and OscillatorsBest Swing Trading Indicators and Oscillators
Best Swing Trading Indicators and OscillatorsSwingTradingBootCamp
 
MFI and Supertrend Indicators
MFI and Supertrend IndicatorsMFI and Supertrend Indicators
MFI and Supertrend IndicatorsDhruvKothari13
 
Understanding Japanese Candlesticks in Forex Trading by valentino heavens
Understanding Japanese Candlesticks in Forex Trading by valentino heavensUnderstanding Japanese Candlesticks in Forex Trading by valentino heavens
Understanding Japanese Candlesticks in Forex Trading by valentino heavensValentino Heavens
 

What's hot (20)

Techincal analysis chart patterns part 2
Techincal analysis chart patterns part 2Techincal analysis chart patterns part 2
Techincal analysis chart patterns part 2
 
Scalping in Day Trading
Scalping in Day TradingScalping in Day Trading
Scalping in Day Trading
 
Stock chart-Chart patterns and formations-Analysis of chart pattern
Stock chart-Chart patterns and formations-Analysis of chart patternStock chart-Chart patterns and formations-Analysis of chart pattern
Stock chart-Chart patterns and formations-Analysis of chart pattern
 
LC's Forex Trading System
LC's Forex Trading SystemLC's Forex Trading System
LC's Forex Trading System
 
Forex Trading - How to Create a Trading Strategy
Forex Trading - How to Create a Trading StrategyForex Trading - How to Create a Trading Strategy
Forex Trading - How to Create a Trading Strategy
 
Trade like pro supply & demand
Trade like pro supply & demandTrade like pro supply & demand
Trade like pro supply & demand
 
Trade what you see not what you think
Trade what you see not what you thinkTrade what you see not what you think
Trade what you see not what you think
 
Stop Trading Support And Resistance The Wrong Way
Stop Trading Support And Resistance The Wrong WayStop Trading Support And Resistance The Wrong Way
Stop Trading Support And Resistance The Wrong Way
 
Psychology of traders
Psychology of tradersPsychology of traders
Psychology of traders
 
The Technical Analysis Guidebook
The Technical Analysis GuidebookThe Technical Analysis Guidebook
The Technical Analysis Guidebook
 
RSI Strategy
RSI StrategyRSI Strategy
RSI Strategy
 
Candlestick presentation
Candlestick presentationCandlestick presentation
Candlestick presentation
 
What are Key Chart Levels and How to Trade Them
What are Key Chart Levels and How to Trade ThemWhat are Key Chart Levels and How to Trade Them
What are Key Chart Levels and How to Trade Them
 
How to Identify and Draw Support and Resistance Levels on Any Chart
How to Identify and Draw Support and Resistance Levels on Any ChartHow to Identify and Draw Support and Resistance Levels on Any Chart
How to Identify and Draw Support and Resistance Levels on Any Chart
 
Binary Options-STEALTH-Trading-Strategy
Binary Options-STEALTH-Trading-StrategyBinary Options-STEALTH-Trading-Strategy
Binary Options-STEALTH-Trading-Strategy
 
Introduction to Technical Analysis
Introduction to Technical AnalysisIntroduction to Technical Analysis
Introduction to Technical Analysis
 
Best Swing Trading Indicators and Oscillators
Best Swing Trading Indicators and OscillatorsBest Swing Trading Indicators and Oscillators
Best Swing Trading Indicators and Oscillators
 
MFI and Supertrend Indicators
MFI and Supertrend IndicatorsMFI and Supertrend Indicators
MFI and Supertrend Indicators
 
Understanding Japanese Candlesticks in Forex Trading by valentino heavens
Understanding Japanese Candlesticks in Forex Trading by valentino heavensUnderstanding Japanese Candlesticks in Forex Trading by valentino heavens
Understanding Japanese Candlesticks in Forex Trading by valentino heavens
 
634268797027443776(1)
634268797027443776(1)634268797027443776(1)
634268797027443776(1)
 

Similar to Technical analysis finance

Best 30 Candlestick Pattern You Should Have To Know
Best 30 Candlestick Pattern You Should Have To KnowBest 30 Candlestick Pattern You Should Have To Know
Best 30 Candlestick Pattern You Should Have To KnowStockia
 
QNBFS Daily Technical Trader - Qatar for February 07, 2018 التحليل الفني اليو...
QNBFS Daily Technical Trader - Qatar for February 07, 2018 التحليل الفني اليو...QNBFS Daily Technical Trader - Qatar for February 07, 2018 التحليل الفني اليو...
QNBFS Daily Technical Trader - Qatar for February 07, 2018 التحليل الفني اليو...Aicha El-Mamy
 
QNBFS Daily Technical Trader Qatar - October 23 2019 التحليل الفني اليومي لبو...
QNBFS Daily Technical Trader Qatar - October 23 2019 التحليل الفني اليومي لبو...QNBFS Daily Technical Trader Qatar - October 23 2019 التحليل الفني اليومي لبو...
QNBFS Daily Technical Trader Qatar - October 23 2019 التحليل الفني اليومي لبو...QNB Group
 
How to read japanese candlesticks
How to read japanese candlesticksHow to read japanese candlesticks
How to read japanese candlesticksJustForex
 
QNBFS Daily Technical Trader Qatar - October 30 2019 التحليل الفني اليومي لبو...
QNBFS Daily Technical Trader Qatar - October 30 2019 التحليل الفني اليومي لبو...QNBFS Daily Technical Trader Qatar - October 30 2019 التحليل الفني اليومي لبو...
QNBFS Daily Technical Trader Qatar - October 30 2019 التحليل الفني اليومي لبو...QNB Group
 
Kishore Mirchumal Mansinghani
Kishore Mirchumal MansinghaniKishore Mirchumal Mansinghani
Kishore Mirchumal MansinghaniPowerup Capital
 
QNBFS Daily Technical Trader Qatar - September 14, 2021 التحليل الفني اليومي ...
QNBFS Daily Technical Trader Qatar - September 14, 2021 التحليل الفني اليومي ...QNBFS Daily Technical Trader Qatar - September 14, 2021 التحليل الفني اليومي ...
QNBFS Daily Technical Trader Qatar - September 14, 2021 التحليل الفني اليومي ...QNB Group
 
QNBFS Daily Technical Trader Qatar - November 21 2019 التحليل الفني اليومي لب...
QNBFS Daily Technical Trader Qatar - November 21 2019 التحليل الفني اليومي لب...QNBFS Daily Technical Trader Qatar - November 21 2019 التحليل الفني اليومي لب...
QNBFS Daily Technical Trader Qatar - November 21 2019 التحليل الفني اليومي لب...QNB Group
 
QNBFS Daily Technical Trader Qatar - October 31 2019 التحليل الفني اليومي لبو...
QNBFS Daily Technical Trader Qatar - October 31 2019 التحليل الفني اليومي لبو...QNBFS Daily Technical Trader Qatar - October 31 2019 التحليل الفني اليومي لبو...
QNBFS Daily Technical Trader Qatar - October 31 2019 التحليل الفني اليومي لبو...QNB Group
 
QNBFS Daily Technical Trader Qatar - November 24 2019 التحليل الفني اليومي لب...
QNBFS Daily Technical Trader Qatar - November 24 2019 التحليل الفني اليومي لب...QNBFS Daily Technical Trader Qatar - November 24 2019 التحليل الفني اليومي لب...
QNBFS Daily Technical Trader Qatar - November 24 2019 التحليل الفني اليومي لب...QNB Group
 
Technical analysis for begineers 101
Technical analysis for begineers 101Technical analysis for begineers 101
Technical analysis for begineers 101LimSzeYee
 
QNBFS Daily Technical Trader Qatar - November 27 2019 التحليل الفني اليومي لب...
QNBFS Daily Technical Trader Qatar - November 27 2019 التحليل الفني اليومي لب...QNBFS Daily Technical Trader Qatar - November 27 2019 التحليل الفني اليومي لب...
QNBFS Daily Technical Trader Qatar - November 27 2019 التحليل الفني اليومي لب...QNB Group
 
QNBFS Daily Technical Trader Qatar - November 11 2019 التحليل الفني اليومي لب...
QNBFS Daily Technical Trader Qatar - November 11 2019 التحليل الفني اليومي لب...QNBFS Daily Technical Trader Qatar - November 11 2019 التحليل الفني اليومي لب...
QNBFS Daily Technical Trader Qatar - November 11 2019 التحليل الفني اليومي لب...QNB Group
 
QNBFS Daily Technical Trader Qatar - September 07, 2021 التحليل الفني اليومي ...
QNBFS Daily Technical Trader Qatar - September 07, 2021 التحليل الفني اليومي ...QNBFS Daily Technical Trader Qatar - September 07, 2021 التحليل الفني اليومي ...
QNBFS Daily Technical Trader Qatar - September 07, 2021 التحليل الفني اليومي ...QNB Group
 
QNBFS Daily Technical Trader Qatar - November 17 2019 التحليل الفني اليومي لب...
QNBFS Daily Technical Trader Qatar - November 17 2019 التحليل الفني اليومي لب...QNBFS Daily Technical Trader Qatar - November 17 2019 التحليل الفني اليومي لب...
QNBFS Daily Technical Trader Qatar - November 17 2019 التحليل الفني اليومي لب...QNB Group
 
Forex Trading - How to Create a Trading Strategy | Different Candle Stick Pat...
Forex Trading - How to Create a Trading Strategy | Different Candle Stick Pat...Forex Trading - How to Create a Trading Strategy | Different Candle Stick Pat...
Forex Trading - How to Create a Trading Strategy | Different Candle Stick Pat...BlueMax Capital
 
QNBFS Daily Technical Trader Qatar - October 22 2019 التحليل الفني اليومي لبو...
QNBFS Daily Technical Trader Qatar - October 22 2019 التحليل الفني اليومي لبو...QNBFS Daily Technical Trader Qatar - October 22 2019 التحليل الفني اليومي لبو...
QNBFS Daily Technical Trader Qatar - October 22 2019 التحليل الفني اليومي لبو...QNB Group
 
QNBFS Daily Technical Trader Qatar - October 21 2019 التحليل الفني اليومي لبو...
QNBFS Daily Technical Trader Qatar - October 21 2019 التحليل الفني اليومي لبو...QNBFS Daily Technical Trader Qatar - October 21 2019 التحليل الفني اليومي لبو...
QNBFS Daily Technical Trader Qatar - October 21 2019 التحليل الفني اليومي لبو...QNB Group
 
QNBFS Daily Technical Trader Qatar - October 20 2019 التحليل الفني اليومي لبو...
QNBFS Daily Technical Trader Qatar - October 20 2019 التحليل الفني اليومي لبو...QNBFS Daily Technical Trader Qatar - October 20 2019 التحليل الفني اليومي لبو...
QNBFS Daily Technical Trader Qatar - October 20 2019 التحليل الفني اليومي لبو...QNB Group
 

Similar to Technical analysis finance (20)

Best 30 Candlestick Pattern You Should Have To Know
Best 30 Candlestick Pattern You Should Have To KnowBest 30 Candlestick Pattern You Should Have To Know
Best 30 Candlestick Pattern You Should Have To Know
 
QNBFS Daily Technical Trader - Qatar for February 07, 2018 التحليل الفني اليو...
QNBFS Daily Technical Trader - Qatar for February 07, 2018 التحليل الفني اليو...QNBFS Daily Technical Trader - Qatar for February 07, 2018 التحليل الفني اليو...
QNBFS Daily Technical Trader - Qatar for February 07, 2018 التحليل الفني اليو...
 
QNBFS Daily Technical Trader Qatar - October 23 2019 التحليل الفني اليومي لبو...
QNBFS Daily Technical Trader Qatar - October 23 2019 التحليل الفني اليومي لبو...QNBFS Daily Technical Trader Qatar - October 23 2019 التحليل الفني اليومي لبو...
QNBFS Daily Technical Trader Qatar - October 23 2019 التحليل الفني اليومي لبو...
 
How to read japanese candlesticks
How to read japanese candlesticksHow to read japanese candlesticks
How to read japanese candlesticks
 
QNBFS Daily Technical Trader Qatar - October 30 2019 التحليل الفني اليومي لبو...
QNBFS Daily Technical Trader Qatar - October 30 2019 التحليل الفني اليومي لبو...QNBFS Daily Technical Trader Qatar - October 30 2019 التحليل الفني اليومي لبو...
QNBFS Daily Technical Trader Qatar - October 30 2019 التحليل الفني اليومي لبو...
 
Kishore Mirchumal Mansinghani
Kishore Mirchumal MansinghaniKishore Mirchumal Mansinghani
Kishore Mirchumal Mansinghani
 
QNBFS Daily Technical Trader Qatar - September 14, 2021 التحليل الفني اليومي ...
QNBFS Daily Technical Trader Qatar - September 14, 2021 التحليل الفني اليومي ...QNBFS Daily Technical Trader Qatar - September 14, 2021 التحليل الفني اليومي ...
QNBFS Daily Technical Trader Qatar - September 14, 2021 التحليل الفني اليومي ...
 
Investor Education
Investor EducationInvestor Education
Investor Education
 
QNBFS Daily Technical Trader Qatar - November 21 2019 التحليل الفني اليومي لب...
QNBFS Daily Technical Trader Qatar - November 21 2019 التحليل الفني اليومي لب...QNBFS Daily Technical Trader Qatar - November 21 2019 التحليل الفني اليومي لب...
QNBFS Daily Technical Trader Qatar - November 21 2019 التحليل الفني اليومي لب...
 
QNBFS Daily Technical Trader Qatar - October 31 2019 التحليل الفني اليومي لبو...
QNBFS Daily Technical Trader Qatar - October 31 2019 التحليل الفني اليومي لبو...QNBFS Daily Technical Trader Qatar - October 31 2019 التحليل الفني اليومي لبو...
QNBFS Daily Technical Trader Qatar - October 31 2019 التحليل الفني اليومي لبو...
 
QNBFS Daily Technical Trader Qatar - November 24 2019 التحليل الفني اليومي لب...
QNBFS Daily Technical Trader Qatar - November 24 2019 التحليل الفني اليومي لب...QNBFS Daily Technical Trader Qatar - November 24 2019 التحليل الفني اليومي لب...
QNBFS Daily Technical Trader Qatar - November 24 2019 التحليل الفني اليومي لب...
 
Technical analysis for begineers 101
Technical analysis for begineers 101Technical analysis for begineers 101
Technical analysis for begineers 101
 
QNBFS Daily Technical Trader Qatar - November 27 2019 التحليل الفني اليومي لب...
QNBFS Daily Technical Trader Qatar - November 27 2019 التحليل الفني اليومي لب...QNBFS Daily Technical Trader Qatar - November 27 2019 التحليل الفني اليومي لب...
QNBFS Daily Technical Trader Qatar - November 27 2019 التحليل الفني اليومي لب...
 
QNBFS Daily Technical Trader Qatar - November 11 2019 التحليل الفني اليومي لب...
QNBFS Daily Technical Trader Qatar - November 11 2019 التحليل الفني اليومي لب...QNBFS Daily Technical Trader Qatar - November 11 2019 التحليل الفني اليومي لب...
QNBFS Daily Technical Trader Qatar - November 11 2019 التحليل الفني اليومي لب...
 
QNBFS Daily Technical Trader Qatar - September 07, 2021 التحليل الفني اليومي ...
QNBFS Daily Technical Trader Qatar - September 07, 2021 التحليل الفني اليومي ...QNBFS Daily Technical Trader Qatar - September 07, 2021 التحليل الفني اليومي ...
QNBFS Daily Technical Trader Qatar - September 07, 2021 التحليل الفني اليومي ...
 
QNBFS Daily Technical Trader Qatar - November 17 2019 التحليل الفني اليومي لب...
QNBFS Daily Technical Trader Qatar - November 17 2019 التحليل الفني اليومي لب...QNBFS Daily Technical Trader Qatar - November 17 2019 التحليل الفني اليومي لب...
QNBFS Daily Technical Trader Qatar - November 17 2019 التحليل الفني اليومي لب...
 
Forex Trading - How to Create a Trading Strategy | Different Candle Stick Pat...
Forex Trading - How to Create a Trading Strategy | Different Candle Stick Pat...Forex Trading - How to Create a Trading Strategy | Different Candle Stick Pat...
Forex Trading - How to Create a Trading Strategy | Different Candle Stick Pat...
 
QNBFS Daily Technical Trader Qatar - October 22 2019 التحليل الفني اليومي لبو...
QNBFS Daily Technical Trader Qatar - October 22 2019 التحليل الفني اليومي لبو...QNBFS Daily Technical Trader Qatar - October 22 2019 التحليل الفني اليومي لبو...
QNBFS Daily Technical Trader Qatar - October 22 2019 التحليل الفني اليومي لبو...
 
QNBFS Daily Technical Trader Qatar - October 21 2019 التحليل الفني اليومي لبو...
QNBFS Daily Technical Trader Qatar - October 21 2019 التحليل الفني اليومي لبو...QNBFS Daily Technical Trader Qatar - October 21 2019 التحليل الفني اليومي لبو...
QNBFS Daily Technical Trader Qatar - October 21 2019 التحليل الفني اليومي لبو...
 
QNBFS Daily Technical Trader Qatar - October 20 2019 التحليل الفني اليومي لبو...
QNBFS Daily Technical Trader Qatar - October 20 2019 التحليل الفني اليومي لبو...QNBFS Daily Technical Trader Qatar - October 20 2019 التحليل الفني اليومي لبو...
QNBFS Daily Technical Trader Qatar - October 20 2019 التحليل الفني اليومي لبو...
 

Recently uploaded

KSHARA STURA .pptx---KSHARA KARMA THERAPY (CAUSTIC THERAPY)————IMP.OF KSHARA ...
KSHARA STURA .pptx---KSHARA KARMA THERAPY (CAUSTIC THERAPY)————IMP.OF KSHARA ...KSHARA STURA .pptx---KSHARA KARMA THERAPY (CAUSTIC THERAPY)————IMP.OF KSHARA ...
KSHARA STURA .pptx---KSHARA KARMA THERAPY (CAUSTIC THERAPY)————IMP.OF KSHARA ...M56BOOKSTORE PRODUCT/SERVICE
 
Introduction to ArtificiaI Intelligence in Higher Education
Introduction to ArtificiaI Intelligence in Higher EducationIntroduction to ArtificiaI Intelligence in Higher Education
Introduction to ArtificiaI Intelligence in Higher Educationpboyjonauth
 
Presiding Officer Training module 2024 lok sabha elections
Presiding Officer Training module 2024 lok sabha electionsPresiding Officer Training module 2024 lok sabha elections
Presiding Officer Training module 2024 lok sabha electionsanshu789521
 
POINT- BIOCHEMISTRY SEM 2 ENZYMES UNIT 5.pptx
POINT- BIOCHEMISTRY SEM 2 ENZYMES UNIT 5.pptxPOINT- BIOCHEMISTRY SEM 2 ENZYMES UNIT 5.pptx
POINT- BIOCHEMISTRY SEM 2 ENZYMES UNIT 5.pptxSayali Powar
 
“Oh GOSH! Reflecting on Hackteria's Collaborative Practices in a Global Do-It...
“Oh GOSH! Reflecting on Hackteria's Collaborative Practices in a Global Do-It...“Oh GOSH! Reflecting on Hackteria's Collaborative Practices in a Global Do-It...
“Oh GOSH! Reflecting on Hackteria's Collaborative Practices in a Global Do-It...Marc Dusseiller Dusjagr
 
Enzyme, Pharmaceutical Aids, Miscellaneous Last Part of Chapter no 5th.pdf
Enzyme, Pharmaceutical Aids, Miscellaneous Last Part of Chapter no 5th.pdfEnzyme, Pharmaceutical Aids, Miscellaneous Last Part of Chapter no 5th.pdf
Enzyme, Pharmaceutical Aids, Miscellaneous Last Part of Chapter no 5th.pdfSumit Tiwari
 
Accessible design: Minimum effort, maximum impact
Accessible design: Minimum effort, maximum impactAccessible design: Minimum effort, maximum impact
Accessible design: Minimum effort, maximum impactdawncurless
 
Alper Gobel In Media Res Media Component
Alper Gobel In Media Res Media ComponentAlper Gobel In Media Res Media Component
Alper Gobel In Media Res Media ComponentInMediaRes1
 
Paris 2024 Olympic Geographies - an activity
Paris 2024 Olympic Geographies - an activityParis 2024 Olympic Geographies - an activity
Paris 2024 Olympic Geographies - an activityGeoBlogs
 
Mastering the Unannounced Regulatory Inspection
Mastering the Unannounced Regulatory InspectionMastering the Unannounced Regulatory Inspection
Mastering the Unannounced Regulatory InspectionSafetyChain Software
 
Concept of Vouching. B.Com(Hons) /B.Compdf
Concept of Vouching. B.Com(Hons) /B.CompdfConcept of Vouching. B.Com(Hons) /B.Compdf
Concept of Vouching. B.Com(Hons) /B.CompdfUmakantAnnand
 
A Critique of the Proposed National Education Policy Reform
A Critique of the Proposed National Education Policy ReformA Critique of the Proposed National Education Policy Reform
A Critique of the Proposed National Education Policy ReformChameera Dedduwage
 
Software Engineering Methodologies (overview)
Software Engineering Methodologies (overview)Software Engineering Methodologies (overview)
Software Engineering Methodologies (overview)eniolaolutunde
 
Call Girls in Dwarka Mor Delhi Contact Us 9654467111
Call Girls in Dwarka Mor Delhi Contact Us 9654467111Call Girls in Dwarka Mor Delhi Contact Us 9654467111
Call Girls in Dwarka Mor Delhi Contact Us 9654467111Sapana Sha
 
The Most Excellent Way | 1 Corinthians 13
The Most Excellent Way | 1 Corinthians 13The Most Excellent Way | 1 Corinthians 13
The Most Excellent Way | 1 Corinthians 13Steve Thomason
 
Incoming and Outgoing Shipments in 1 STEP Using Odoo 17
Incoming and Outgoing Shipments in 1 STEP Using Odoo 17Incoming and Outgoing Shipments in 1 STEP Using Odoo 17
Incoming and Outgoing Shipments in 1 STEP Using Odoo 17Celine George
 
Interactive Powerpoint_How to Master effective communication
Interactive Powerpoint_How to Master effective communicationInteractive Powerpoint_How to Master effective communication
Interactive Powerpoint_How to Master effective communicationnomboosow
 
call girls in Kamla Market (DELHI) 🔝 >༒9953330565🔝 genuine Escort Service 🔝✔️✔️
call girls in Kamla Market (DELHI) 🔝 >༒9953330565🔝 genuine Escort Service 🔝✔️✔️call girls in Kamla Market (DELHI) 🔝 >༒9953330565🔝 genuine Escort Service 🔝✔️✔️
call girls in Kamla Market (DELHI) 🔝 >༒9953330565🔝 genuine Escort Service 🔝✔️✔️9953056974 Low Rate Call Girls In Saket, Delhi NCR
 
Separation of Lanthanides/ Lanthanides and Actinides
Separation of Lanthanides/ Lanthanides and ActinidesSeparation of Lanthanides/ Lanthanides and Actinides
Separation of Lanthanides/ Lanthanides and ActinidesFatimaKhan178732
 

Recently uploaded (20)

KSHARA STURA .pptx---KSHARA KARMA THERAPY (CAUSTIC THERAPY)————IMP.OF KSHARA ...
KSHARA STURA .pptx---KSHARA KARMA THERAPY (CAUSTIC THERAPY)————IMP.OF KSHARA ...KSHARA STURA .pptx---KSHARA KARMA THERAPY (CAUSTIC THERAPY)————IMP.OF KSHARA ...
KSHARA STURA .pptx---KSHARA KARMA THERAPY (CAUSTIC THERAPY)————IMP.OF KSHARA ...
 
Introduction to ArtificiaI Intelligence in Higher Education
Introduction to ArtificiaI Intelligence in Higher EducationIntroduction to ArtificiaI Intelligence in Higher Education
Introduction to ArtificiaI Intelligence in Higher Education
 
Presiding Officer Training module 2024 lok sabha elections
Presiding Officer Training module 2024 lok sabha electionsPresiding Officer Training module 2024 lok sabha elections
Presiding Officer Training module 2024 lok sabha elections
 
POINT- BIOCHEMISTRY SEM 2 ENZYMES UNIT 5.pptx
POINT- BIOCHEMISTRY SEM 2 ENZYMES UNIT 5.pptxPOINT- BIOCHEMISTRY SEM 2 ENZYMES UNIT 5.pptx
POINT- BIOCHEMISTRY SEM 2 ENZYMES UNIT 5.pptx
 
“Oh GOSH! Reflecting on Hackteria's Collaborative Practices in a Global Do-It...
“Oh GOSH! Reflecting on Hackteria's Collaborative Practices in a Global Do-It...“Oh GOSH! Reflecting on Hackteria's Collaborative Practices in a Global Do-It...
“Oh GOSH! Reflecting on Hackteria's Collaborative Practices in a Global Do-It...
 
Enzyme, Pharmaceutical Aids, Miscellaneous Last Part of Chapter no 5th.pdf
Enzyme, Pharmaceutical Aids, Miscellaneous Last Part of Chapter no 5th.pdfEnzyme, Pharmaceutical Aids, Miscellaneous Last Part of Chapter no 5th.pdf
Enzyme, Pharmaceutical Aids, Miscellaneous Last Part of Chapter no 5th.pdf
 
Accessible design: Minimum effort, maximum impact
Accessible design: Minimum effort, maximum impactAccessible design: Minimum effort, maximum impact
Accessible design: Minimum effort, maximum impact
 
Alper Gobel In Media Res Media Component
Alper Gobel In Media Res Media ComponentAlper Gobel In Media Res Media Component
Alper Gobel In Media Res Media Component
 
Paris 2024 Olympic Geographies - an activity
Paris 2024 Olympic Geographies - an activityParis 2024 Olympic Geographies - an activity
Paris 2024 Olympic Geographies - an activity
 
Mastering the Unannounced Regulatory Inspection
Mastering the Unannounced Regulatory InspectionMastering the Unannounced Regulatory Inspection
Mastering the Unannounced Regulatory Inspection
 
Código Creativo y Arte de Software | Unidad 1
Código Creativo y Arte de Software | Unidad 1Código Creativo y Arte de Software | Unidad 1
Código Creativo y Arte de Software | Unidad 1
 
Concept of Vouching. B.Com(Hons) /B.Compdf
Concept of Vouching. B.Com(Hons) /B.CompdfConcept of Vouching. B.Com(Hons) /B.Compdf
Concept of Vouching. B.Com(Hons) /B.Compdf
 
A Critique of the Proposed National Education Policy Reform
A Critique of the Proposed National Education Policy ReformA Critique of the Proposed National Education Policy Reform
A Critique of the Proposed National Education Policy Reform
 
Software Engineering Methodologies (overview)
Software Engineering Methodologies (overview)Software Engineering Methodologies (overview)
Software Engineering Methodologies (overview)
 
Call Girls in Dwarka Mor Delhi Contact Us 9654467111
Call Girls in Dwarka Mor Delhi Contact Us 9654467111Call Girls in Dwarka Mor Delhi Contact Us 9654467111
Call Girls in Dwarka Mor Delhi Contact Us 9654467111
 
The Most Excellent Way | 1 Corinthians 13
The Most Excellent Way | 1 Corinthians 13The Most Excellent Way | 1 Corinthians 13
The Most Excellent Way | 1 Corinthians 13
 
Incoming and Outgoing Shipments in 1 STEP Using Odoo 17
Incoming and Outgoing Shipments in 1 STEP Using Odoo 17Incoming and Outgoing Shipments in 1 STEP Using Odoo 17
Incoming and Outgoing Shipments in 1 STEP Using Odoo 17
 
Interactive Powerpoint_How to Master effective communication
Interactive Powerpoint_How to Master effective communicationInteractive Powerpoint_How to Master effective communication
Interactive Powerpoint_How to Master effective communication
 
call girls in Kamla Market (DELHI) 🔝 >༒9953330565🔝 genuine Escort Service 🔝✔️✔️
call girls in Kamla Market (DELHI) 🔝 >༒9953330565🔝 genuine Escort Service 🔝✔️✔️call girls in Kamla Market (DELHI) 🔝 >༒9953330565🔝 genuine Escort Service 🔝✔️✔️
call girls in Kamla Market (DELHI) 🔝 >༒9953330565🔝 genuine Escort Service 🔝✔️✔️
 
Separation of Lanthanides/ Lanthanides and Actinides
Separation of Lanthanides/ Lanthanides and ActinidesSeparation of Lanthanides/ Lanthanides and Actinides
Separation of Lanthanides/ Lanthanides and Actinides
 

Technical analysis finance

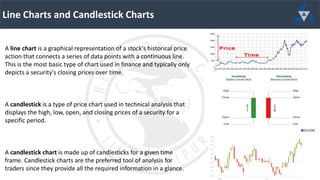
  • 1. Line Charts and Candlestick Charts A line chart is a graphical representation of a stock's historical price action that connects a series of data points with a continuous line. This is the most basic type of chart used in finance and typically only depicts a security's closing prices over time. A candlestick is a type of price chart used in technical analysis that displays the high, low, open, and closing prices of a security for a specific period. A candlestick chart is made up of candlesticks for a given time frame. Candlestick charts are the preferred tool of analysis for traders since they provide all the required information in a glance.
  • 2. Price Action Terms Price action: It is the movement of a security's price plotted over time. Price action forms the basis for all technical analysis of a stock. Many short-term traders rely exclusively on price action and the formations and trends extrapolated from it to make trading decisions. Support: A support level is a level where the price tends to find support as it falls. This means that the price is more likely to "bounce" off this level rather than break through it. However, once the price has breached this level, by an amount exceeding some noise, it is likely to continue falling until meeting another support level. Resistance: A resistance level is the opposite of a support level. It is where the price tends to find resistance as it rises. Again, this means that the price is more likely to "bounce" off this level rather than break through it. However, once the price has breached this level, by an amount exceeding some noise, it is likely to continue rising until meeting another resistance level. Stoploss: A stop-loss is designed to limit an investor's loss on a security position that makes an unfavorable move. It is generally a pre-set price below the buy price or above the sell price at which the trader decides to square off positions at a loss.
  • 3. Marubozu The green Marubozu indicates that the stock price moved up through the day with the opening price near the day’s low and closing price near the day’s high. It is a very bullish indicator. The red Marubozu indicates that the stock price fell through the day with the opening price near the day’s high and closing price near the day’s low. It is a very bearish indicator. Doji When a market’s open and close are almost at the same price point, the candlestick resembles a cross or plus sign. The doji pattern conveys a struggle between buyers and sellers that results in no net gain for either side. It is neutral signal by itself but can also be found in reversal patterns.
  • 4. Hammer The hammer candlestick pattern is formed of a short body with a long lower wick and is found at the bottom of a downward trend. A hammer shows that although there were selling pressures during the day, ultimately a strong buying pressure drove the price back up. Inverse Hammer The only difference with the hammer is that the upper wick is long, while the lower wick is short. It indicates a buying pressure, followed by a selling pressure that was not strong enough to drive the market price down. The inverse hammer suggests that buyers will soon have control of the market.
  • 5. Bullish Engulfing The bullish engulfing pattern is formed of two candlesticks. The first candle is a short red body that is completely engulfed by a larger green candle. Though the second day opens lower than the first, the bullish market pushes the price up. Morning star The morning star candlestick pattern is considered a sign of hope in a bleak market downtrend. It is a three-stick pattern: one short- bodied candle between a long red and a long green. It signals that the selling pressure of the first day is subsiding, and a bull market is on the horizon.
  • 6. Three white soldiers The three white soldiers pattern occurs over three time periods. It consists of consecutive long green candles with small wicks, which open and close progressively higher than the previous day. It is a very strong bullish signal that occurs after a downtrend and shows a steady advance of buying pressure. Piercing line The piercing line is a two-stick pattern, made up of a long red candle, followed by a long green candle. There is usually a significant gap down between the first candlestick’s closing price, and the green candlestick’s opening. It indicates a strong buying pressure, as the price is pushed up to or above the mid-price of the previous day.
  • 7. Hanging man The hanging man is the bearish equivalent of a hammer; it has the same shape but forms at the end of an uptrend. It indicates that there was a significant sell-off during the day, but that buyers were able to push the price up again. The large sell-off is often seen as an indication that the bulls are losing control of the market. Bearish Engulfing A bearish engulfing pattern occurs at the end of an uptrend. The first candle has a small green body that is engulfed by a subsequent long red candle. It signifies a peak or slowdown of price movement and is a sign of an impending market downturn. The lower the second candle goes, the more significant the trend is likely to be.
  • 8. Shooting Star The shooting star is the same shape as the inverted hammer but is formed in an uptrend: it has a small lower body, and a long upper wick. Usually, the market will gap slightly higher on opening and rally to an intra-day high before closing at a price just above the open – like a star falling to the ground. Evening Star The evening star is a three-candlestick pattern that is the equivalent of the bullish morning star. It is formed of a short candle sandwiched between a long green candle and a large red candlestick. It indicates the reversal of an uptrend and is particularly strong when the third candlestick erases the gains of the first candle.