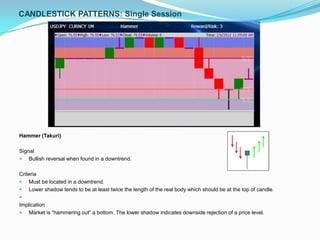
Japanese CANDLESTICKS
           “Enlightenment Through Realised Knowledge”
                     February, 2012
 Authors: Ron William MSTA, CMT & Sheba Jafari MSTA
Contents
INTRODUCTION
• Historical footprints…………………………………………………….. 3
• Why use Japanese Candlesticks?........................................................4
• Intrinsic price movement and psychology………..................................5
• Candlestick construction………...…………….……...............................6
CANDLESTICK PATTERNS Single Line
• Doji…..……………………………………………………………………....7
• Hammer………………………………………………………………..…...8
• Shooting star………..…………………………..…….…………………..10
• Hanging Man…………………..……………..……….…………..............11
Two Line
• Engulfing………………………………….………………………………..12
• Harami…………………………………….………………………………..14
• Piercing Line……………………………….………………………………16
• Dark Cloud Cover………………………………………………………....17
SUMMARY
• Candlestick Pattern “Cheat Sheet”……..……………………………....18
• Frequently Asked Questions …………………………………………....19
Historical Footprints


“Let history navigate the future”
Japanese Candlestick charting and techniques is one of the most effective ways to read price
movements in the financial market. The methodology, so called because of its similarity to a candle,
has been developed over the centuries in Eastern Asia.

It was originally used in Japan, during the Edo-period (1603-1868), to monitor and forecast price
movements of the country’s most prized commodity, rice; which was mostly traded at the Dojima
Rice Exchange near the historical commercial capital, Osaka.
Widely based on military tactics of the time, Japanese Candlestick techniques have provided
traders with an edge, long before bar and point and figure charts, while evolving into a
compelling strategy for today’s fast and volatile markets.
Why use Japanese Candlesticks?
Three key reasons to use Japanese Candlesticks:

     Visual dynamics. Japanese Candlesticks are more clear, visual and pleasing to the
     eye, than other charting tools, offering anyone from the first time user to a seasoned
     professional, an x-ray perspective of price movements and emotional health of their
     chosen market. This can be used to evaluate the market’s perception of underline
     fundamental events.


     Precision timing. Japanese Candlesticks act as a unique leading indicator, producing
     superior timing for entry and exit of trades. Reversal signals can be given in ONLY a
     few sessions, offering a critical edge over other techniques which often require several
     weeks. This is what makes Japanese Candlestick techniques a more compelling
     strategy for today’s fast and volatile markets.


     Enhances Technical Analysis techniques.        Japanese Candlesticks complements
     most other Technical Analysis techniques that you may already be using, from
     traditional trend, pattern and momentum analysis, to the more sophisticated Ichimoku
     Kinko Hyo, Demark Indicators, or Market Profile Analysis. This is simply because
     Candlestick charts use the same four trading cycle data points as bar charts –
     open, high, low, close.
Candlestick Construction
“Simple in design, powerful in application”


    A Bullish or White Candlestick implies that the
     closing price of the session was higher than the
     opening price. This means that buyers
     maintained control and prices spent more time
     pushing higher.

    A Bearish or Black Candlestick implies that the
     opening price of the session was higher than the
     closing price. This means that sellers maintained
     control and prices spent more time pushing
     lower.

    Real Body: The rectangle section of the
     Candlestick, called the „”real body‟, is the range
     between the session’s open and close. The
     “real body‟ represents overall commitment in
     the market and what Japanese chartists
     describe as “the essence of market
     psychology‟.


    Shadows: The thin lines extending out from
     Bullish/White or Bearish/Black Candlestick “real
     bodies‟, are called “shadow” (upper/lower) and
     highlight the price extremes for the session. The
     “shadows‟ also tell us where momentum was
     offset.
CANDLESTICK PATTERNS: Single Session


The Doji (Doji Bike)

Signal
 Indecision, vulnerability, uncertainty, all of which can be considered neutral or lead to a reversal.


Criteria
 The open and close are at the same level or near.


Implication
             Paramount in identifying market tops as it is a sign of an ambivalent market, where buyers and sellers
    are in balance. Less implication when located in oscillating markets where it is simply confirming a trendless
    environment.
CANDLESTICK PATTERNS: Single Session


Hammer (Takuri)

Signal
 Bullish reversal when found in a downtrend.


Criteria
 Must be located in a downtrend.
 Lower shadow tends to be at least twice the length of the real body which should be at the top of candle.

Implication
 Market is “hammering out” a bottom. The lower shadow indicates downside rejection of a price level.
CANDLESTICK PATTERNS: Single Session


Shooting Star (Nagare Boshi)

Signal
 Bearish reversal.


Criteria
 Must be located within an uptrend.
 Upper shadow tends to be at least twice the length of the real body which should be at the bottom of candle.


Implication
 Symbolizes “trouble overhead”. The upper shadow indicates upside rejection of a price level. Ideally gaps away from
    prior real body but this is not necessary.
CANDLESTICK PATTERNS: Single Session


Hanging Man (Karakasa)

Signal
 Bearish reversal.


Criteria
 Must be located in an uptrend.
 Lower shadow tends to be at least twice the length of the real body which should be at the top of candle.
 Following session needs to confirm with a bearish candle falling within 50% of initial uptrend session.


Implication
 Uptrend was dominant force, enticing a gap higher. But sellers take control and post an intraday low. This is then
    reversed higher by buyers before the end of trading. A bearish candle on the following session confirms reversal.
CANDLESTICK PATTERNS: Two Session


Engulfing (Tsutsumi)

Signal
 Bearish reversal when found in an uptrend.
 Bullish reversal when found in a downtrend.


Criteria
 Must be located within respective trend (see above).
 Second real body (open & close) engulfs prior session’s
    real body, not necessarily the shadow.
 Second candle must be white for bullish engulfing and black for bearish engulfing.


Implication
 The engulfing indicates a transition of power between buyers and sellers, with the winner overwhelms the previous
    trend.
CANDLESTICK PATTERNS: Two Session


Harami (Harami)

Signal
 Bullish reversal when found in a downtrend.
 Bearish reversal when found in an uptrend.

Criteria
 Must be located within their respective trends.
 Second real body is relatively small and contained within the prior session’s real body.

Signal

   The dominant force is losing power and potentially changing to the opposite direction. Pregnant or mother candle
    gives birth to a small candle, reversing the trend.
CANDLESTICK PATTERNS: Two Session


Piercing Line (Kirikomi)

Signal
 Bullish reversal


Criteria
 Must be located within a downtrend.
 Long bearish candle at the end of a downtrend. The following session opens lower and then reverses
    higher, within 50% of the prior session’s real body.

Implication
 Downtrend was dominant force, enticing prices to gap lower. However, before the end of trading there is a positive
    reversal, which offsets recent fall. Sellers are left questioning their position.
CANDLESTICK PATTERNS: Two Session


Dark Cloud Cover (Kabuse)

Signal
 Bearish reversal.


Criteria
 Must be located in an uptrend.
 Long bullish candle evident at the end of uptrend. The following session opens higher and then reverses lower,
    within 50% of the prior session’s real body.

Implication
 Uptrend was dominant force, enticing prices to gap higher. However, before the end of trading there is a negative
    reversal, which offsets recent rise. Those who were waiting for a short opportunity can now participate.

Japanese Candlestick

  • 1.
    Japanese CANDLESTICKS “Enlightenment Through Realised Knowledge” February, 2012 Authors: Ron William MSTA, CMT & Sheba Jafari MSTA
  • 2.
    Contents INTRODUCTION • Historical footprints……………………………………………………..3 • Why use Japanese Candlesticks?........................................................4 • Intrinsic price movement and psychology………..................................5 • Candlestick construction………...…………….……...............................6 CANDLESTICK PATTERNS Single Line • Doji…..……………………………………………………………………....7 • Hammer………………………………………………………………..…...8 • Shooting star………..…………………………..…….…………………..10 • Hanging Man…………………..……………..……….…………..............11 Two Line • Engulfing………………………………….………………………………..12 • Harami…………………………………….………………………………..14 • Piercing Line……………………………….………………………………16 • Dark Cloud Cover………………………………………………………....17 SUMMARY • Candlestick Pattern “Cheat Sheet”……..……………………………....18 • Frequently Asked Questions …………………………………………....19
  • 3.
    Historical Footprints “Let historynavigate the future” Japanese Candlestick charting and techniques is one of the most effective ways to read price movements in the financial market. The methodology, so called because of its similarity to a candle, has been developed over the centuries in Eastern Asia. It was originally used in Japan, during the Edo-period (1603-1868), to monitor and forecast price movements of the country’s most prized commodity, rice; which was mostly traded at the Dojima Rice Exchange near the historical commercial capital, Osaka. Widely based on military tactics of the time, Japanese Candlestick techniques have provided traders with an edge, long before bar and point and figure charts, while evolving into a compelling strategy for today’s fast and volatile markets.
  • 4.
    Why use JapaneseCandlesticks? Three key reasons to use Japanese Candlesticks:  Visual dynamics. Japanese Candlesticks are more clear, visual and pleasing to the eye, than other charting tools, offering anyone from the first time user to a seasoned professional, an x-ray perspective of price movements and emotional health of their chosen market. This can be used to evaluate the market’s perception of underline fundamental events.  Precision timing. Japanese Candlesticks act as a unique leading indicator, producing superior timing for entry and exit of trades. Reversal signals can be given in ONLY a few sessions, offering a critical edge over other techniques which often require several weeks. This is what makes Japanese Candlestick techniques a more compelling strategy for today’s fast and volatile markets.  Enhances Technical Analysis techniques. Japanese Candlesticks complements most other Technical Analysis techniques that you may already be using, from traditional trend, pattern and momentum analysis, to the more sophisticated Ichimoku Kinko Hyo, Demark Indicators, or Market Profile Analysis. This is simply because Candlestick charts use the same four trading cycle data points as bar charts – open, high, low, close.
  • 5.
    Candlestick Construction “Simple indesign, powerful in application”  A Bullish or White Candlestick implies that the closing price of the session was higher than the opening price. This means that buyers maintained control and prices spent more time pushing higher.  A Bearish or Black Candlestick implies that the opening price of the session was higher than the closing price. This means that sellers maintained control and prices spent more time pushing lower.  Real Body: The rectangle section of the Candlestick, called the „”real body‟, is the range between the session’s open and close. The “real body‟ represents overall commitment in the market and what Japanese chartists describe as “the essence of market psychology‟.  Shadows: The thin lines extending out from Bullish/White or Bearish/Black Candlestick “real bodies‟, are called “shadow” (upper/lower) and highlight the price extremes for the session. The “shadows‟ also tell us where momentum was offset.
  • 6.
    CANDLESTICK PATTERNS: SingleSession The Doji (Doji Bike) Signal  Indecision, vulnerability, uncertainty, all of which can be considered neutral or lead to a reversal. Criteria  The open and close are at the same level or near. Implication  Paramount in identifying market tops as it is a sign of an ambivalent market, where buyers and sellers are in balance. Less implication when located in oscillating markets where it is simply confirming a trendless environment.
  • 7.
    CANDLESTICK PATTERNS: SingleSession Hammer (Takuri) Signal  Bullish reversal when found in a downtrend. Criteria  Must be located in a downtrend.  Lower shadow tends to be at least twice the length of the real body which should be at the top of candle.  Implication  Market is “hammering out” a bottom. The lower shadow indicates downside rejection of a price level.
  • 8.
    CANDLESTICK PATTERNS: SingleSession Shooting Star (Nagare Boshi) Signal  Bearish reversal. Criteria  Must be located within an uptrend.  Upper shadow tends to be at least twice the length of the real body which should be at the bottom of candle. Implication  Symbolizes “trouble overhead”. The upper shadow indicates upside rejection of a price level. Ideally gaps away from prior real body but this is not necessary.
  • 9.
    CANDLESTICK PATTERNS: SingleSession Hanging Man (Karakasa) Signal  Bearish reversal. Criteria  Must be located in an uptrend.  Lower shadow tends to be at least twice the length of the real body which should be at the top of candle.  Following session needs to confirm with a bearish candle falling within 50% of initial uptrend session. Implication  Uptrend was dominant force, enticing a gap higher. But sellers take control and post an intraday low. This is then reversed higher by buyers before the end of trading. A bearish candle on the following session confirms reversal.
  • 10.
    CANDLESTICK PATTERNS: TwoSession Engulfing (Tsutsumi) Signal  Bearish reversal when found in an uptrend.  Bullish reversal when found in a downtrend. Criteria  Must be located within respective trend (see above).  Second real body (open & close) engulfs prior session’s real body, not necessarily the shadow.  Second candle must be white for bullish engulfing and black for bearish engulfing. Implication  The engulfing indicates a transition of power between buyers and sellers, with the winner overwhelms the previous trend.
  • 11.
    CANDLESTICK PATTERNS: TwoSession Harami (Harami) Signal  Bullish reversal when found in a downtrend.  Bearish reversal when found in an uptrend. Criteria  Must be located within their respective trends.  Second real body is relatively small and contained within the prior session’s real body. Signal  The dominant force is losing power and potentially changing to the opposite direction. Pregnant or mother candle gives birth to a small candle, reversing the trend.
  • 12.
    CANDLESTICK PATTERNS: TwoSession Piercing Line (Kirikomi) Signal  Bullish reversal Criteria  Must be located within a downtrend.  Long bearish candle at the end of a downtrend. The following session opens lower and then reverses higher, within 50% of the prior session’s real body. Implication  Downtrend was dominant force, enticing prices to gap lower. However, before the end of trading there is a positive reversal, which offsets recent fall. Sellers are left questioning their position.
  • 13.
    CANDLESTICK PATTERNS: TwoSession Dark Cloud Cover (Kabuse) Signal  Bearish reversal. Criteria  Must be located in an uptrend.  Long bullish candle evident at the end of uptrend. The following session opens higher and then reverses lower, within 50% of the prior session’s real body. Implication  Uptrend was dominant force, enticing prices to gap higher. However, before the end of trading there is a negative reversal, which offsets recent rise. Those who were waiting for a short opportunity can now participate.