Download to read offline

![Powering Ahead: The future of low-carbon cars and fuels3
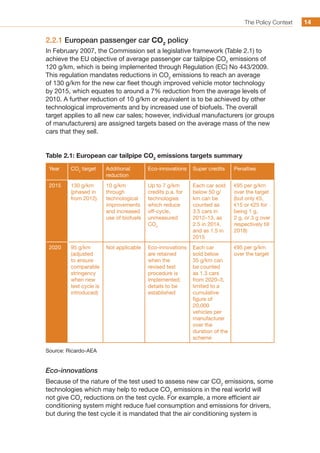
(IPCC). Its Fourth Assessment Report, published in 2007, concluded that
“warming of the climate system is unequivocal” and stated that:
“most of the observed increase in global average temperatures
since the mid-20th
century is very likely due to the observed
increase in anthropogenic [caused by human activity] GHG
concentrations” (IPCC, 2007).
It should be noted that despite the widely reported criticism of the report and
the discovery of some minor errors, these conclusions still stand.
Scientific studies since 2007 indicate that the situation appears to be
worsening. In May 2009, ahead of the UNFCCC (United Nations Framework
Convention on Climate Change) negotiations at Copenhagen, a joint statement
from science academics stated that:
“climate change is happening even faster than previously
estimated; global CO2
emissions since 2000 have been higher
than even the highest predictions, Arctic sea ice has been melting
at rates much faster than predicted, and the rise in the sea level
has become more rapid” (G8+5 Academies, 2009).
The IPCC’s Fifth Assessment Report will review the more recent scientific
evidence for climate change and draw conclusions based on this. It is due for
finalisation in 2014.
1.2.2 UK policy on climate change
The King Review of low-carbon cars was published the year after Sir Nicholas
Stern’s influential report on the economics of climate change (HM Treasury,
2006). The Stern Review recommended that strong, early action should be
taken to address climate change.
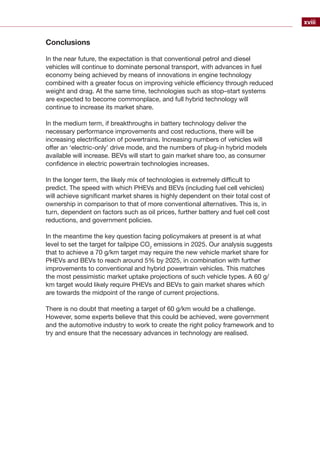
In 2008, the UK became the first country in the world to introduce a law
committing the government to cut GHG emissions. The Climate Change Act
2008 requires an 80% reduction by 2050 relative to a baseline of 1990.
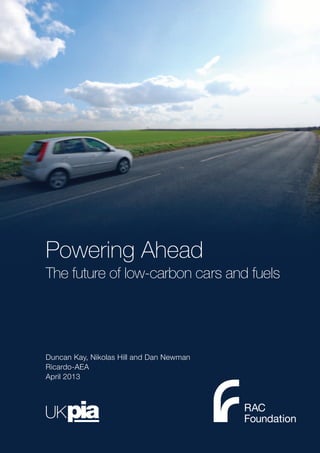
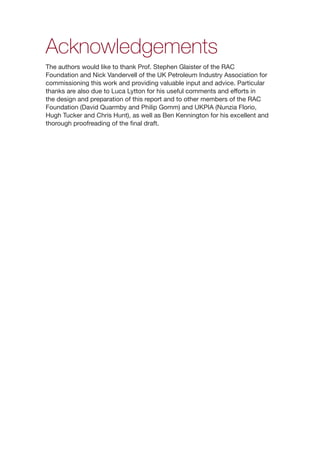
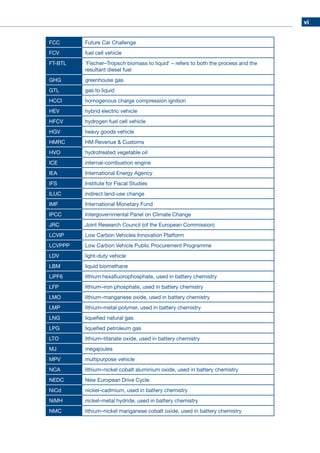
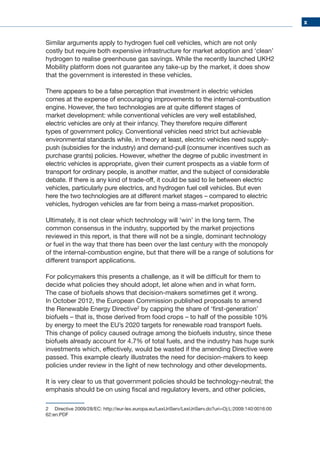
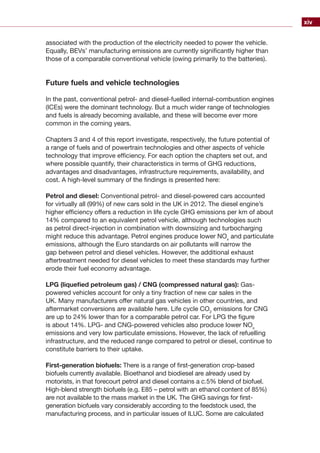
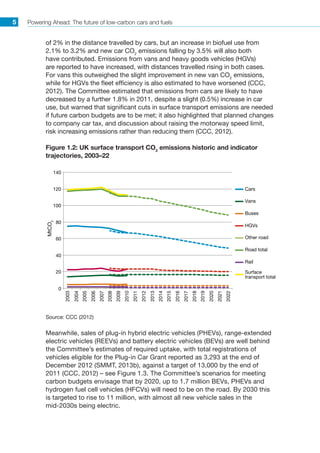
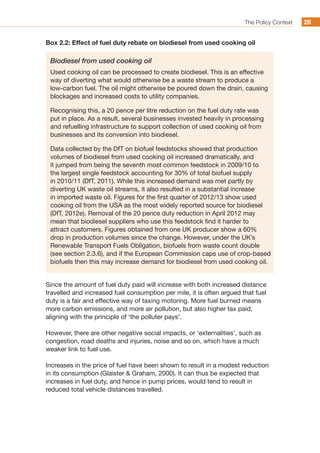
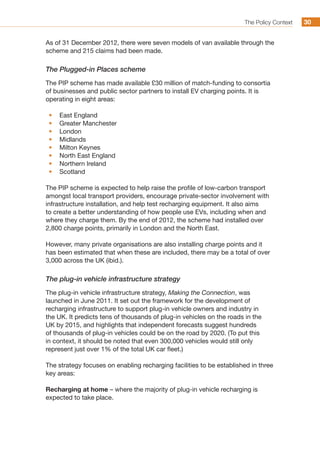
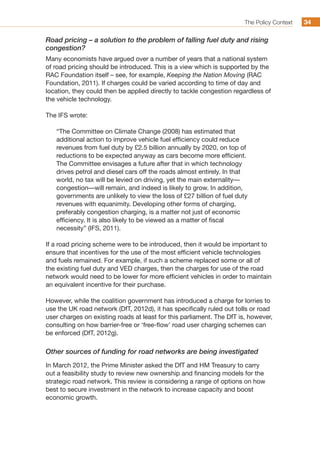
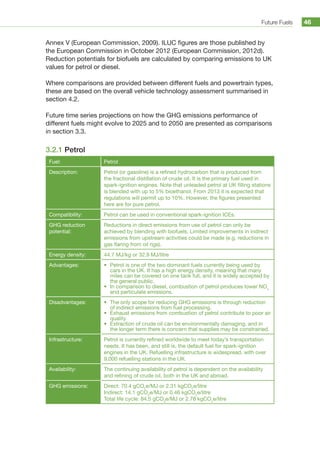
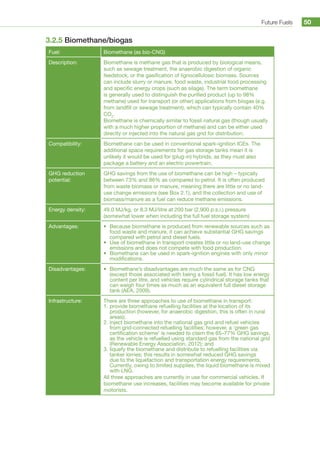
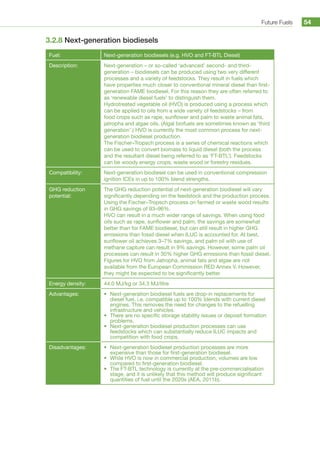
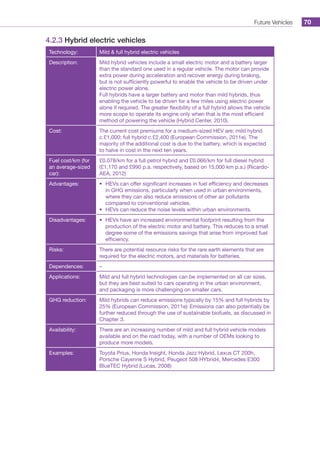
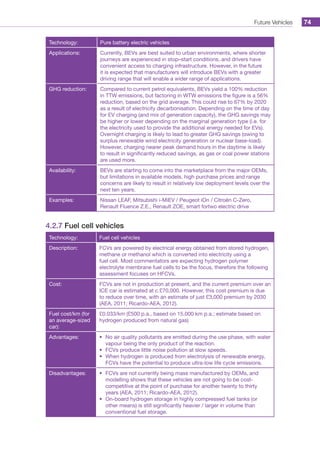
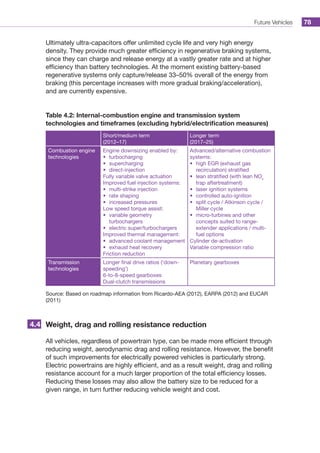
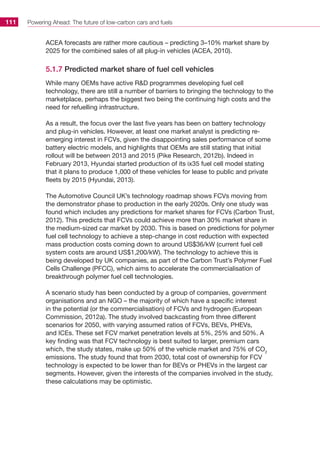
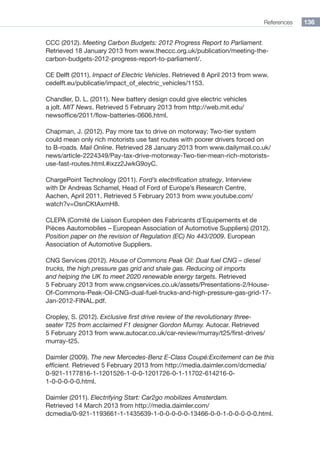
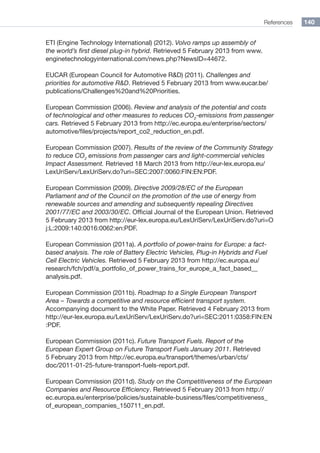
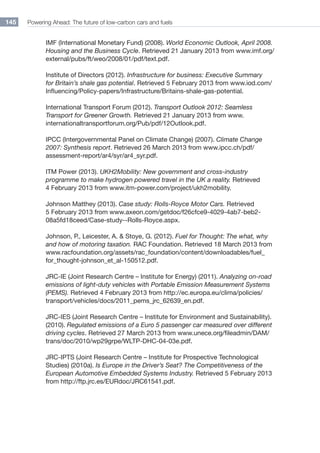
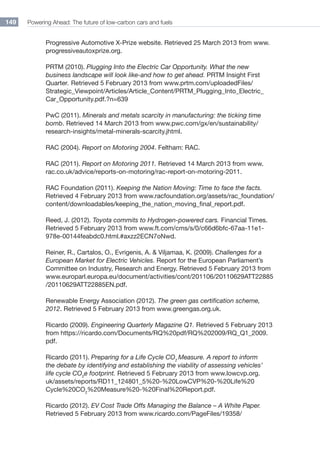
The Department of Energy Climate Change (DECC) reports on UK GHG
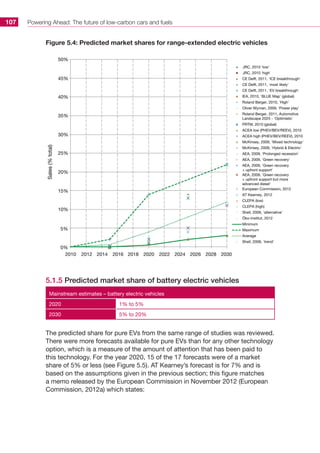
emissions. Data for 2011 shows transport to be responsible for 21% of
these emissions, with cars accounting for 55% of that share (Figure 1.1). The
dominant GHG is carbon dioxide (CO2
), and road transport accounts for 24%
of the UK’s total CO2
emissions (NAEI, 2013).](https://image.slidesharecdn.com/poweringahead-kayetal-apr2013-130422084840-phpapp02/85/Powering-Ahead-24-320.jpg)
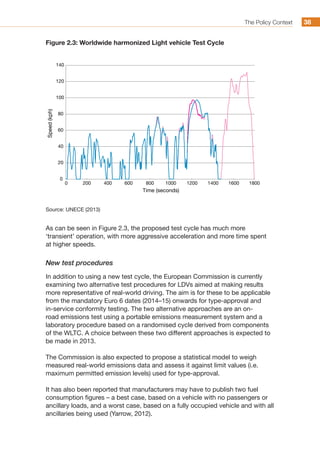
![The Policy Context 12
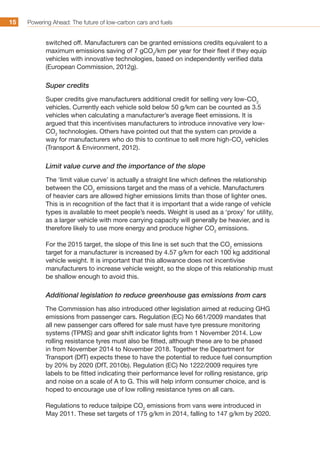
European transport and fuel policy
The key policy document for transport in Europe is the 2011 Transport White
Paper, which has the aim of “growing transport and supporting mobility while
reaching the 60% emission reduction target [by 2050]” (European Commission,
2011f). This includes objectives of:
• halving the use of ‘conventionally fuelled’ cars in urban transport by 2030
and phasing them out in cities by 2050;
• halving road casualties by 2020 and moving close to zero casualties by
2050;
• reducing oil dependency;
• improving air quality in cities.
The White Paper states:
“The race for sustainable mobility is a global one. Delayed action
and timid introduction of new technologies could condemn the EU
transport industry to irreversible decline. The EU’s transport sector
faces growing competition in fast developing world transport
markets” (European Commission, 2011f: 5).
It goes on to say:
“The synergies with other sustainability objectives such as the
reduction of oil dependence, the competitiveness of Europe’s
automotive industry as well as health benefits, especially improved
air quality in cities, make a compelling case for the EU to step up
its efforts to accelerate the development and early deployment of
clean vehicles” (ibid.).
The European Commission’s strategy for the automotive sector is informed and
guided by a number of bodies, including:
2.2](https://image.slidesharecdn.com/poweringahead-kayetal-apr2013-130422084840-phpapp02/85/Powering-Ahead-33-320.jpg)

![Predicted Market Shares of Future Technologies and Fuels 112
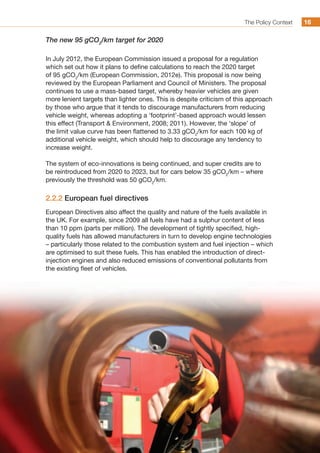
The study (European Commission, 2012a: 9) concludes that:
“The emerging [fuel cell vehicle] market (2010–20) requires close value
chain synchronisation and external stimulus in order to overcome the
first-mover risk of building hydrogen retail infrastructure. While the
initial investment is relatively low, the risk is high and therefore greatly
reduced if many companies invest, coordinated by governments
and supported by dedicated legislation and funding. With the
market established, subsequent investment (2020–30) will present
a significantly reduced risk and by 2030 any potentially remaining
economic gap is expected to be directly passed on to the consumer.”
In August 2012, a review of the current status for fuel cell deployment in LDVs
found that FCVs should be seen as complementary to BEVs and PHEVs
(Fuel Cell Today, 2012). It states that BEVs are best realised as smaller cars in
applications that require a continuous range of less than 125 miles, and that
given the limited range of BEVS, FCVs offer the only zero-emissions option for
larger cars travelling longer distances.
Predicted future mix of fuels
The mix of fuels which will power our cars in the future will of course be
determined by the mix of powertrain technologies in use, with the one
exception being the use of biofuels, which can be a direct replacement for
liquid fossil fuels in ICEs. The use of food crop-based biofuels is now being
limited as a result of concerns about the limited GHG reductions achieved,
and wider environmental and social issues (as described in Box 2.1). However,
next-generation advanced biofuels are being developed which address these
issues and can provide high-quality direct replacements for fossil fuels.
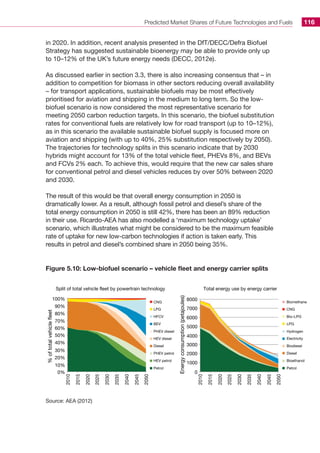
As section 5.1 has shown, there are wide variations in the predictions for the
speed with which electrification of powertrains will take place. In this section,
four different scenarios are examined from two different sources:
1. IEA’s baseline and BLUE Map global scenarios for 2050;
2. Ricardo-AEA’s proprietary modelling of ‘business as usual’ and ‘low
biofuel’ scenarios for Europe to 2050.
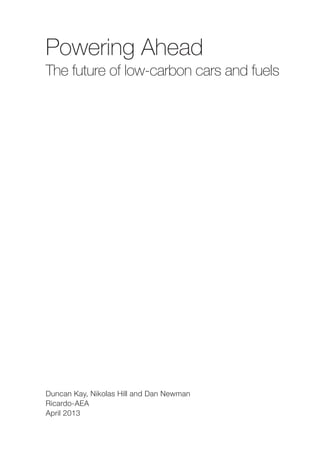
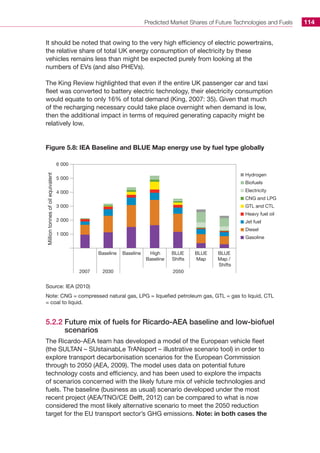
5.2.1 Future mix of fuels for IEA baseline and BLUE Map
scenarios
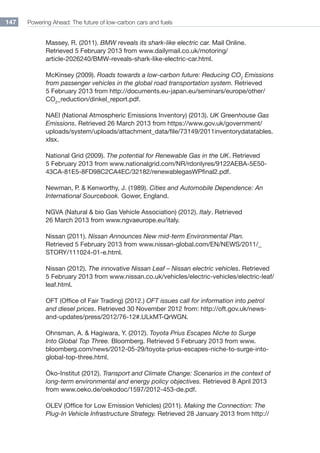
IEA’s BLUE Map scenario backcasts from the IPCC targets for a 50% reduction
of energy-related CO2
emissions by 2050 on 2005 levels. Transport is expected
to contribute to this overall reduction by cutting CO2
emissions levels in 2050
to 30% below 2005 levels.
5.2](https://image.slidesharecdn.com/poweringahead-kayetal-apr2013-130422084840-phpapp02/85/Powering-Ahead-133-320.jpg)
![References 142
European Commission Enterprise and Industry, Automotive sector website.
Retrieved 21 January 2013 from http://ec.europa.eu/enterprise/sectors/
automotive/files/com-2012-636_en.pdf.
European Environment Agency (2012). The contribution of transport to
air quality – TERM 2012: Transport indicators tracking progress towards
environmental targets in Europe, page 37. Retrieved 18 March 2013 from www.
eea.europa.eu/publications/transport-and-air-quality-term-2012.
FEV (2011). In-market Application of Start-Stop Systems in European Market:
Final Report. Retrieved 5 February 2013 from www.theicct.org/sites/default/
files/FEV_LDV%20EU%20Technology%20Cost%20Analysis_StartStop%20
Overview.pdf.
Ford (2011). Streamlined all-new Ford Focus significantly reduces aerodynamic
drag, adding fuel efficiency. Retrieved 5 February 2013 from http://media.ford.
com/article_display.cfm?article_id=33939.
Ford (2012). UK-developed high-tech Ford 1.0-litre EcoBoost engine launched
by Mulally. Retrieved 5 February 2013 from www.ford.co.uk/FordFleet/
NewsAndReviews/FordForBusiness/2012/January/Ecoboost-Engine.
François-Feuerstein, I. (2012). PSA suspend ses achats de voitures
électriques auprès de Mitsubishi [PSA suspends its purchases of electric cars
at Mitsubishi]. LesEchos. Retrieved 5 February 2013 from http://archives.
lesechos.fr/archives/2012/lesechos.fr/08/07/0202207988420.htm.
Frost, L. (2010). Peugeot Citroen Bets on Vehicle-Lease Programs to Power
Electric-Car Sales. Bloomberg. Retrieved 5 February 2013 from www.
bloomberg.com/news/2010-09-06/peugeot-citroen-plans-to-boost-electric-
car-demand-with-leasing-programs.html.
Frost Sullivan (2010). Sustainable and Innovative Personal Transport
Solutions – Strategic Analysis of Carsharing Market in Europe.
Retrieved 25 February 2013 from www.frost.com/sublib/display-report.
do?id=M4FA-01-00-00-00.
Fuel Cell Today (2012). Fuel Cell Electric Vehicles: The Road Ahead. Retrieved
14 March 2013 from www.fuelcelltoday.com/media/1711108/fuel_cell_electric_
vehicles_-_the_road_ahead_v2.pdf.
G8+5 Academies (2009). G8+5 Academies’ joint statement: Climate change
and the transformation of energy technologies for a low carbon future.
Retrieved 17 January 2013 from www.nationalacademies.org/includes/
G8+5energy-climate09.pdf.](https://image.slidesharecdn.com/poweringahead-kayetal-apr2013-130422084840-phpapp02/85/Powering-Ahead-163-320.jpg)


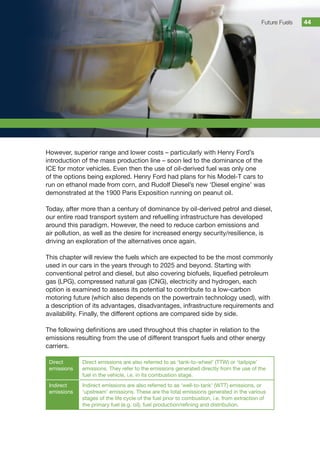
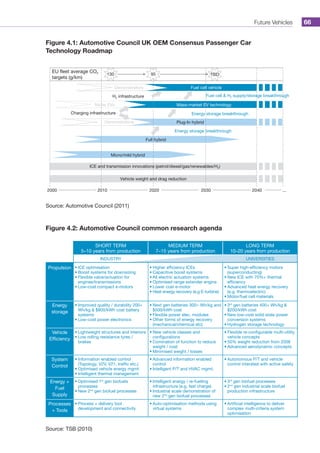
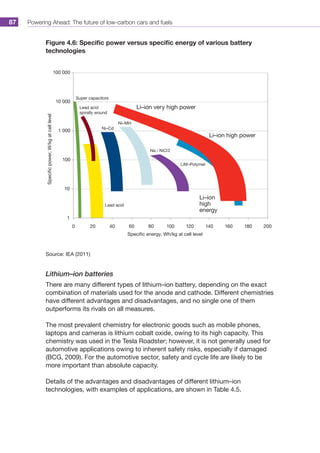
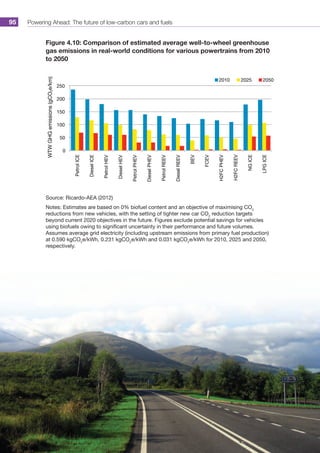
This document provides a summary of the key findings from a report on the future of low-carbon cars and fuels. It finds that conventional petrol and diesel cars will remain dominant until at least 2030, accounting for around 60% of new vehicles. Electric vehicles such as plug-in hybrids are predicted to reach between 5-15% of new car sales by 2020 and 20-50% by 2030. Significant improvements in battery technology are still needed to increase the mass-market potential of electric vehicles. The future role of hydrogen fuel cell vehicles remains uncertain due to high costs and need for clean hydrogen infrastructure. A variety of low-carbon vehicle technologies and fuels will be needed to meet emissions reduction targets.


![[729.HK] FDG Electric Vehicles Corporate Presentation](https://cdn.slidesharecdn.com/ss_thumbnails/729-180601095216-thumbnail.jpg?width=640&height=640&fit=bounds)


