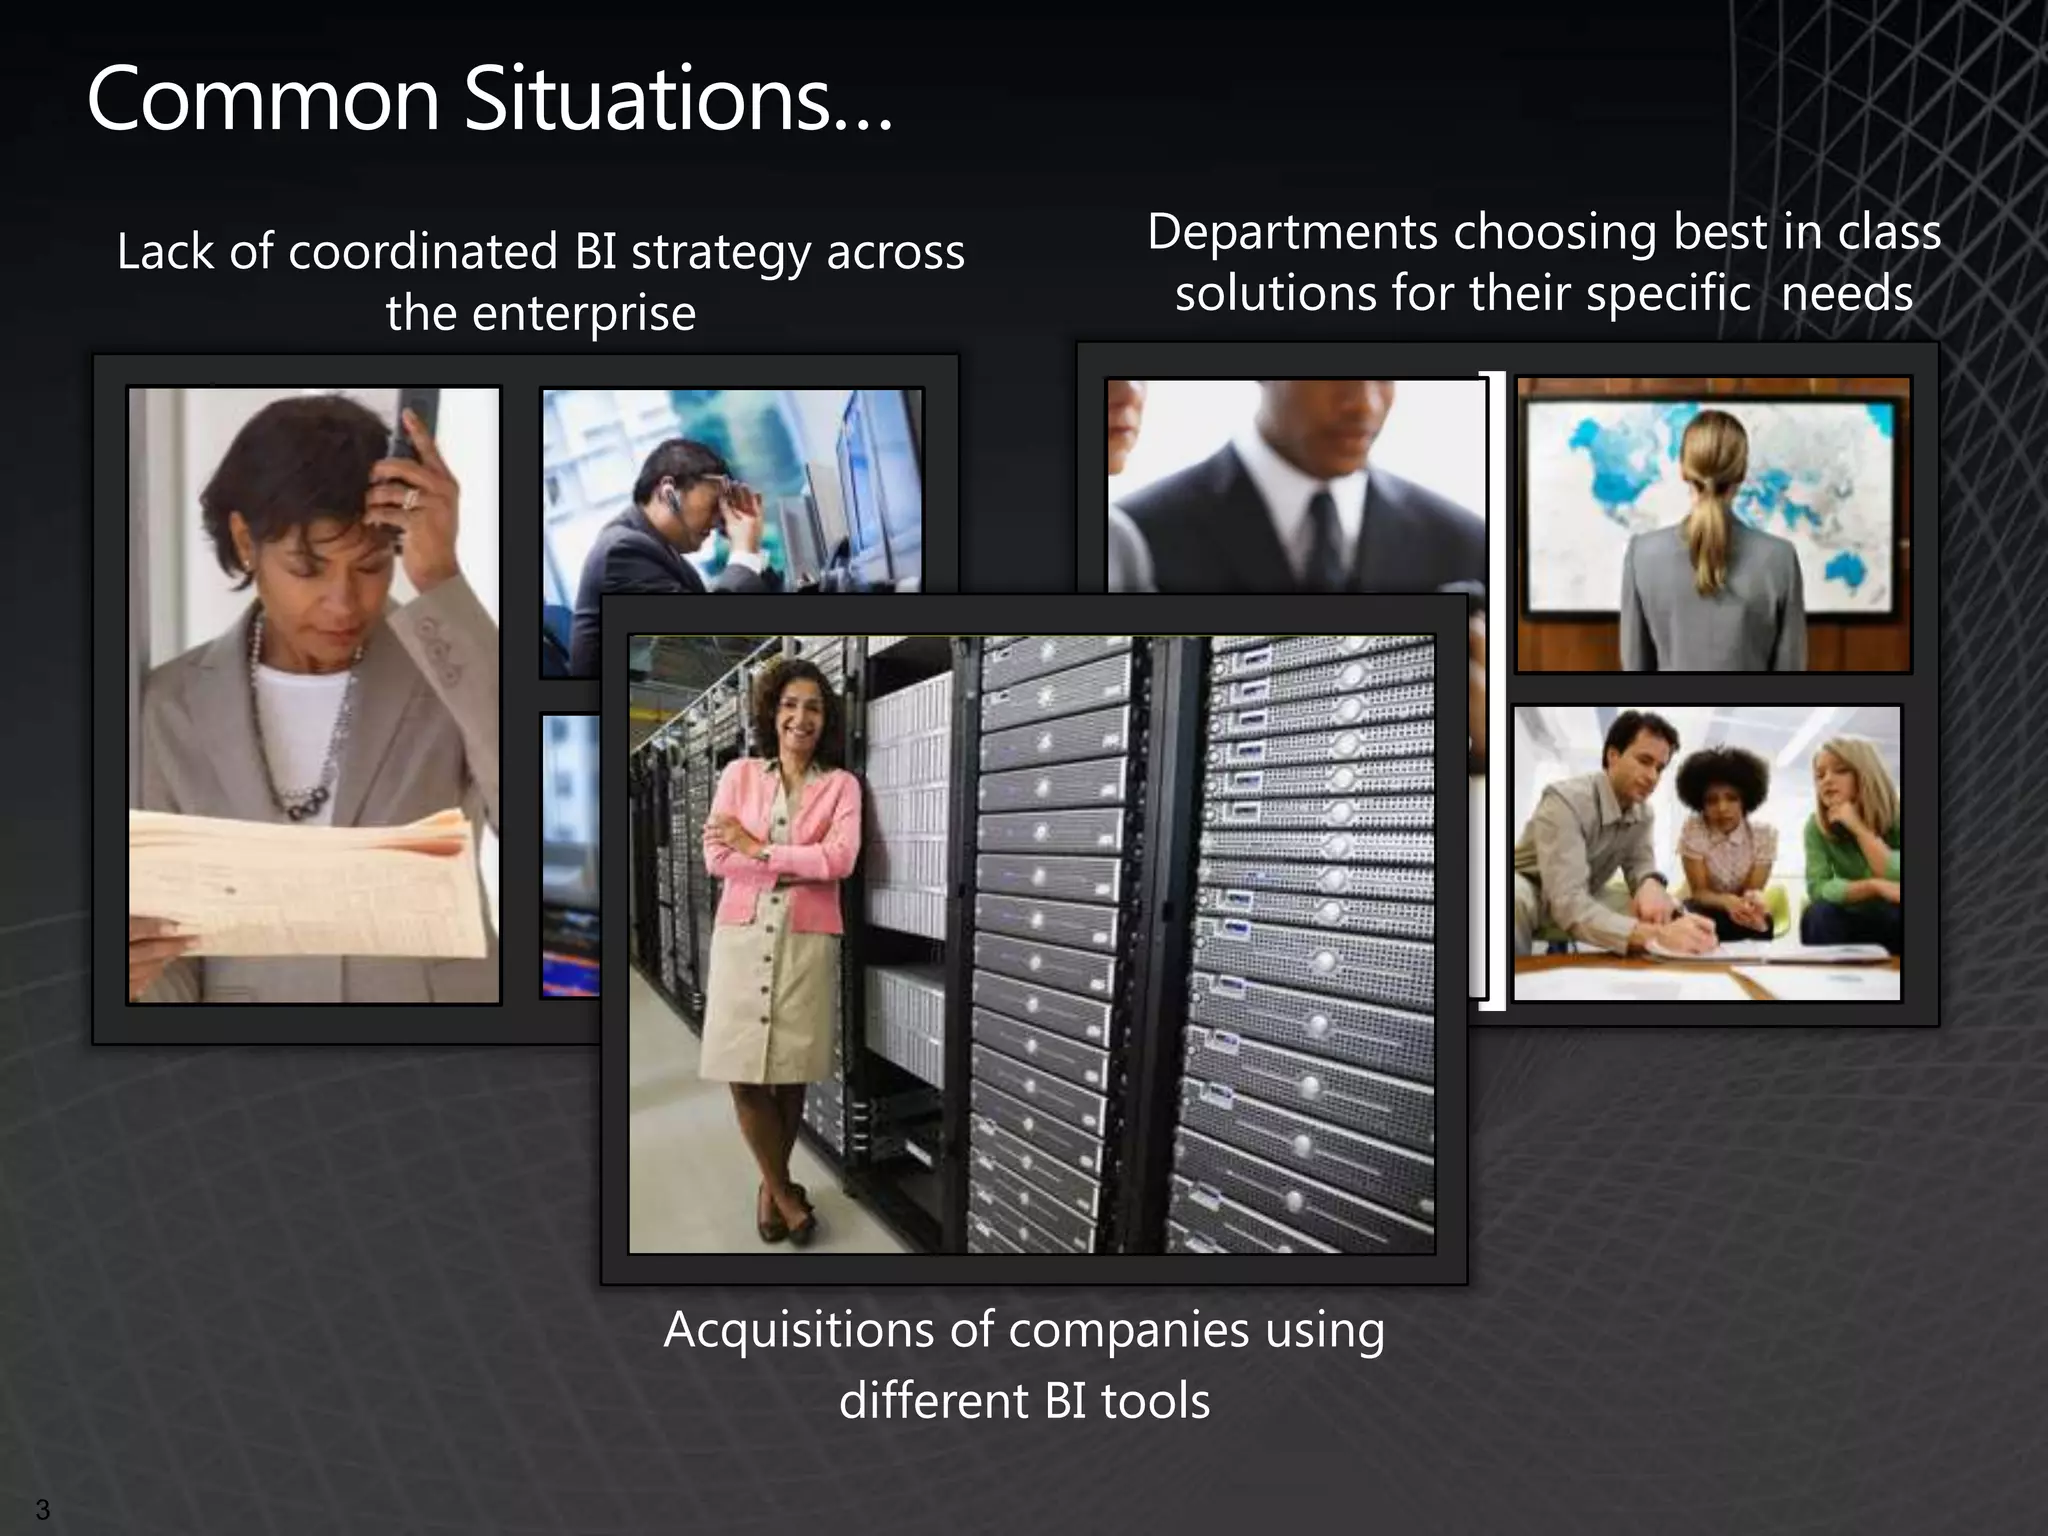
This document provides an outline for a presentation on Microsoft's Business Intelligence (BI) consolidation capabilities. The presentation aims to provide an overview of Microsoft's BI vision and the key benefits of consolidation, using case studies and customer evidence. The presentation outline covers common BI challenges organizations face with multiple disconnected tools, and how Microsoft's integrated BI platform addresses these challenges through a single consolidated view, reduced costs, improved collaboration and efficiency.
Microsoft Business Intelligence Vision and StrategyNic Smith
Microsoft Business Intelligence slide deck, learn the Microsoft vision and strategy for business intelligence. These slides include the offering and value proposition for Microsoft BI.
Power bi implementation for finance services firmsaddendanalytics
Addend Analytics is a Microsoft Power BI-partner based in Mumbai, India. Apart from being authorized for Power BI implementations, Addend has successfully executed Power BI projects for 100+ clients across sectors like financial services, Banking, Insurance, Retail, Sales, Manufacturing, Real estate, Logistics, and Healthcare in countries like the US, Europe, Australia, and India. Companies partnering with us save their valuable time and efforts of searching and managing resources while saving hugely on the development costs and hence, most of the small and medium enterprises in North America prefer Addend to be their Power BI implementation partner.
Modern Business Intelligence - Design and ImplementationsDavid J Rosenthal
During the first two “waves” of business intelligence, IT professionals and business analysts were the keepers of BI. They made BI accessible and consumable for end users.
While this approach still applies to complex business intelligence needs, today there is a new “wave.” This third wave of BI makes BI available to every kind of user.
As customer strive to take advantage of the digital transformation that is occurring in virtually every industry, they need to re-evaluate how they engage with their customers/prospects, how they transform their products and operations, and how they empower and understand their employees.
In today’s world, doing each of these things is more and more reliant upon data…traditionally, everything you knew about your customers and prospects was available in your business application systems and in the heads of employees. You learned almost everything about your products BEFORE they left your warehouse. Employees used technology more to enter data than to learn from it.
In the data-driven world we live in today, leveraging intelligent insights from data across customers, products, and employees is critical to be able to stay competitive and keep up with or lead digital transformation in any industry. And this isn’t just a customer’s typical business application data – it’s also about augmenting the customer’s data with additional data (e.g. search, employee behavioral data, sentiment data, benchmark data, etc..) – and applying the right intelligence to drive meaningful insights.
Microsoft Power BI is a unified self-service and enterprise business intelligence platform that combines an intuitive user experience with intelligent data visualizations to provide greater depth of data insight. Reports can be shared within Microsoft tools like Teams, SharePoint, PowerPoint, or within other productivity products.
Delivering Trusted Insights with Integrated Data Quality for CollibraPrecisely
There’s a saying, “what you don’t know can’t hurt you.” But, in today’s data-driven world, this saying couldn’t be farther from the truth.
Understanding and trusting your data is critical -- whether you’re complying with regulations like CCAR, GDPR, or CCPA, operationalizing privacy policies, or unlocking insights for a competitive advantage.
Trillium Discovery seamlessly integrates with Collibra Data Governance to deliver the visibility you need to ensure your data is fit-for-purpose and business rules compliant. With Trillium Discovery for Collibra, you get unprecedented visibility into the health of your data – including a data quality scorecard – right in your Collibra dashboard.
Join this webinar to learn how integrating data quality into your data governance platform unlocks the value – and eliminates the risk – hidden in your data, and see the new Trillium Discovery for Collibra in action!
Key topics will include:
- Benefits -- and challenges -- of data governance
- Importance of data quality for data governance
- Trillium Discovery’s industry-leading data validation and quality monitoring for Collibra
- Powerful new features in Trillium Discovery for Collibra
360 metadata - crucial for digital marketing - framework for youHeimo Hänninen
Digital Marketing requires high quality metadata about: your consumers, your products, product data and marketing content, your partners, your sales activities and pricing, to mention a few. Linked Open Data (LOD) and semantic technologies are robust, yet flexible way of merging and managing metadata for marketing from different sources. With LOD you can also realize Enterprise Linked Data in wider scope.
Leveraging MS BI Toolset to Monitor Performance - TechFuse 2010Dan English
There are many different pieces in the Microsoft BI toolset. In this session, we will take a look at all of the different pieces and utilize each of them to create a unified dashboard, where each component is being leveraged. The tools that will be utilized during this session will include SQL Server 2008, SSRS 2008, SSAS 2008, Excel 2007, Excel Services, PPS 2007, Dashboard Designer, SharePoint Server 2007 and more.
The amount of information inside your company is constantly expanding, and to stay competitive, your data-insight strategy has to keep pace with business change. Here, we explore the benefits of using Infor BI and how using the platform can quickly transform raw data into valuable business insight. Infor BI is the one solution for all your data analytics needs.
Business Intelligence is an umbrella term that combines architectures, applications, and databases. It enables the real-time, interactive access, analysis, and manipulation of information, which provides the business community with easy access to business data. By giving this valuable insight, BI helps decision-makers make more informed decisions and supplies end-users with critical business information on their customers or partners, including information on behaviours and trends.”
Making the Most of Power BI with SQL Server 2014 and AzurePerficient, Inc.
Power BI is a compelling new cloud-based BI offering for Office 365 SharePoint Online users, with advanced collaborative capabilities including mobile cross-platform reporting, on-the-fly dashboarding and natural language querying.
When you combine Power BI’s self-service business intelligence with SQL Server 2014 and Microsoft Azure, you can host your entire BI solution in the cloud while providing greater access to business analytics than ever before.
Join Perficient's Microsoft business intelligence expert Andrew Tegethoff to learn how to host your analytics and reporting solution in the cloud with Power BI and SQL Server 2014.
Harness the Power of the Cloud to Drive Business InnovationPerficient, Inc.
Innovation in the cloud transcends information technology. It is woven into the very fabric of customer experience strategies and can be directly applied to how we think about business innovation as an enterprise.
Our Cloud First webinar provided a pragmatic approach to using design thinking to harness the power of cloud for business innovation. We walked through a framework for innovation and demonstrated how to build the right team, apply the right methods, and leverage the right tools to:
-Quickly create value for customers
-Bring people and ideas together
-Foster innovation through continuous delivery
-Release your ideas into the wild
Enterprises are faced by information overload. Big data appears as an opportunity, but has no relevance until enterprises can put it in context of their activities, processes, and organizations, Applying MDM principles to Big Data is therefore an opportunity that enterprises should target.
This presentation covers the following topics :
- what is MDM and Information Management
- what is Big Data and what are the use cases
- why and how Big Data can take advantage of MDM ? why and how MDM can take advantage of Big Data ?
Basics & Intro to SQL Server Reporting Services: Sql Server Ssrs 2008 R2Bala Subra
How to use SQL Server 2008 R2 reporting services instead of ASP.NET for every data presentation problems? Where SSRS is superior to raw SQL? How it helps QA to automate their test cases?
Defining Achievable Scope for your BI InitiativeJeff Block
This presentation addresses critical principles that will guide the scoping of your BI initiative or project, as well as a single iteration within a project. It was originally presented at the ITA BI round table in February 2009.
SQL Server 2016 is now in review! The newest version promises to deliver new real-time, built-in advanced analytics, advanced security technology, hybrid cloud scenarios as well as amazing rich visualizations on mobile devices.
There are many great reasons to move to SQL 2016, however if you are still working on SQL Server 2005 you may have another good motivator - the end-of-life clock of SQL 2005 is ticking down and support is about to end April 12, 2016.
In this deck we review the significant licensing changes introduced with SQL 2012. If our experience as Microsoft's Gold Certified Member has taught us anything - it is one thing. During migrations many of our clients get outright lost when trying to figure out the number of licenses they have or need. This often leads to under-deployment, and subsequently serious compliance issues with Microsoft. And yes, in some cases over-deployment means big savings back to your department.
Introduction to SQL Server Internals: How to Think Like the EngineBrent Ozar
When you pass in a query, how does SQL Server build the results? Time to role play: Brent will be an end user sending in queries, and you will play the part of the SQL Server engine. Using simple spreadsheets as your tables, you will learn how SQL Server builds execution plans, uses indexes, performs joins, and considers statistics.
This session is for DBAs and developers who are comfortable writing queries, but not so comfortable when it comes to explaining nonclustered indexes, lookups, and sargability.
There are many ways to reduce costs in IT. Consolidation is one of these ways. Many IT managers thinking only about virtualization when consider consolidation. Multi-instancing is very legitimate and effective way too. Managers and DBAs have to understand benefits and pitfalls, difference from virtualization. Presentation is unveiling real-world practice and experience of support of over 70 servers with at least 6 instances on each with over 2500 databases. This presentation can be helpful for infrastructure managers, system architects, and DBAs .
BI is all about making dry figures accessible & useful to the right audience within an Enterprise
Euthenics IT Services Pvt. Ltd.
306-B, Super Plaza, Sandesh Press Road, Bodakdev, Ahmedabad-380 054, Gujarat, INDIA
Tel: +91 (79) 26769094 & 40036094
Web: www.euthenicsit.com/ www.factisbi.com
BI: new of the buzz words that everyone is talking about but what is it? How can it be used to make a impact in my organization? How do I get started? In this session, we will talk about it and show you a live example in Office 365's SharePoint Online.
Objectives/Outcomes: In this session, participants will learn:
1. What is BI
2. What is Microsoft's Power BI
3. Case Studies
4. How can I get it
Extend Your MS Dynamics ERP & CRM with a Complete BI Solutionwww.panorama.com
Panorama Software has recently formed a strategic alliance with the RSC Group, a market leader in Microsoft Dynamics solutions. By integrating our solutions, you can now extend your Dynamics solutions to drive Corporate Performance Measurement with a true pervasive BI suite, leveraging Panorama & Microsoft technologies you already own.
Migrating its entire virtualized environment from VMware to Hyper-V has helped Miele & Cie, an appliance manufacturer shrink its server space by more than 50 percent and improve productivity.
To add to the new flexible and energy-efficient data center, Miele has also ‘saved an estimated 35 percent in licensing costs by going with a Microsoft virtualization solution’.
Hyper-V has helped AcXess fill that much needed virtualization gap with an improvised and more competent functionality and reduced data center and hardware costs.
According to Tom Elowson, President and Cofounder, AcXess, “Hyper-V has made all the difference. It is amazing to think we have grown our business 300 percent over the last few years with Hyper-V. ”
There are many misconceptions surrounding Cloud Computing and what it has to offer.
Tell apart the facts from the myths with Cloud Computing Myth Busters and develop a deeper understanding of the Cloud.
Download Myth Busters >>
Builder.ai Founder Sachin Dev Duggal's Strategic Approach to Create an Innova...Ramesh Iyer
In today's fast-changing business world, Companies that adapt and embrace new ideas often need help to keep up with the competition. However, fostering a culture of innovation takes much work. It takes vision, leadership and willingness to take risks in the right proportion. Sachin Dev Duggal, co-founder of Builder.ai, has perfected the art of this balance, creating a company culture where creativity and growth are nurtured at each stage.
Key Trends Shaping the Future of Infrastructure.pdfCheryl Hung
Keynote at DIGIT West Expo, Glasgow on 29 May 2024.
Cheryl Hung, ochery.com
Sr Director, Infrastructure Ecosystem, Arm.
The key trends across hardware, cloud and open-source; exploring how these areas are likely to mature and develop over the short and long-term, and then considering how organisations can position themselves to adapt and thrive.
Dev Dives: Train smarter, not harder – active learning and UiPath LLMs for do...UiPathCommunity
💥 Speed, accuracy, and scaling – discover the superpowers of GenAI in action with UiPath Document Understanding and Communications Mining™:
See how to accelerate model training and optimize model performance with active learning
Learn about the latest enhancements to out-of-the-box document processing – with little to no training required
Get an exclusive demo of the new family of UiPath LLMs – GenAI models specialized for processing different types of documents and messages
This is a hands-on session specifically designed for automation developers and AI enthusiasts seeking to enhance their knowledge in leveraging the latest intelligent document processing capabilities offered by UiPath.
Speakers:
👨🏫 Andras Palfi, Senior Product Manager, UiPath
👩🏫 Lenka Dulovicova, Product Program Manager, UiPath
Smart TV Buyer Insights Survey 2024 by 91mobiles.pdf91mobiles
91mobiles recently conducted a Smart TV Buyer Insights Survey in which we asked over 3,000 respondents about the TV they own, aspects they look at on a new TV, and their TV buying preferences.
GraphRAG is All You need? LLM & Knowledge GraphGuy Korland
Guy Korland, CEO and Co-founder of FalkorDB, will review two articles on the integration of language models with knowledge graphs.
1. Unifying Large Language Models and Knowledge Graphs: A Roadmap.
https://arxiv.org/abs/2306.08302
2. Microsoft Research's GraphRAG paper and a review paper on various uses of knowledge graphs:
https://www.microsoft.com/en-us/research/blog/graphrag-unlocking-llm-discovery-on-narrative-private-data/
GDG Cloud Southlake #33: Boule & Rebala: Effective AppSec in SDLC using Deplo...James Anderson
Effective Application Security in Software Delivery lifecycle using Deployment Firewall and DBOM
The modern software delivery process (or the CI/CD process) includes many tools, distributed teams, open-source code, and cloud platforms. Constant focus on speed to release software to market, along with the traditional slow and manual security checks has caused gaps in continuous security as an important piece in the software supply chain. Today organizations feel more susceptible to external and internal cyber threats due to the vast attack surface in their applications supply chain and the lack of end-to-end governance and risk management.
The software team must secure its software delivery process to avoid vulnerability and security breaches. This needs to be achieved with existing tool chains and without extensive rework of the delivery processes. This talk will present strategies and techniques for providing visibility into the true risk of the existing vulnerabilities, preventing the introduction of security issues in the software, resolving vulnerabilities in production environments quickly, and capturing the deployment bill of materials (DBOM).
Speakers:
Bob Boule
Robert Boule is a technology enthusiast with PASSION for technology and making things work along with a knack for helping others understand how things work. He comes with around 20 years of solution engineering experience in application security, software continuous delivery, and SaaS platforms. He is known for his dynamic presentations in CI/CD and application security integrated in software delivery lifecycle.
Gopinath Rebala
Gopinath Rebala is the CTO of OpsMx, where he has overall responsibility for the machine learning and data processing architectures for Secure Software Delivery. Gopi also has a strong connection with our customers, leading design and architecture for strategic implementations. Gopi is a frequent speaker and well-known leader in continuous delivery and integrating security into software delivery.
Let's dive deeper into the world of ODC! Ricardo Alves (OutSystems) will join us to tell all about the new Data Fabric. After that, Sezen de Bruijn (OutSystems) will get into the details on how to best design a sturdy architecture within ODC.
UiPath Test Automation using UiPath Test Suite series, part 4DianaGray10
Welcome to UiPath Test Automation using UiPath Test Suite series part 4. In this session, we will cover Test Manager overview along with SAP heatmap.
The UiPath Test Manager overview with SAP heatmap webinar offers a concise yet comprehensive exploration of the role of a Test Manager within SAP environments, coupled with the utilization of heatmaps for effective testing strategies.
Participants will gain insights into the responsibilities, challenges, and best practices associated with test management in SAP projects. Additionally, the webinar delves into the significance of heatmaps as a visual aid for identifying testing priorities, areas of risk, and resource allocation within SAP landscapes. Through this session, attendees can expect to enhance their understanding of test management principles while learning practical approaches to optimize testing processes in SAP environments using heatmap visualization techniques
What will you get from this session?
1. Insights into SAP testing best practices
2. Heatmap utilization for testing
3. Optimization of testing processes
4. Demo
Topics covered:
Execution from the test manager
Orchestrator execution result
Defect reporting
SAP heatmap example with demo
Speaker:
Deepak Rai, Automation Practice Lead, Boundaryless Group and UiPath MVP
Slack (or Teams) Automation for Bonterra Impact Management (fka Social Soluti...Jeffrey Haguewood
Sidekick Solutions uses Bonterra Impact Management (fka Social Solutions Apricot) and automation solutions to integrate data for business workflows.
We believe integration and automation are essential to user experience and the promise of efficient work through technology. Automation is the critical ingredient to realizing that full vision. We develop integration products and services for Bonterra Case Management software to support the deployment of automations for a variety of use cases.
This video focuses on the notifications, alerts, and approval requests using Slack for Bonterra Impact Management. The solutions covered in this webinar can also be deployed for Microsoft Teams.
Interested in deploying notification automations for Bonterra Impact Management? Contact us at sales@sidekicksolutionsllc.com to discuss next steps.
12. …lead to common business challenges 3-5 BI solutions in use in your company? IT developing, deploying and maintaining multiple, disconnected tools? IT and users growing skills in several BI technologies? Discrepancies in numbers coming from different reporting tools? Debates about which data metrics to use across multiple tools? No single, consolidated view of information? Need to reduce BI overhead? Need to simplify training time and costs? Need to find opportunities to reduce overall TCO?
22. Getting timely access to enterprise-wide data and moving beyond a solution based on Microsoft® Office Access to consolidate this data for up-to-date reporting
26. Built on a trusted IT backboneMicrosoft Business Intelligence Vision Improving organizations by providing business insights to all employees leading to better, faster, more relevant decisions 8
27. Microsoft Business IntelligenceGet the most out of the products you know Business User Experience Familiar User Experience Self-Service access & insight Data exploration & analysis Predictive analysis Data visualization Contextual visualization Business Collaboration Platform Dashboards & Scorecards Excel Services Web based forms & workflow Collaboration Search Content Management LOB data integration Business Collaboration Platform Data Infrastructure & BI Platform Data Infrastructure and BI Platform Analysis Services Reporting Services Integration Services Master Data Services Data Mining Data Warehousing 9
35. Powerful Personal Analysis Tools Drive personal productivity and insight Easier navigation with Slicers Improved formatting and charts Microsoft Confidential, Prototype Only
47. Share Insights Get a common view of organizational performance Refresh workbook data manually or automatically Get access to unlimited data secured in SharePoint with PowerPivot Publish and share rich workbooks to SharePoint Get the same rich fidelity with a Web browser, including Ribbon and Excel functions Microsoft Confidential, Prototype Only
51. Enabling employees to have easy access to LOB data from their desktop productivity applications
52.
53. Relevant SearchFind structured and unstructured data Refine and filter to get what you want the first time Find reports, workbooks, and people seamlessly with relevance
54. Increase Organizational VisibilityTrack key metrics Increase visibility into key team and organizational objectives with dashboards Display business data in context Enable continuous analysis and iterative decision making with new chart types See interdependencies with strategy maps
55. Increase IT EfficiencyAdministrative consistency expedites BI uptake Integration and Interoperability High Performance and Scalability Centralized Visibility Rich data connectivity High scaledata warehouse Report and data usage Enterprise data integration High scale analytics and reporting Application Performance Data alignment across multiple systems Application and multi-server management Database performance and utilization Administrative Consistency 22 22
56. Reduce Cost and ComplexityConsolidate disparate product investments Enterprise Content Management Collaboration Portal Scorecards and Dashboards Search Analysis Reporting Data Mining Data Quality Data Warehouse Master Data ETL
57. Improve ScalabilityScale-out to support BI for all users at a lower TCO New features: Query Optimizations, Resource Governance, Enhanced Partitioning Performance
58. Enable Administration EfficiencyEasily manage the self-service environment Provide user-driven application administration and monitoring Manage and facilitate access to secure organizational data Simplify management of BI content using the PowerPivot Management Dashboard
59. Enable IT EfficiencyFamiliar and intuitive development and management tools Integrated Development Environment Productivity Enhancing Designers
63. Features to support stewardship and integrationRole- Based Security Matching Master Data Stewardship Versioning Hierarchy Mgmt Business Rules Workflow Dix Inc Dixie Dixie (Salem) Dixie Inc Aut_Dixie Asset Mgmt Purchasing DB HR Doc 27
64. Microsoft Leads in BI “Magic Quadrant for Business Intelligence Platforms”, 29 January 2010 Rita L. Sallam, Bill Hostmann, James Richardson, Andreas Bitterer The Magic Quadrant is copyrighted January 29, 2010 by Gartner, Inc. and is reused with permission. The Magic Quadrant is a graphical representation of a marketplace at and for a specific time period. It depicts Gartner's analysis of how certain vendors measure against criteria for that marketplace, as defined by Gartner. Gartner does not endorse any vendor, product or service depicted in the Magic Quadrant, and does not advise technology users to select only those vendors placed in the "Leaders" quadrant. The Magic Quadrant is intended solely as a research tool, and is not meant to be a specific guide to action. Gartner disclaims all warranties, express or implied, with respect to this research, including any warranties of merchantability or fitness for a particular purpose. The Magic Quadrant graphic was published by Gartner, Inc., as part of a larger research note and should be evaluated in the context of the entire report. The Gartner report is available upon request from Microsoft.
92. Uses SQL Server OLAP, SSIS, SSRSMajor Customers Implementations
93. Next Steps UPGRADE TO SQL SERVER 2008 http://www.microsoft.com/sqlserver/2008/en/us/how-to-buy.aspx LEARN MORE ABOUT SQL SERVER 2008 R2 http://www.microsoft.com/sqlserver DOWNLOAD THE SQL SERVER 2008 R2 CTP http://www.microsoft.com/sqlserver/2008/en/us/r2.aspx
Point of slide: To In your organization there are challenges when it comes to implementing Business Intelligence solutions. The first is cost:How can I reduce the time to implement the solution?How can I make sure the solution I choose best utilizes the skill set of my organization and the infrastructure I have in place?How can I consolidate the number of vendor solutions that I have to maintain?The second challenge revolves around meeting the needs of my end users. How can I best deliver information to them that’s relevant to their needs, that’s widely accessible and adopted, and that reduces training time. The third set of challenges is really around maintaining the solution moving forward:How can I consolidate my disperse data sources and ensure the data is sound and trusted?How do I keep up with the performance and scale needs of my organization?How easy is the system going to be to manage?
Point of slide:See http://www.microsoft.com/industry/publicsector/partnersolutionmarketplace/CaseStudyDetail.aspx?casestudyid=4000004005.Every day, the 15,000 information workers at Tyson Foods share information with one another to develop and market hundreds of products. To speed employee connections, strengthen business insight, and improve efficiency, Tyson deployed SharePoint Server 2007 as its companywide collaboration platform. Using the software’s Enterprise Search capability, employees can find the people and data they need quickly, and employees have created more than 700 personal sites to share skills and experience. Users can access dashboards that expose SAP data through SharePoint sites to aid decision making, as well as BI tools that integrate with Microsoft Office desktop programs for improved insights. In addition, the IT staff has been able to quickly create powerful new Office Business Applications that are boosting productivity and savings across the company.Tyson employees are discovering the powerful BI capabilities in SharePoint Server 2007: dashboards, Web Parts, key performance indicators (KPIs), business connectivity technologies, and reporting tools. The employees use these capabilities to self-service their information needs and to create, publish, and distribute information more securely, with little training. For example, prior to using SharePoint Server 2007 to publish sales force scorecards, salespeople would spend two weeks every quarter completing complex forms that requested performance metrics in a number of areas. The accounting staff would pull data from Cognos into spreadsheets and combine it with data that they manually extracted from other systems such as SAP. Now, the Tyson IT staff uses Excel Services in SharePoint Server 2007 to combine the sales and SAP data into an Excel 2007 spreadsheet that is accessible through a single dashboard. This tremendously reduces preparation time and makes business users happier. Because Excel Services dynamically renders the spreadsheet as an interactive HTML Web Part, users can access the spreadsheet from the SharePoint site with any Web browser. In one dashboard screen, Tyson sales managers and salespeople can view individual performance, or the performance of a team, in a way that makes sense to them. “Salespeople can see what they’re being measured against and view their own performance in the context of their peers across the company,” Wilson says. “Managers can see their entire team’s performance and drill down for more detail.”Similarly, in the finance department, the IT staff uses SQL Server 2005 Analysis Services to create analysis cubes—data structures that enable fast analysis of data—and uses Excel Services to publish those cubes to a SharePoint site, where financial analysts can easily view them. SQL Server Analysis Services is a suite of data mining services included in SQL Server 2008 data management software. Tyson uses SQL Server Reporting Services to create financial reports that are posted on SharePoint sites for easy report distribution and management.
Point of slide: To See http://www.microsoft.com/casestudies/Case_Study_Detail.aspx?casestudyid=4000004514.Talking Points: G&J Pepsi-Cola Bottlers (G&J Pepsi) has been a leading bottler and distributor of Pepsi and other beverages throughout Kentucky and Ohio. Operating four manufacturing and 13 distribution facilities, the company is one of the largest Pepsi bottlers in the U.S. To run its complex operations, G&J Pepsi needs timely access to enterprise-wide data.The solution they were using was not providing them with the timely information they needed nor did it give them insight from across the organization. Becausethe company had previously standardized on Microsoft for its back-office applications and already used SharePoint to enable collaboration, they wanted to leverage their existing IT investments. The Microsoft BI solution allowed them to:Consolidate data from across the organization:Theycan now access data from nearly 50 fields from theircustomer data. Their old reporting system took so long and was so cumbersometo manipulate that they’d pick and choose what information they wanted, usually limiting ourselves to only 15 fields.”They’ve also created role based dashboards for each team, giving them insight into the relevant information then need. Improve Business Agility:With a richer pool of data, employees have more flexibility in how they analyze the business. One example is bringing multiple types of data on one report, which you could never do in our old system. With month-to-date data and fiscal-year data on the same report, we can really tell how one month’s performance will impact the entire year.”Monitor performance and quickly respond to changing business conditions:Their sales team can track month-to-date trends and opportunities. Vending looks at machine throughput, while operational teams view performance to forecast for manufacturing. We’re taking advantage of our Microsoft solution to make better decisions in nearly every part of the business.” Benefits:Recently, G&J Pepsi ran a marketing promotion. Reviewing daily reports, the team realized quickly sales failed to spike, immediately ceased the program, and diverted funds to a more profitable initiative.The company is also closing out month-end data within 24 hours, rather than two to three days. But most importantly, G&J Pepsi is now reviewing data frequently, constantly assessing the impact of volume and pricing on profitability. --------------Background:Business NeedsFor more than 40 years, G&J Pepsi-Cola Bottlers (G&J Pepsi) has been a leading bottler and distributor of Pepsi and other beverages throughout Kentucky and Ohio. Operating four manufacturing and 13 distribution facilities, the company is one of the largest Pepsi bottlers in the U.S. To run its complex operations, G&J Pepsi needs timely access to enterprise-wide data. For years, the company has used a solution based on Microsoft® Access®.“Consolidating data was a problem – we were always two days behind,” says Chris Witzgall, vice president of IT at G&J Pepsi. “Anytime we drilled into detailed information on products, customers, or vending locations, we had data performance issues.”Compounding matters, G&J Pepsi housed its data on five disparate servers. “We needed to bring our data into a single warehouse,” continues Witzgall. “We wanted a solution that would not only consolidate our data, but allow us to dig into it for more than just sales reporting.” SolutionG&J Pepsi adopted a Microsoft® Business Intelligence (BI) solution based on Microsoft SQL Server® 2005, Microsoft Office SharePoint® Server 2007, and Microsoft PerformancePoint® Server 2007 (now part of Office SharePoint Server 2007). Because the company had previously standardized on Microsoft for its back-office applications and already used SharePoint to enable collaboration, choosing Microsoft was a natural decision.“We wanted to utilize our existing Microsoft infrastructure,” says Witzgall. “But even more importantly, the Microsoft Business Intelligence solution had all the flexibility we needed. Microsoft gave us open access to our data – at a price we could afford.”More, Richer DataCincinnati-based PCMS IT Advisor Group, a Microsoft Gold Certified Partner that specializes in Information Worker Solutions based on Microsoft technology, helped G&J Pepsi craft and implement its solution. With PCMS providing valuable data warehouse knowledge and training, G&J Pepsi had all of its rich data in one place within months. “Microsoft Business Intelligence is so powerful that we were able to bring in all of our data, even if we didn’t think we’d ever use it,” says Daniel Foster, corporate IT project manager at G&J Pepsi. “For example, we can now access data from nearly 50 fields from our master customer data file. Our old reporting system took so long and was so cumbersome to manipulate that we’d pick and choose what information we wanted, usually limiting ourselves to only 15 fields.”With a richer pool of data, employees have more flexibility in how they analyze the business. “We can slice and dice information from different directions,” says Witzgall. “And we can get multiple types of data on one report, which you could never do in our old system. For example, with month-to-date data and fiscal-year data on the same report, we can really tell how one month’s performance will impact the entire year.”Role-Based SharePoint SitesAbout 300 of G&J Pepsi’s employees regularly use the company’s business intelligence solution, accessing SharePoint sites designed to give them information relevant to their job role. Now every functional group within the company – including finance, sales, operations, and vending – can easily view and analyze data.“We created customized SharePoint sites with reports and dashboards targeted at each user group,” explains Witzgall. “And if they want to conduct more detailed analysis, they can easily pull data into Excel and use powerful tools, such as Pivot Tables.”By monitoring performance more closely than ever, G&J Pepsi is able to respond quickly to changing business and market conditions. Witzgall explains: “We can evaluate product mixes for our most important customers and know immediately whether a marketing campaign is successful. Our sales team tracks month-to-date trends and opportunities. Vending looks at machine throughput, while operational teams view performance to forecast for manufacturing. We’re taking advantage of our Microsoft solution to make better decisions in nearly every part of the business.” BenefitsRecently, G&J Pepsi ran a marketing promotion. Reviewing daily reports, the team realized quickly sales failed to spike, immediately ceased the program, and diverted funds to a more profitable initiative.The company is also closing out month-end data within 24 hours, rather than two to three days. “Our VP of sales couldn’t believe it,” remarks Witzgall. “He’s thrilled to get final month-end numbers the next day.”But most importantly, G&J Pepsi is now reviewing data frequently, constantly assessing the impact of volume and pricing on profitability. “We’re asking questions every day about performance,” says Witzgall. “Microsoft Business Intelligence helps us monitor the business so we can improve performance. It’s a critical contributor to our goal of growing profits.”
Script:Data volumes are exploding with event data streaming from sources such as RFID, sensors and web logs across industries including manufacturing, financial services and utilities. The size and frequency of the data make it challenging to store for data mining and analysis. The ability to monitor, analyze and act on the data in motion provides significant opportunity to make more informed business decisions in near real-time.<click>StreamInsight, Microsoft’s Complex Event Processing platform allows you to process events with low latency so that action can be taken immediately based on the insights derived. Companies can process high volumes of data and scale up as required. Scale up and define as many queries as is required to process these streams. and Derive insights by correlating multiple event streams from multiple sources with near-zero latency for improved business decisions.StreamInsight is all about Enabling organizations to derive insights from streaming information in near real-time
Point of slide: Review Microsoft’s BI visionScript:Microsoft’s Business Intelligence vision is to “Improve organizations by providing business insights to all employees leading to better, faster, more relevant decisions.”We do this by providing: Comprehensive,integrated BI and performance management offerings Agile products that adapt to how you use information And a solution that is built upon a trusted IT backboneIn the end, we get the right information, in the right format, at the right time to the right people to better inform the decisions they make throughout the day. These decisions range from the strategic to tactical to operational, and all lead to a better performing company.
Point of the Slide: To show more detail on how we think of the BI architecture in three main layers.Flow of the Slide: A trusted BI platform is critical for a BI solution to work today. If we’re going to achieve the promise of BI, we need to have the confidence and trust in the data. And we need to know where it came from, and that it is both timely and reliable for us to use to make a decision. That’s where the power of an integrated BI platform like SQL Server comes into play.Once you have the data ready to use, the middle tier comes into play, where business users actually interact with the data and turn it into something that is useful to them to make the right decision. The numbers that we pull from other systems are just that—we need applications and content to turn them into actionable items. And that’s where the middle tier comes into play. Finally, we need the right tools and applications to ensure that we can use that data in the way we want to in order to make our decisions. Applications and tools that range from personal, to team, to organizational and corporate tools, all with a familiar look and feel, all integrated and working with my operating system, e-mail, and Internet search function. And this is what the power of integration through Microsoft Office brings you. From the Microsoft Office productivity tools like Excel to the team and collaboration tools of SharePoint. By integrating BI seamlessly into a broader business productivity suite that includes search, collaboration, unified communications, and content management, we offer the end user a much richer experience. Soundbite: With other BI solutions, you need 3 to 4 to 6 to 10 different products, footprints, and integration points. In our BI solution, we look at three main layers of data and information that you need—all within the Microsoft Office and SQL Server families: The data infrastructure and BI platform; the middle tier, where the business user comes into play, and the individual layer, where you and I use the data to make decisions.
Point of slide: To outline the key benefits of the Microsoft BI product offering and set up the following nine slides. Empower Your People: Empower all users to collaborate, discover, and manage their aspect of the business with the right information to make better, more agile decisions. By using familiar tools to create and share the right information, users are able to drive the business forward by responding in a timely fashion, and taking advantage of opportunities as they arise. Powerful self-service capabilities integrated into familiar tools enable users to create and share the right information quickly.Improve Organizational Effectiveness: Manage, drive, and define organizational success by aligning to key metrics and strategy, creating context driven dashboards that present the necessary information quickly and seamlessly. Measure the critical success factors and enable everyone to create and analyze the information they need to stay informed, and move the business forward. Enable accountability and transparency across the company, and remove barriers to productivity.Enable IT Efficiency: Provide a complete, integrated business collaboration platform that empowers users to discover, analyze, and share the right information across unstructured assets such as blogs, wikis, documents; and structured assets such as reports, line of business, and analytical systems. Built on standards, IT can address business requirements by putting information in the hands of users, focusing on developing, maintaining and securing the systems that drive the business forward and centrally manage the system.
Point of slide: To introduce PowerPivot for Excel.Flow of slide:Business value: Connect with the previous Microsoft BI Vision slide. PowerPivot works within Excel, the world’s most popular analysis tool, and enables more people in the organization to perform self-service analysis. It’s familiar to your users and can help lower training costs. Microsoft BI gets the right information to the right people faster. Providing self-service access to BI capabilities allows users to access, analyze, and collaborate on critical business information to make the best possible decisions. Technical features: The revolutionary PowerPivot for Excel allows you to quickly manipulate very large data sets and share analysis with co-workers—with little or no IT assistance. PowerPivot supports the unmatched analytical power and ease-of-use of Excel while allowing users to connect to any data source—databases, reports, data feeds, Web pages, Excel files, and more. After performing analysis, you can publish it to SharePoint 2010, further enabling collaboration with others. Benefit to IT: IT benefits from the managed self-service capabilities within PowerPivot, creating reports using SQL Server Reporting Services R2 and SharePoint 2010—thus providing a single version of truth—while you work directly with current and relevant data from those reports via Data Feeds. In addition, IT can track the usage of PowerPivot applications and discover mission-critical Excel applications.
Point of slide: To introduce other new features within Excel 2010.Use the powerful self-service analysis capabilities in Microsoft Excel to slice through massive amounts of data, uncover patterns, and find answers. Analysis tools include:Advanced Visualizations like new chart types to discover patterns, highlight trends, and spot exceptionsSlicers to slice and dice through large amounts of data and identify trendsPivotTables to interactively explore your data and summarize it in useful reportsNamed Sets to quickly identify and work with a relevant set of data every time
Point of slide: To introduce PowerPivot for Excel and SharePoint.Script:The revolutionary PowerPivot technology includes both an Excel add-in and server-based technology that integrates with SharePoint. This allows your users to quickly manipulate very large data sets and share analysis with co-workers—with little or no IT assistance. PowerPivot supports the unmatched analytical power and ease-of-use of Excel while allowing users to connect to any data source—databases, reports, data feeds, Web pages, Excel files, and more. After performing analysis, you can publish it to SharePoint 2010, further enabling collaboration with others. These capabilities provide a single version of truth for all users. IT also benefits from the managed self-service capabilities within PowerPivot. IT can now create reports using SQL Server Reporting Services R2 and SharePoint 2010 andtrack the usage of PowerPivot applications and discover mission-critical Excel applications. Conclusion: PowerPivot is the key to managed self-service BI and empowering end users. PowerPivotenables seamless and secure sharing and collaboration on user-generated BI solutions, while helping IT organizations increase efficiency through the PowerPivot Management Dashboard.
Point of slide: Elaborate on the capabilities provided through Reporting Services and Report Builder 3.0. Script:Working through the familiar Microsoft Office interface, users can use Report Builder 3.0 to intuitively build the reports they need. Report wizards and reusable report components make report building fast and easy. Accelerate report creation by leveraging existing content, such as queries, tables, charts, maps, gauges, and logos.Powerful query designer and flexible layout options enable end users to produce reports with rich visualizations while supporting all data sources. And, it’s easy to share reports in a SharePoint-based environment. Conclusion:Report Builder 3.0 supports the publishing and reuse of subcomponents to accelerate development and lower costs. Report Builder 3.0 also helps keep reports up to date by automatically synchronizing updates with published content objects. This empowers your end users to deliver meaningful, up to date reports largely independent of IT.
Point of slide: ToMake the most of reusable components and rich visualization capabilities to deliver meaningful, effective reporting solutions. New visualizations allow users to graphically convey the right information easily.Enjoy rich visualization of geospatial data: “Mash up” business information with geographic representations for location-based data visualization, including mapping, routing, and custom shapes.Visualize data within a single cell: With Sparklines, a new feature in Excel 2010, you can create small charts in a single cell to quickly discover patterns in your data. It’s a quick and easy way to highlight important data trends such as seasonal increases or decreases, saving you time.Zero in on the right data points quickly: Excel 2010 delivers new and exciting slice-and-dice capabilities. The Slicer feature provides you with a rich visualization of your PivotTable view so you can dynamically segment and filter the data to display just what you need. With the search filter, you can spend less time sifting through large data sets in your tables and PivotTable views, and more time analyzing. Take advantage of a more interactive and dynamic PivotChart: Quickly gather more insights within your PivotChart. Display different data views directly in a PivotChart, independent of PivotTable views, to analyze and capture the most compelling view for your numbers.
Point of slide: To set up the outline of the main body of the presentation. The presentation will include demos and two slides for each section.Script:In order to improve organizational effectiveness, you need to support business collaboration across the enterprise. This means your business intelligence solution needs to help you:Find people, expertise, and informationCapture and use business informationCollaborate anywhere, anytimeEnable alignment, transparency, and accountability.Over the next several slides and through demos, we’ll show you how Microsoft BI supports these important collaboration capabilities.
Point of slide: Tointroduce BI features in Sharepoint.Flow of slide:Now that the end user has performed his or her analysis within Excel, it is time to share insights with the rest of the organization. Excel Services, part of SharePoint Server 2010, makes sharing business insights easier, so everyone throughout your organization can make better business decisions. Integration with Excel Services allows you to broadly and securely publish spreadsheets and other information with colleagues. Specifically, Excel Services allows you to dynamically render an Excel spreadsheet as HTML so others can access, navigate, filter, and interact with the information within a Web browser. Excel Services also improves spreadsheet management, security, and spreadsheet model reuse using a scalable server-based calculation service and interactive Web-based user interface. With Excel Services, you can:Broaden the access and availability of spreadsheets by incorporating interactive spreadsheets into BI portals, dashboards, and scorecardsSecure and protect confidential information and maintain one version of the truth by locking down access at the serverPowerPivot for Sharepoint allows you to easily publish your PowerPivot workbooks and analysis to SharePoint 2010, enabling further analysis and collaboration with others via a web-based interface. SQL Server 2008 R2 also enables support for ad hoc BI applications in SharePoint, including automatic data refreshes and data processing with the same performance as in Excel.
Point of slide: ToSee http://www.microsoft.com/casestudies/Case_Study_Detail.aspx?CaseStudyID=4000000706.Energizer Holdings, based in St. Louis, Missouri, is a leading manufacturer of batteries, flashlights, and wet-shave products. The global company has made a significant investment in Microsoft Office software for its 6,800 knowledge workers, who also use dozens of specialized line-of-business (or LOB) applications to do their jobs. Energizer is installing Microsoft Office Professional 2007 on its desktop computers so that users can better access LOB data from within the familiar Microsoft Office system. Using 2007 Microsoft Office programs, Energizer employees will be better able to access the data they need with less application-switching, and to improve productivity by eliminating time-consuming process steps. The IT staff will be able to eliminate tedious data integration work and focus on creating new business capabilities. Supply chain managers at Energizer are able to use Office Excel 2007 to dynamically extract data from supply chain planning, statistical planning, sales history, and POS systems. “Previously, we could always import data into Excel, but it was clunky,” Benz says. “Now we can quickly link directly to data from multiple sources. Office Excel 2007 behaves like a real application environment.”
Point of slide: To introduce other features within SharePoint 2010Flow of slide: Now that you have shared your report, SharePoint 2010 enables the entire organization to discuss and engage with the data and with each other.Wikis and blogs: Wikis and blogging features with SharePoint 2010 make it easy for team members to comment and discuss insights.Tagging: Easily navigate through SharePoint with pervasive tagging.Content rating: Content rating enables users to give feedback on reports and to identify useful reports.
Point of slide: To highlight how search features help to find organizational data.Search for relevant BI content:Use Microsoft SharePoint Server 2010, the Microsoft enterprise search solution, to increase productivity. Advanced search features help reduce BI information overload by enabling you to find relevant content quickly. With smarter, more visual, and more conversational intranet searches, SharePoint Server 2010 lets you go beyond documents to unlock BI information and effectively search for people, documents, and data—and deliver actionable search results. Build customized search scenarios and deliver results quickly for role-specific, context-driven needs, expanding your ability to apply BI insights across the organization.
Point of slide: To highlight dashboards.Publish rich Excel workbooks or objects to create insightful dashboards:SharePoint 2010 helps you collaborate on data, documents, and decision-making, so you can further improve organizational effectiveness. SharePoint provides collaborative features to ensure that content is created, accessed, and shared in a transparent and accountable environment. For example, you can tag a document with metadata to make the document more relevant and easier to find. SharePoint can help track documents and alert you to content updates relevant to your user group, meeting space, and team or project site. SharePoint Server 2010 also supports workflows that can streamline approval processes and built-in versioning to help you better manage content and data access.
Point of slide: Introduce “Administrative Consistency” and how it helps increase IT efficiency.Script:Underpinning all three pillars related to increasing IT efficiency is Microsoft’s unique approach to administrative consistency.
Point of the Slide: To show how the broad set of out-of-the-box capabilities provided with SharePoint and SQL allow you to consolidate your multiple investments to save on cost and complexity. Flow of the Slide: Out of the box SQL is a robust BI platform and provides a set of integrated capabilities that allow you to consolidate your investments:Analytics – SQL Server Analysis Services is the leading OLAP engine on the market today. Reporting – SQL Server Reporting Services provides robust reporting capabilities and authoring environment.Data Mining – SQL Server provides powerful data mining capabilities and innovative data mining add-ins for Excel.Data Quality – SQL Server provides data quality capabilities to ensure your data is correct. Master Data Management – SQL Server provides capabilities around Master Data Management, allowing you to continue managing the synchronization of data throughout your organization. ETL – SQL Server Integration services provides extract, transform, and load capabilities to help you consolidate your data from across your organization. Data Warehousing – SQL Server provides enterprise scale data warehousing capabilities. SharePoint is a broad collaborative environment that provides capabilities such as portal, collaboration, forms and workflow, search, scorecards and dashboards, and enterprise content management.
Point of the Slide:SQL Server has a strong lineup of Data Warehouse offerings based on scale-up architecture. SQL Server 2008 Enterprise and the Fast Track Data Warehouse enables customers to scale their data warehouses on single servers through a scale up architecture. In addition, project Madison that will ship in H1 of CY2010 will enable customers to deploy very high scale data warehouses up to one petabyte through a scale out architecture. Based on a massively parallel processing (MPP) with shared nothing architecture, Madison will enable customers to implement extremely large data warehouses with high performance at low cost. Customers can scale their data warehouses affordably by adding more commodity hardware rather than buying large hardware servers. Thanks to the heavy investment, SQL Server 2008 offers the following new features that reduce the cost while improving scalability and performance of data warehouses: Query Optimizations:The new query enhancements in SQL Server 2008 will improve the performance of your BI and data warehouse queries out of the box. The star join query optimizations improve the performance of queries on data warehouses that use a star join schema. New enhancements in parallel query processing will also boost the performance of your BI and data warehouse queries with no additional effort. Resource Governor:Scale your data warehouse seamlessly using the new Resource Governor in SQL Server 2008. As more user groups with different requirements join your data warehouse, the new Resource Governor enables you to manage them easily on the same platform. Resource Governor enables you to allocate resources (for example, memory and CPU) to different user groups based on their needs. As a result, no single user group can use too many resources or freeze other users. Enhanced Partitioning:The new enhancements in parallel partitioning will boost the performance of queries that use partitioned tables. Database and Backup Compression:The new database compression feature in SQL Server 2008 helps customers reduce their storage cost while improving performance of data warehouses. Benchmarks have shown compression ratios of 2X to 12X, although a 2.5X ratio is more typical. Reduction of data leads directly to storage savings for our customers and partnersThe new backup compression also reduces the size of backup data for customers. Smaller back-up data also speed up backups and restore operations. As a result customers will reduce their backup cost through the new backup compression feature in SQL Server 2008.
Point of slide: To show how Microsoft BI enables IT to easily manage the BI environment.Easily manage the self-service environment:Self-service is great for end users, but IT still needs to control access, security, and quality. Enhanced administration capabilities are available within the new administration dashboard within SharePoint. The administration dashboard allows IT to monitor and govern the content that workers create using self-service tools. IT can track, review, and report on thousands of users, so they can determine the content being used, evaluate the reports being accessed, and identify other access and frequency trends, so that they can more quickly shift resources and support to the areas of greatest need.
Point of slide: To show how Microsoft helps you increase productivity in your IT department through the delivery of familiar and intuitive development and management tools.Flow of slide: Productivity Enhancing Designers – By delivering BI capabilities through the familiar design environments such as the BI Development Studio in Microsoft Visual Studio® and Microsoft Office SharePoint Designer, developers can get up speed quickly without having to learn new skills. Integrated Development Environment – Utilizing the same familiar development environment for multiple capabilities allows developers to integrate BI capabilities into their app design more easily, such as with the Reporting Services capability in Visual Studio. User Driven App Administration and Monitoring – Enhanced administration capabilities can be demonstrated through the new admin dashboard for Gemini, allowing you to monitor and govern the content that end users are creating through the self-service tools.
Point of slide: Describe master data services (data alignment across multiple systems)Script:The recent emphasis on regulatory compliance, SOA, and mergers and acquisitions has made the creating and maintaining of accurate and complete master data a business imperative.IT is challenged with delivering high quality master data including: creating, maintaining and delivering trusted versions of master data and relationships. Delivers single, trusted versions of critical data assets and their relationships across heterogeneous platforms Delivers trusted master data to downstream data warehouse, analytics and BI systems in consumable formatsAnother important capability of Microsoft BI is the ability to align data across multiple heterogeneous systems with Master Data Services.
Point of slide: ToGartner Inc. recently positioned Microsoft as a Leader in the Magic Quadrant for BI Platforms. Microsoft’s StrengthsMicrosoft joined the BI market relatively late with a broadly capable product set at a low price point. Since then it has consistently developed its offering, edging into the Leaders quadrant in last year’s BI Platform Magic Quadrant. Microsoft’s pricing and packaging of its BI platform make it an attractive proposition for organizations new to BI or firms that are looking to reduce their portfolio of BI tools and lower their annual software maintenance bills. Growing market penetration — almost a third of the reference customers Microsoft nominated to take part in the research for this report had bought its BI platform in the last year, corroborating earlier analysis finding a strong intent to purchase for Microsoft in this market. Strong leverage of installed base of products. By placing Excel, SQL Server, and the very rapidly spreading SharePoint Server at the center its BI strategy, Microsoft virtually guarantees its BI offering’s continued adoption. Microsoft’s BI plafform appeals to the large community of Microsoft application developers — its development tools were rated the best of any vendor in the market by the customers surveyed.
Point of the Slide: Reinforce the message that this is an area of importance for the companyFlow of the Slide:If you’d like to take some time on your own and learn more about our BI capabilities, customers who are utilizing them, and ways we can help users throughout your organization, we’d invite you to visit us at www.microsoft.com/bi to learn more about how our solutions can help your organizationSoundbite: If you’d like to learn more about how we can help you drive performance and intelligence to every employee in your organization, we’d invite you to visit us at www.microsoft.com/bi for more information.
Point of slide: Committed to your success:Microsoft Services: Microsoft Services can help you realize the full potential of our products. It offers proven methodologies during the entire application life cycle, from Architecture Planningto Solution Implementation to Solution Support. The use of best practices ensures reduced project risk, increased implementation velocity, and more predictable outcomes.Advisory Architecture and PlanningHighly skilled Application Platform consultingEnterprise support for high availability, critical applicationsProven adoption methodologies to reduce risk and increase velocityMicrosoft Partners and ISVs: The Microsoft Partner program and other certifications for partners and ISVs makes it easy for you to find a partner to help you—at either a global or a local level.LOB applications to fit your needsGlobal and local presenceTrained, certified, and assisted by MicrosoftMicrosoft Learning: Microsoft Learning, together with MSDN and TechNet provides a wealth of readiness training that you can use to quickly develop the skills you need to implement and manage Microsoft technologies.IT Pro communities to share latest trends and innovationOnline and classroom trainingCertification to ensure qualityApplication Platform: The Application Platform Optimization 2.0 tool provides the starting point for evaluating your existing applications and identifying how to optimize them with the Microsoft Application PlatformHelp you assess your business applicationsPropose technology solution plan to answer your business and IT requirementsIMPORTANT LINKS:If you’d like to learn more about how we can help you drive performance and intelligence to every employee in your organization, we’d invite you to visit us at www.microsoft.com/bi and www.microsoft.com/applicationplatform for more information.
Your free PASS membership enables access to 12 Virtual Chapters, 24 Hours of PASS broadcasts, local PASS Chapters, professional development resources, newsletters, events calendar, and much moreMeet up with like-minded professionals throughout the year at face-to-face PASS Chapter meetings, discuss topical SQL Server issues, share tips and tricks, network, enjoy special guest speakers and get access to all things PASSAt PASS Summit,meet top industry experts , learn about best practices, effective troubleshooting, how to prevent issues, save money, and build a better SQL Server environment