Downloaded 25 times


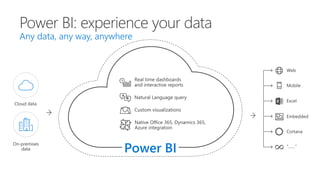
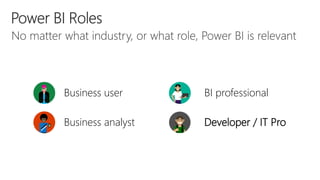


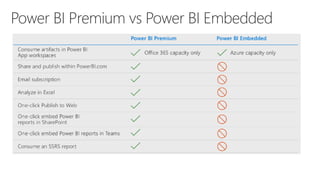
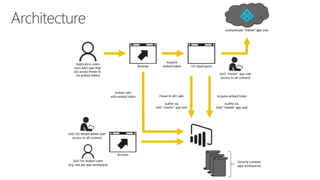
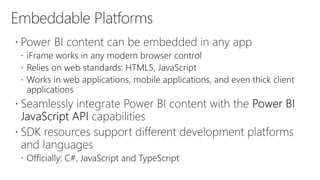
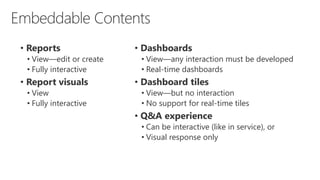


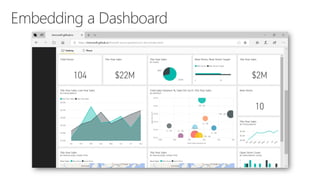
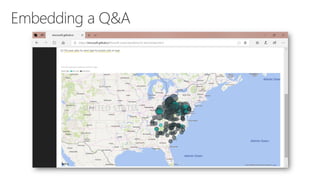


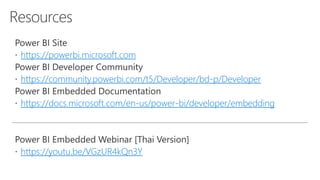


This document discusses different roles and their capabilities with Power BI. It outlines that business users can view dashboards, reports, and visuals but cannot build real-time dashboards or interact with tiles. BI professionals and developers can embed, integrate, and develop custom visuals, connectors, and real-time dashboards for Power BI. It also provides links for working with the Power BI API and for additional learning resources.


![Mvpskill Saturday[EP48]Microsoft 365 Update [27 FEB 2021]](https://cdn.slidesharecdn.com/ss_thumbnails/mvpskillsaturdayep48-27sept2021-210227155111-thumbnail.jpg?width=640&height=640&fit=bounds)


