Downloaded 77 times


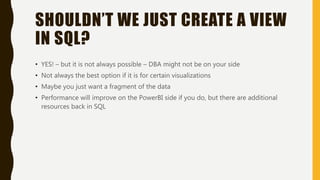


![WHAT CAN WE DO?
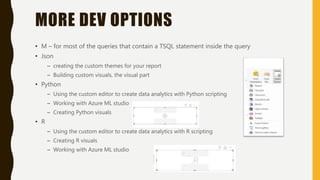
• Select and calculate the number of distinct rows –
The Business Question: How many different currencies the company is currently
supporting?
Answer:
Diffrent Currency = COUNTROWS(DISTINCT(FactResellerSales[CurrencyKey]))
= COUNTROWS(DISTINCT(FactResellerSales[ResellerKey]))
OR built in PowerBI visual that does the same](https://image.slidesharecdn.com/daxsqlinpowerbi-190914195202/85/Dax-sql-in-power-bi-31-320.jpg)

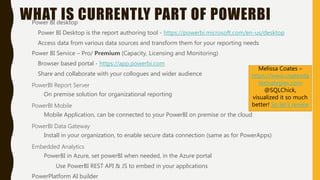
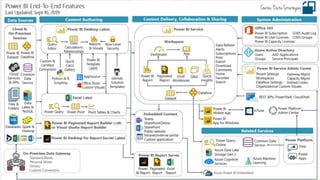
The document provides an overview of Power BI, a suite of business analytics tools designed for data analysis and visualization. It discusses key components such as Power BI Desktop, Service, and Mobile, along with the use of SQL, DAX, and data connections for reporting, and emphasizes best practices for creating effective data visualizations. It also outlines the integration of Power BI with Azure and the importance of security and data management processes.


