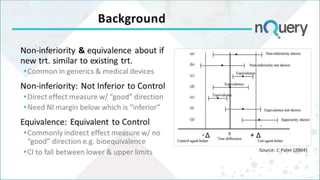
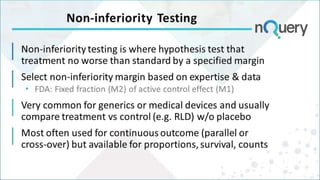
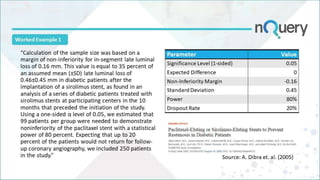
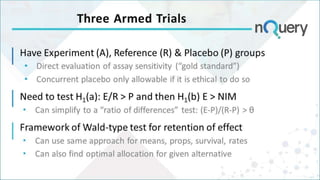
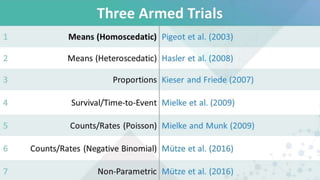
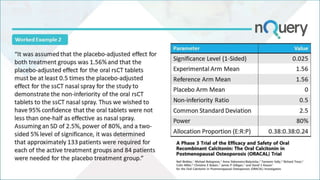
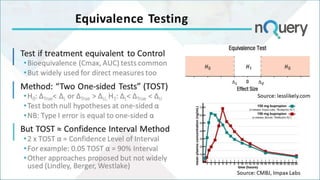
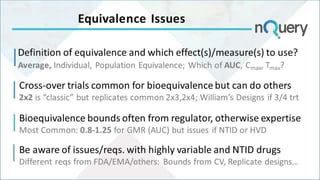
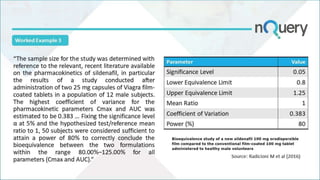
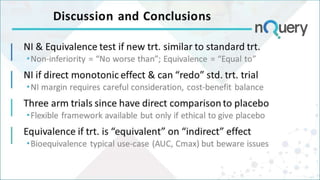
Non-inferiority And Equivalence
Design considerations and sample size
DEMONSTRATED ON
Head of Statistics
nQuery Lead Researcher
FDA Guest Speaker
Guest Lecturer
Webinar Host
HOSTED BY:
Ronan
Fitzpatrick
AGENDA
1. Background
2. Non-inferiority Testing
3. Equivalence Testing
4. Conclusions and Discussion
The complete trial design platform to make clinical trials
faster, less costly and more successful
The solution for optimizing clinical trials
In 2019, 90% of organizations with clinical trials approved by
the FDA used nQuery
BackgroundPart 1
Non-inferiority & equivalence about if
new trt. similar to existing trt.
•Common in generics & medical devices
Non-inferiority: Not Inferior to Control
•Direct effect measure w/ “good” direction
•Need NI margin below which is “inferior”
Equivalence: Equivalent to Control
•Commonly indirect effect measure w/ no
“good” direction e.g. bioequivalence
•CI to fall between lower & upper limits
Background
Source: C Pater (2004)
Non-inferiority TestingPart 2
Non-inferiority Testing
Non-inferiority testing is where hypothesis test that
treatment no worse than standard by a specified margin
Select non-inferiority margin based on expertise & data
 FDA: Fixed fraction (M2) of active control effect (M1)
Very common for generics or medical devices and usually
compare treatment vs control (e.g. RLD) w/o placebo
Most often used for continuous outcome (parallel or
cross-over) but available for proportions, survival, counts
“Calculation of the sample size was based on a
margin of non-inferiority for in-segment late luminal
loss of 0.16 mm. This value is equal to 35 percent of
an assumed mean (±SD) late luminal loss of
0.46±0.45 mm in diabetic patients after the
implantation of a sirolimus stent, as found in an
analysis of a series of diabetic patients treated with
sirolimus stents at participating centers in the 10
months that preceded the initiation of the study.
Using a one-sided α level of 0.05, we estimated that
99 patients per group were needed to demonstrate
noninferiority of the paclitaxel stent with a statistical
power of 80 percent. Expecting that up to 20
percent of the patients would not return for follow-
up coronary angiography, we included 250 patients
in the study.” Source: A. Dibra et. al. (2005)
Parameter Value
Significance Level (1-sided) 0.05
Expected Difference 0
Non-Inferiority Margin -0.16
Standard Deviation 0.45
Power 80%
Dropout Rate 20%
Worked Example 1
Non-inferiority Discussion
Size of the NI margin can take into account other
considerations other than standard trt. effect size
•Safety profile, secondary endpoints, easier administration
•But in general, conservative NI margin is encouraged (FDA)
Strong assumption for 2-trt. design that standard trt.
effect size retained from its approval (assay sensitivity)
•May need to replicate previous study conditions very closely
•May need additional evidence/data for regulatory approval
Note closely related “Superiority by Margin” hypothesis
Three Armed Trials
Have Experiment (A), Reference (R) & Placebo (P) groups
• Direct evaluation of assay sensitivity (“gold standard”)
• Concurrent placebo only allowable if it is ethical to do so
Need to test H1(a): E/R > P and then H1(b) E > NIM
 Can simplify to a “ratio of differences” test: (E-P)/(R-P) > θ
Framework of Wald-type test for retention of effect
 Can use same approach for means, props, survival, rates
 Can also find optimal allocation for given alternative
Three Armed Trials
1 Means (Homoscedatic) Pigeot et al. (2003)
2 Means (Heteroscedatic) Hasler et al. (2008)
3 Proportions Kieser and Friede (2007)
4 Survival/Time-to-Event Mielke et al. (2009)
5 Counts/Rates (Poisson) Mielke and Munk (2009)
6 Counts/Rates (Negative Binomial) Mütze et al. (2016)
7 Non-Parametric Mütze et al. (2016)
Worked Example 2
Parameter Value
Significance Level (1-Sided) 0.025
Experimental Arm Mean 1.56
Reference Arm Mean 1.56
Placebo Arm Mean 0
Non-inferiority Ratio 0.5
Common Standard Deviation 2.5
Power 80%
Allocation Proportion (E:R:P) 0.38:0.38:0.24
“It was assumed that the placebo-adjusted effect for
both treatment groups was 1.56% and that the
placebo-adjusted effect for the oral rsCT tablets
must be at least 0.5 times the placebo-adjusted
effect for the ssCT nasal spray for the study to
demonstrate the non-inferiority of the oral rsCT
tablets to the ssCT nasal spray. Thus we wished to
have 95% confidence that the oral tablets were not
less than one-half as effective as nasal spray.
Assuming an SD of 2.5%, power of 80%, and a two-
sided 5% level of significance, it was determined
that approximately 133 patients were required for
each of the active treatment groups and 84 patients
were needed for the placebo treatment group.”
Equivalence TestingPart 3
Test if treatment equivalent to Control
•Bioequivalence (Cmax, AUC) tests common
•But widely used for direct measures too
Method: “Two One-sided Tests” (TOST)
•H0: ΔTrue< ΔL or ΔTrue > ΔU, H1: ΔL< ΔTrue < ΔU
•Test both null hypotheses at one-sided α
•NB: Type I error is equal to one-sided α
But TOST ≈ Confidence Interval Method
•2 x TOST α = Confidence Level of Interval
•For example: 0.05 TOST α = 90% Interval
•Other approaches proposed but not widely
used (Lindley, Berger, Westlake)
Equivalence Testing
Source: lesslikely.com
Source: CMBJ, Impax Labs
Definition of equivalence and which effect(s)/measure(s) to use?
Average, Individual, Population Equivalence; Which of AUC, Cmax, Tmax?
Equivalence Issues
Cross-over trials common for bioequivalence but can do others
2x2 is “classic” but replicates common 2x3,2x4; William’s Designs if 3/4 trt
Bioequivalence bounds often from regulator, otherwise expertise
Most Common: 0.8-1.25 for GMR (AUC) but issues if NTID or HVD
Be aware of issues/reqs. with highly variable and NTID drugs
Different reqs from FDA/EMA/others: Bounds from CV, Replicate designs…
“The sample size for the study was determined with
reference to the relevant, recent literature available
on the pharmacokinetics of sildenafil, in particular
the results of a study conducted after
administration of two 25 mg capsules of Viagra film-
coated tablets in a population of 12 male subjects.
The highest coefficient of variance for the
pharmacokinetic parameters Cmax and AUC was
estimated to be 0.383 … Fixing the significance level
α at 5% and the hypothesized test/reference mean
ratio to 1, 50 subjects were considered sufficient to
attain a power of 80% to correctly conclude the
bioequivalence between the two formulations
within the range 80.00%–125.00% for all
parameters (Cmax and AUC).”
Source:
nejm.org
Parameter Value
Significance Level 0.05
Lower Equivalence Limit 0.8
Upper Equivalence Limit 1.25
Mean Ratio 1
Coefficient of Variation 0.383
Power (%) 80
Worked Example 3
Source: Radicioni M et al (2016)
Discussion and Conclusions
NI & Equivalence test if new trt. similar to standard trt.
Non-inferiority = “No worse than”; Equivalence = “Equal to”
NI if direct monotonic effect & can “redo” std. trt. trial
NI margin requires careful consideration, cost-benefit balance
Three arm trials since have direct comparison to placebo
Flexible framework available but only if ethical to give placebo
Equivalence if trt. is “equivalent” on “indirect” effect
Bioequivalence typical use-case (AUC, Cmax) but beware issues
Further information at Statsols.com
Questions?
Thank You
info@statsols.com
nQuery Summer 2020 Release
The Summer 2020 (v8.6) release adds 26 new tables
to nQuery across multiple areas
MAMS
MCP-MOD
Phase II Group
Sequential Tests
for Proportions
(Fleming’s Design)
GST + SSR
Cluster
Randomized
Stepped-Wedge
Designs
Survival/
Time-to-Event
Trials
Confidence
Intervals for
Proportions
Three Armed Trials
Non-inferiority
Statsols.com/trial
For video tutorials
and worked examples
Statsols.com/start
The solution for optimizing clinical trials
PRE-CLINICAL
/ RESEARCH
EARLY PHASE
CONFIRMATORY
POST MARKETING
Animal Studies
ANOVA / ANCOVA
1000+ Scenarios for Fixed Term,
Adaptive & Bayesian Methods
Survival, Means, Proportions &
Count endpoints
Sample Size Re-Estimation
Group Sequential Trials
Bayesian Assurance
Cross over & personalized medicine
CRM
MCP-Mod
Simon’s Two Stage
Fleming’s GST
Cohort Study
Case-control Study
References
Senn, S. (2002). Cross-over trials in clinical research (2nd Edition). John Wiley & Sons.
Pater, C. (2004). Equivalence and noninferiority trials–are they viable alternatives for registration of
new drugs?(III). Current controlled trials in cardiovascular medicine, 5(1), 8.
Food and Drug Administration Non-inferiority clinical trials to establish effectiveness. Guidance for
industry. November 2016. https://www.fda.gov/downloads/Drugs/Guidances/UCM202140.pdf
Blackwelder, W.C., 2002. Showing a Treatment Is Good Because It Is Not Bad: When Does
‘Noninferiority’ Imply Effectiveness?. Control Clinical Trials, 23, pp. 52–54.
Chow, S.C., Shao, J., 2006. On Non-Inferiority Margin and Statistical Tests in Active Control Trial.”
Statistics in Medicine, 25, pp. 1101–1113.
Fleming, T.R., 2008. Current Issues in Non-inferiority Trials. Statistics in Medicine, 27, pp. 317-332.
Althunian, T.A., de Boer, A., Groenwold, R.H. and Klungel, O.H., 2017. Defining the noninferiority margin
and analysing noninferiority: an overview. British journal of clinical pharmacology, 83(8), pp.1636-1642.
Dibra, A., et al (2005). Paclitaxel-eluting or sirolimus-eluting stents to prevent restenosis in diabetic
patients. New England Journal of Medicine, 353(7), 663-670.
References
I. Pigeot, J. Schäfer, J. Röhmel, D. Hauschke., 2003. Assessing non-inferiority of a new treatment in a
three-arm clinical trial including a placebo. Statistics in Medicine, 22, pp. 883-899.
M. Kieser, T. Friede., 2007. Planning and analysis of three‐arm non‐inferiority trials with binary
endpoints. Statistics in Medicine, 26, pp. 253-273.
M. Hasler, R. Vonk, L.A. Hothorn., 2008. Assessing non-inferiority of a new treatment in a three-arm
trial in the presence of heteroscedasticity. Statistics in Medicine, 27, pp. 490-503.
M. Mielke, A. Munk, and A. Schacht., 2008. The assessment of non‐inferiority in a gold standard design
with censored, exponentially distributed endpoints. Statistics in Medicine, 27, pp. 5093-5110.
M. Mielke and A. Munk., 2009. The assessment and planning of non-inferiority trials for retention of
effect hypotheses-towards a general approach. arXiv:0912.4169
Mielke, M., 2010. Maximum Likelihood Theory for Retention of Effect Non-Inferiority Trials (Doctoral
dissertation, Niedersächsische Staats-und Universitätsbibliothek Göttingen).
T. Mütze, A. Munk, T. Friede., 2016. Design and analysis of three‐arm trials with negative binomially
distributed endpoints. Statistics in Medicine, 35, pp. 505-521.
References
T. Mütze, F. Konietschke, A. Munk, T. Friede., 2017, A studentized permutation test for three-arm trials in
the `gold standard’ design. Statistics in Medicine, 36, pp. 883-898.
Binkley, N., Bolognese, M., Sidorowicz‐Bialynicka, A., Vally, T., Trout, R., Miller, C., Buben, C.E., Gilligan, J.P.,
Krause, D.S. and Oral Calcitonin in Postmenopausal Osteoporosis (ORACAL) Investigators, 2012. A phase 3
trial of the efficacy and safety of oral recombinant calcitonin: the Oral Calcitonin in Postmenopausal
Osteoporosis (ORACAL) trial. Journal of bone and mineral research, 27(8), pp.1821-1829.
Food and Drug Administration Statistical approaches to establishing bioequivalence. Guidance for
industry. 2001. https://www.fda.gov/media/70958/download
European Medicines Agency, CHMP. Guideline on the Investigation of Bioequivalence. London; 2010 Jan
20.www.ema.europa.eu/docs/en_GB/document_library/Scientific_guideline/2010/01/WC500070039.pdf
Food and Drug Administration Draft Guidance on Progesterone. 2001.
https://www.accessdata.fda.gov/drugsatfda_docs/psg/Progesterone_caps_19781_RC02-11.pdf
Schuirmann DJ. A Comparison of the Two One-Sided Tests Procedure and the Power Approach for
Assessing the Equivalence of Average Bioavailability. J Pharmacokinet Biopharm. 1987; 15(6): 657–80.
Senn, S. (2001). Statistical issues in bioequivalence. Statistics in Medicine, 20, 2785-2799.
References
Kirkwood TBL. Bioequivalence testing—a need to rethink. Biometrics 1981; 37:589–591.
Berger R, Hsu J. Bioequivalence trials, intersection-union tests, and equivalence confidence sets.
Statistical Science 1996; 11:283–319
O’Quigley, J. and C. Baudoin, General approaches to the problem of bioequivalence. The Statistician,
1988. 37: p. 51-58.
Westlake WJ. Symmetrical confidence intervals for bioequivalence trials. Biometrics 1976; 32:741–744
Lindley DV. Decision analysis and bioequivalence trials. Statistical Science 1998; 13:136 –141.
Schütz, H., Reference-scaled Average Bioequivalence. Bebac https://bebac.at/lectures/Moscow2016-
3.pdf
Tóthfalusi L et al. Evaluation of the Bioequivalence of Highly-Variable Drugs and Drug Products. Pharm
Res. 2001;18(6): 728–33.
Radicioni, M., Castiglioni, C., Giori, A., Cupone, I., Frangione, V. and Rovati, S., 2017. Bioequivalence
study of a new sildenafil 100 mg orodispersible film compared to the conventional film-coated 100 mg
tablet administered to healthy male volunteers. Drug Design, Development and Therapy, 11, p.1183.

Non-inferiority and Equivalence Study design considerations and sample size

  • 1.
    Non-inferiority And Equivalence Designconsiderations and sample size DEMONSTRATED ON
  • 2.
    Head of Statistics nQueryLead Researcher FDA Guest Speaker Guest Lecturer Webinar Host HOSTED BY: Ronan Fitzpatrick
  • 3.
    AGENDA 1. Background 2. Non-inferiorityTesting 3. Equivalence Testing 4. Conclusions and Discussion
  • 4.
    The complete trialdesign platform to make clinical trials faster, less costly and more successful The solution for optimizing clinical trials
  • 5.
    In 2019, 90%of organizations with clinical trials approved by the FDA used nQuery
  • 6.
  • 7.
    Non-inferiority & equivalenceabout if new trt. similar to existing trt. •Common in generics & medical devices Non-inferiority: Not Inferior to Control •Direct effect measure w/ “good” direction •Need NI margin below which is “inferior” Equivalence: Equivalent to Control •Commonly indirect effect measure w/ no “good” direction e.g. bioequivalence •CI to fall between lower & upper limits Background Source: C Pater (2004)
  • 8.
  • 9.
    Non-inferiority Testing Non-inferiority testingis where hypothesis test that treatment no worse than standard by a specified margin Select non-inferiority margin based on expertise & data  FDA: Fixed fraction (M2) of active control effect (M1) Very common for generics or medical devices and usually compare treatment vs control (e.g. RLD) w/o placebo Most often used for continuous outcome (parallel or cross-over) but available for proportions, survival, counts
  • 10.
    “Calculation of thesample size was based on a margin of non-inferiority for in-segment late luminal loss of 0.16 mm. This value is equal to 35 percent of an assumed mean (±SD) late luminal loss of 0.46±0.45 mm in diabetic patients after the implantation of a sirolimus stent, as found in an analysis of a series of diabetic patients treated with sirolimus stents at participating centers in the 10 months that preceded the initiation of the study. Using a one-sided α level of 0.05, we estimated that 99 patients per group were needed to demonstrate noninferiority of the paclitaxel stent with a statistical power of 80 percent. Expecting that up to 20 percent of the patients would not return for follow- up coronary angiography, we included 250 patients in the study.” Source: A. Dibra et. al. (2005) Parameter Value Significance Level (1-sided) 0.05 Expected Difference 0 Non-Inferiority Margin -0.16 Standard Deviation 0.45 Power 80% Dropout Rate 20% Worked Example 1
  • 11.
    Non-inferiority Discussion Size ofthe NI margin can take into account other considerations other than standard trt. effect size •Safety profile, secondary endpoints, easier administration •But in general, conservative NI margin is encouraged (FDA) Strong assumption for 2-trt. design that standard trt. effect size retained from its approval (assay sensitivity) •May need to replicate previous study conditions very closely •May need additional evidence/data for regulatory approval Note closely related “Superiority by Margin” hypothesis
  • 12.
    Three Armed Trials HaveExperiment (A), Reference (R) & Placebo (P) groups • Direct evaluation of assay sensitivity (“gold standard”) • Concurrent placebo only allowable if it is ethical to do so Need to test H1(a): E/R > P and then H1(b) E > NIM  Can simplify to a “ratio of differences” test: (E-P)/(R-P) > θ Framework of Wald-type test for retention of effect  Can use same approach for means, props, survival, rates  Can also find optimal allocation for given alternative
  • 13.
    Three Armed Trials 1Means (Homoscedatic) Pigeot et al. (2003) 2 Means (Heteroscedatic) Hasler et al. (2008) 3 Proportions Kieser and Friede (2007) 4 Survival/Time-to-Event Mielke et al. (2009) 5 Counts/Rates (Poisson) Mielke and Munk (2009) 6 Counts/Rates (Negative Binomial) Mütze et al. (2016) 7 Non-Parametric Mütze et al. (2016)
  • 14.
    Worked Example 2 ParameterValue Significance Level (1-Sided) 0.025 Experimental Arm Mean 1.56 Reference Arm Mean 1.56 Placebo Arm Mean 0 Non-inferiority Ratio 0.5 Common Standard Deviation 2.5 Power 80% Allocation Proportion (E:R:P) 0.38:0.38:0.24 “It was assumed that the placebo-adjusted effect for both treatment groups was 1.56% and that the placebo-adjusted effect for the oral rsCT tablets must be at least 0.5 times the placebo-adjusted effect for the ssCT nasal spray for the study to demonstrate the non-inferiority of the oral rsCT tablets to the ssCT nasal spray. Thus we wished to have 95% confidence that the oral tablets were not less than one-half as effective as nasal spray. Assuming an SD of 2.5%, power of 80%, and a two- sided 5% level of significance, it was determined that approximately 133 patients were required for each of the active treatment groups and 84 patients were needed for the placebo treatment group.”
  • 15.
  • 16.
    Test if treatmentequivalent to Control •Bioequivalence (Cmax, AUC) tests common •But widely used for direct measures too Method: “Two One-sided Tests” (TOST) •H0: ΔTrue< ΔL or ΔTrue > ΔU, H1: ΔL< ΔTrue < ΔU •Test both null hypotheses at one-sided α •NB: Type I error is equal to one-sided α But TOST ≈ Confidence Interval Method •2 x TOST α = Confidence Level of Interval •For example: 0.05 TOST α = 90% Interval •Other approaches proposed but not widely used (Lindley, Berger, Westlake) Equivalence Testing Source: lesslikely.com Source: CMBJ, Impax Labs
  • 17.
    Definition of equivalenceand which effect(s)/measure(s) to use? Average, Individual, Population Equivalence; Which of AUC, Cmax, Tmax? Equivalence Issues Cross-over trials common for bioequivalence but can do others 2x2 is “classic” but replicates common 2x3,2x4; William’s Designs if 3/4 trt Bioequivalence bounds often from regulator, otherwise expertise Most Common: 0.8-1.25 for GMR (AUC) but issues if NTID or HVD Be aware of issues/reqs. with highly variable and NTID drugs Different reqs from FDA/EMA/others: Bounds from CV, Replicate designs…
  • 18.
    “The sample sizefor the study was determined with reference to the relevant, recent literature available on the pharmacokinetics of sildenafil, in particular the results of a study conducted after administration of two 25 mg capsules of Viagra film- coated tablets in a population of 12 male subjects. The highest coefficient of variance for the pharmacokinetic parameters Cmax and AUC was estimated to be 0.383 … Fixing the significance level α at 5% and the hypothesized test/reference mean ratio to 1, 50 subjects were considered sufficient to attain a power of 80% to correctly conclude the bioequivalence between the two formulations within the range 80.00%–125.00% for all parameters (Cmax and AUC).” Source: nejm.org Parameter Value Significance Level 0.05 Lower Equivalence Limit 0.8 Upper Equivalence Limit 1.25 Mean Ratio 1 Coefficient of Variation 0.383 Power (%) 80 Worked Example 3 Source: Radicioni M et al (2016)
  • 19.
    Discussion and Conclusions NI& Equivalence test if new trt. similar to standard trt. Non-inferiority = “No worse than”; Equivalence = “Equal to” NI if direct monotonic effect & can “redo” std. trt. trial NI margin requires careful consideration, cost-benefit balance Three arm trials since have direct comparison to placebo Flexible framework available but only if ethical to give placebo Equivalence if trt. is “equivalent” on “indirect” effect Bioequivalence typical use-case (AUC, Cmax) but beware issues
  • 20.
    Further information atStatsols.com Questions? Thank You info@statsols.com
  • 21.
    nQuery Summer 2020Release The Summer 2020 (v8.6) release adds 26 new tables to nQuery across multiple areas MAMS MCP-MOD Phase II Group Sequential Tests for Proportions (Fleming’s Design) GST + SSR Cluster Randomized Stepped-Wedge Designs Survival/ Time-to-Event Trials Confidence Intervals for Proportions Three Armed Trials Non-inferiority
  • 22.
  • 23.
    For video tutorials andworked examples Statsols.com/start
  • 24.
    The solution foroptimizing clinical trials PRE-CLINICAL / RESEARCH EARLY PHASE CONFIRMATORY POST MARKETING Animal Studies ANOVA / ANCOVA 1000+ Scenarios for Fixed Term, Adaptive & Bayesian Methods Survival, Means, Proportions & Count endpoints Sample Size Re-Estimation Group Sequential Trials Bayesian Assurance Cross over & personalized medicine CRM MCP-Mod Simon’s Two Stage Fleming’s GST Cohort Study Case-control Study
  • 25.
    References Senn, S. (2002).Cross-over trials in clinical research (2nd Edition). John Wiley & Sons. Pater, C. (2004). Equivalence and noninferiority trials–are they viable alternatives for registration of new drugs?(III). Current controlled trials in cardiovascular medicine, 5(1), 8. Food and Drug Administration Non-inferiority clinical trials to establish effectiveness. Guidance for industry. November 2016. https://www.fda.gov/downloads/Drugs/Guidances/UCM202140.pdf Blackwelder, W.C., 2002. Showing a Treatment Is Good Because It Is Not Bad: When Does ‘Noninferiority’ Imply Effectiveness?. Control Clinical Trials, 23, pp. 52–54. Chow, S.C., Shao, J., 2006. On Non-Inferiority Margin and Statistical Tests in Active Control Trial.” Statistics in Medicine, 25, pp. 1101–1113. Fleming, T.R., 2008. Current Issues in Non-inferiority Trials. Statistics in Medicine, 27, pp. 317-332. Althunian, T.A., de Boer, A., Groenwold, R.H. and Klungel, O.H., 2017. Defining the noninferiority margin and analysing noninferiority: an overview. British journal of clinical pharmacology, 83(8), pp.1636-1642. Dibra, A., et al (2005). Paclitaxel-eluting or sirolimus-eluting stents to prevent restenosis in diabetic patients. New England Journal of Medicine, 353(7), 663-670.
  • 26.
    References I. Pigeot, J.Schäfer, J. Röhmel, D. Hauschke., 2003. Assessing non-inferiority of a new treatment in a three-arm clinical trial including a placebo. Statistics in Medicine, 22, pp. 883-899. M. Kieser, T. Friede., 2007. Planning and analysis of three‐arm non‐inferiority trials with binary endpoints. Statistics in Medicine, 26, pp. 253-273. M. Hasler, R. Vonk, L.A. Hothorn., 2008. Assessing non-inferiority of a new treatment in a three-arm trial in the presence of heteroscedasticity. Statistics in Medicine, 27, pp. 490-503. M. Mielke, A. Munk, and A. Schacht., 2008. The assessment of non‐inferiority in a gold standard design with censored, exponentially distributed endpoints. Statistics in Medicine, 27, pp. 5093-5110. M. Mielke and A. Munk., 2009. The assessment and planning of non-inferiority trials for retention of effect hypotheses-towards a general approach. arXiv:0912.4169 Mielke, M., 2010. Maximum Likelihood Theory for Retention of Effect Non-Inferiority Trials (Doctoral dissertation, Niedersächsische Staats-und Universitätsbibliothek Göttingen). T. Mütze, A. Munk, T. Friede., 2016. Design and analysis of three‐arm trials with negative binomially distributed endpoints. Statistics in Medicine, 35, pp. 505-521.
  • 27.
    References T. Mütze, F.Konietschke, A. Munk, T. Friede., 2017, A studentized permutation test for three-arm trials in the `gold standard’ design. Statistics in Medicine, 36, pp. 883-898. Binkley, N., Bolognese, M., Sidorowicz‐Bialynicka, A., Vally, T., Trout, R., Miller, C., Buben, C.E., Gilligan, J.P., Krause, D.S. and Oral Calcitonin in Postmenopausal Osteoporosis (ORACAL) Investigators, 2012. A phase 3 trial of the efficacy and safety of oral recombinant calcitonin: the Oral Calcitonin in Postmenopausal Osteoporosis (ORACAL) trial. Journal of bone and mineral research, 27(8), pp.1821-1829. Food and Drug Administration Statistical approaches to establishing bioequivalence. Guidance for industry. 2001. https://www.fda.gov/media/70958/download European Medicines Agency, CHMP. Guideline on the Investigation of Bioequivalence. London; 2010 Jan 20.www.ema.europa.eu/docs/en_GB/document_library/Scientific_guideline/2010/01/WC500070039.pdf Food and Drug Administration Draft Guidance on Progesterone. 2001. https://www.accessdata.fda.gov/drugsatfda_docs/psg/Progesterone_caps_19781_RC02-11.pdf Schuirmann DJ. A Comparison of the Two One-Sided Tests Procedure and the Power Approach for Assessing the Equivalence of Average Bioavailability. J Pharmacokinet Biopharm. 1987; 15(6): 657–80. Senn, S. (2001). Statistical issues in bioequivalence. Statistics in Medicine, 20, 2785-2799.
  • 28.
    References Kirkwood TBL. Bioequivalencetesting—a need to rethink. Biometrics 1981; 37:589–591. Berger R, Hsu J. Bioequivalence trials, intersection-union tests, and equivalence confidence sets. Statistical Science 1996; 11:283–319 O’Quigley, J. and C. Baudoin, General approaches to the problem of bioequivalence. The Statistician, 1988. 37: p. 51-58. Westlake WJ. Symmetrical confidence intervals for bioequivalence trials. Biometrics 1976; 32:741–744 Lindley DV. Decision analysis and bioequivalence trials. Statistical Science 1998; 13:136 –141. Schütz, H., Reference-scaled Average Bioequivalence. Bebac https://bebac.at/lectures/Moscow2016- 3.pdf Tóthfalusi L et al. Evaluation of the Bioequivalence of Highly-Variable Drugs and Drug Products. Pharm Res. 2001;18(6): 728–33. Radicioni, M., Castiglioni, C., Giori, A., Cupone, I., Frangione, V. and Rovati, S., 2017. Bioequivalence study of a new sildenafil 100 mg orodispersible film compared to the conventional film-coated 100 mg tablet administered to healthy male volunteers. Drug Design, Development and Therapy, 11, p.1183.

Editor's Notes

  • #2 www.Statsols.com/trial