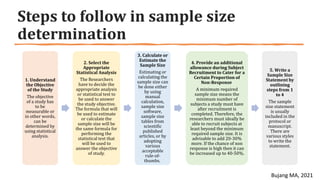
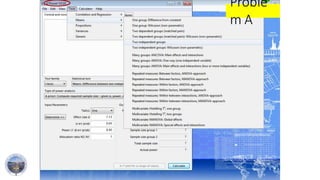
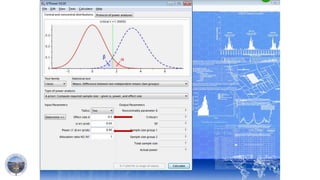
This document discusses factors to consider when determining sample size for research, including effect size, population standard deviation, power, and significance level. It provides examples of how to estimate these factors from literature, historical data, or expert opinion. Free online sample size calculators and software tools are listed. Steps for determining sample size include understanding the study objective, selecting the appropriate statistical analysis, calculating the sample size, and allowing for non-response. Sample size statements should outline these steps.
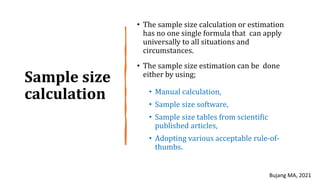


![2. The population standard deviation
• The standard deviation is used
with continuous data, but not categorical data.
• The population standard deviation is a parameter.
• It is a fixed value calculated from every individual in
the population.
• The standard deviation, is appropriate when the
continuous data is not significantly skewed or has
outliers.
• It can be derived from literature review, pilot
study or from any reliable source.
Laerd Statistics [cited 2022 Sep 9]](https://image.slidesharecdn.com/sample-size-comprehensive-231028211226-c400ac63/85/Sample-size-comprehensive-pptx-8-320.jpg)
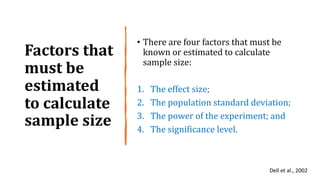
![• Type I error Alpha (α): rejecting the
null hypothesis of no effect when it is
actually true. False positive
• Type II error Beta (β): not rejecting
the null hypothesis of no effect when
it is actually false. False negative
3. The power cont’d
StatisticsHowTo.com [cited 2022 Sep 5]](https://image.slidesharecdn.com/sample-size-comprehensive-231028211226-c400ac63/85/Sample-size-comprehensive-pptx-10-320.jpg)


![References for more reading
1. Bhandari P. What is Effect Size and Why Does It Matter? (Examples) [Internet]. Scribbr. 2020 [cited 2022
Sep 9]. Available from: https://www.scribbr.com/statistics/effect-size/
2. Bujang MA. A Step-by-Step Process on Sample Size Determination for Medical Research. Malays J Med Sci
MJMS. 2021 Apr;28(2):15–27.
3. Dell RB, Holleran S, Ramakrishnan R. Sample Size Determination. Ilar J. 2002;43(4):207–13.
4. Greenland S, Senn SJ, Rothman KJ, Carlin JB, Poole C, Goodman SN, et al. Statistical tests, P values,
confidence intervals, and power: a guide to misinterpretations. Eur J Epidemiol. 2016;31:337–50.
5. Sullivan L. Power and Sample Size Determination [Internet]. [cited 2022 Sep 9]. Available from:
https://sphweb.bumc.bu.edu/otlt/mph-modules/bs/bs704_power/bs704_power_print.html
6. Standard Deviation | How and when to use the Sample and Population Standard Deviation - A measure of
spread | Laerd Statistics [Internet]. [cited 2022 Sep 9]. Available from:
https://statistics.laerd.com/statistical-guides/measures-of-spread-standard-deviation.php
7. Statistical Power: What it is, How to Calculate it [Internet]. Statistics How To. [cited 2022 Sep 5]. Available
from: https://www.statisticshowto.com/probability-and-statistics/statistics-definitions/statistical-power/](https://image.slidesharecdn.com/sample-size-comprehensive-231028211226-c400ac63/85/Sample-size-comprehensive-pptx-46-320.jpg)
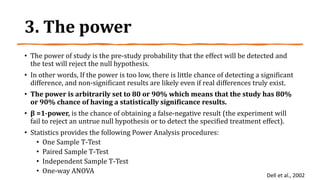
![Useful websites for sample size calculation
• ClinCalc LLC. Sample Size Calculator [website]. C2002. Available at: https://clincalc.com/stats/SampleSize.aspx
• Dean AG, Sullivan KM, Soe MM. OpenEpi: Open Source Epidemiologic Statistics for Public Health, Version.
www.OpenEpi.com, updated 2013/04/06. Available at: https://www.openepi.com
• GIGAcalculator. Power & Sample Size Calculator [website]. c2017-2022. Available at:
https://www.gigacalculator.com/calculators/power-sample-size-calculator.php
• Kohn MA, Senyak J. Sample Size Calculators [website]. UCSF CTSI. 20 December 2021. Available at
https://www.sample-size.net/
• PS: Power and Sample Size Calculation [website]. Vanderbilt Biostatistics Wiki, c2013-2022. Available from:
https://biostat.app.vumc.org/wiki/Main/PowerSampleSize.
• StatCalc in Epi Info™, Division of Health Informatics & Surveillance (DHIS), Center for Surveillance, Epidemiology &
Laboratory Services (CSELS) [website]. CDC. Available at: https://www.cdc.gov/epiinfo/user-
guide/statcalc/samplesize.html
• <http://www.biomath.info>: a simple website of the biomathematics division of the Department of Pediatrics at the
College of Physicians & Surgeons at Columbia University, which implements the equations and conditions discussed
in this article
• <http://davidmlane.com/hyperstat/power.html>: a clear and concise review of the basic principles of statistics,
which includes a discussion of sample size calculations with links to sites where actual calculations can be
performed
• nQuery Advisor, SPSS, MINITAB and SAS/STAT are paid statistical programs and software that can be used both for
sample size calculations and statistical data analysis](https://image.slidesharecdn.com/sample-size-comprehensive-231028211226-c400ac63/85/Sample-size-comprehensive-pptx-47-320.jpg)