Poster Presentation of the 3rd IEEE Int. Conf. on ICIEV’14
•
1 like•640 views

The vehicular safety message feature is applied to avoid accident or collision avoidance on each vehicle. Analyzed the impact of IDM-IM and IDM-LC on AODV, AOMDV, DSDV and OLSR routing protocols in an urban scenario of Dhaka city. Recommend several concerns (drop rate, delay, jitter, route cost) before developing a realistic vehicular safety applications.
Recommended

Recommended
More Related Content
What's hot
What's hot (10)
Similar to Poster Presentation of the 3rd IEEE Int. Conf. on ICIEV’14
Similar to Poster Presentation of the 3rd IEEE Int. Conf. on ICIEV’14 (20)
More from Habibur Rahman
More from Habibur Rahman (11)
Recently uploaded
Recently uploaded (20)
Poster Presentation of the 3rd IEEE Int. Conf. on ICIEV’14
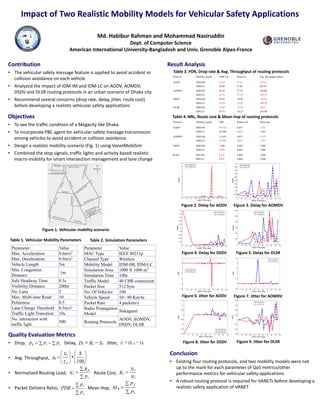
- 1. Impact of Two Realistic Mobility Models for Vehicular Safety Applications Md. Habibur Rahman and Mohammad Nasiruddin Dept. of Computer Science American International University-Bangladesh and Univ. Grenoble Alpes-France Contribution • The vehicular safety message feature is applied to avoid accident or collision avoidance on each vehicle • Analyzed the impact of IDM-IM and IDM-LC on AODV, AOMDV, DSDV and OLSR routing protocols in an urban scenario of Dhaka city • Recommend several concerns (drop rate, delay, jitter, route cost) before developing a realistic vehicular safety applications Objectives • To see the traffic condition of a Megacity like Dhaka • To incorporate PBC agent for vehicular safety message transmission among vehicles to avoid accident or collision avoidance • Design a realistic mobility scenario (Fig. 1) using VanetMobiSim • Combined the stop signals, traffic lights and activity based realistic macro-mobility for smart intersection management and lane change Figure 1. Vehicular mobility scenario Conclusion • Existing four routing protocols, and two mobility models were not up to the mark for each parameter of QoS metrics/other performance metrics for vehicular safety applications • A robust routing protocol is required for VANETs before developing a realistic safety application of VANET Result Analysis Protocol Mobility model PDR (%) Drop (%) Avg. throughput (kbps) AODV IDM-IM 42.53 57.47 229.14 IDM-LC 42.06 57.94 225.53 AOMDV IDM-IM 11.076 0.015 1.171 IDM-LC 10.595 0.014 1.165 DSDV IDM-IM 1.048 0.003 1.000 IDM-LC 0.993 0.003 1.000 Protocol Mobility model NRL Route cost Mean hop AODV IDM-IM 49.745 0.057 1.793 IDM-LC 50.508 0.056 1.843 AOMDV IDM-IM 42.30 57.70 228.09 IDM-LC 42.78 57.22 229.75 DSDV IDM-IM 29.91 70.09 159.83 IDM-LC 32.58 67.42 147.72 OLSR IDM-IM 47.08 52.92 252.57 IDM-LC 45.77 54.23 245.00 OLSR IDM-IM 2.234 0.006 1.000 IDM-LC 2.273 0.006 1.000 Quality Evaluation Metrics • Drop, Delay, Jitter, • Avg. Throughput, • Normalized Routing Load, Route Cost, • Packet Delivery Ratio, Mean Hop, Pd Pr Ps Di Rt St Ji Di1 Di 100 8 T N A n t h P P M s f h P P s r PDR N N R t r c P R N r p l Figure 2. Delay for AODV Figure 3. Delay for AOMDV Figure 4. Delay for DSDV Figure 5. Delay for OLSR Figure 6. Jitter for AODV Figure 7. Jitter for AOMDV Figure 8. Jitter for DSDV Figure 9. Jitter for OLSR Table 3. PDR, Drop rate & Avg. Throughput of routing protocols Table 4. NRL, Route cost & Mean hop of routing protocols Parameter Value MAC Type IEEE 80211p Channel Type Wireless Mobility Model IDM-IM, IDM-LC Simulation Area 1000 X 1000 m2 Simulation Time 100s Traffic Model 40 CBR connection Packet Size 512 byte No. Of Vehicles 100 Vehicle Speed 10 - 80 Km/hr Packet Rate 4 packets/s Radio Propagation Model Nakagami Routing Protocols AODV, AOMDV, DSDV, OLSR Table 1. Vehicular Mobility Parameters Table 2. Simulation Parameters Parameter Value Max. Acceleration 0.6m/s2 Max. Deceleration 0.9m/s2 Vehicle Length 5m Min. Congestion Distance 1m Safe Headway Time 0.5s Visibility Distance 200m No. Lane 2 Max. Multi-lane Road 10 Politeness 0.5 Lane Change Threshold 0.5m/s2 Traffic Light Transition 10s No. interaction with traffic light 500