Download to read offline
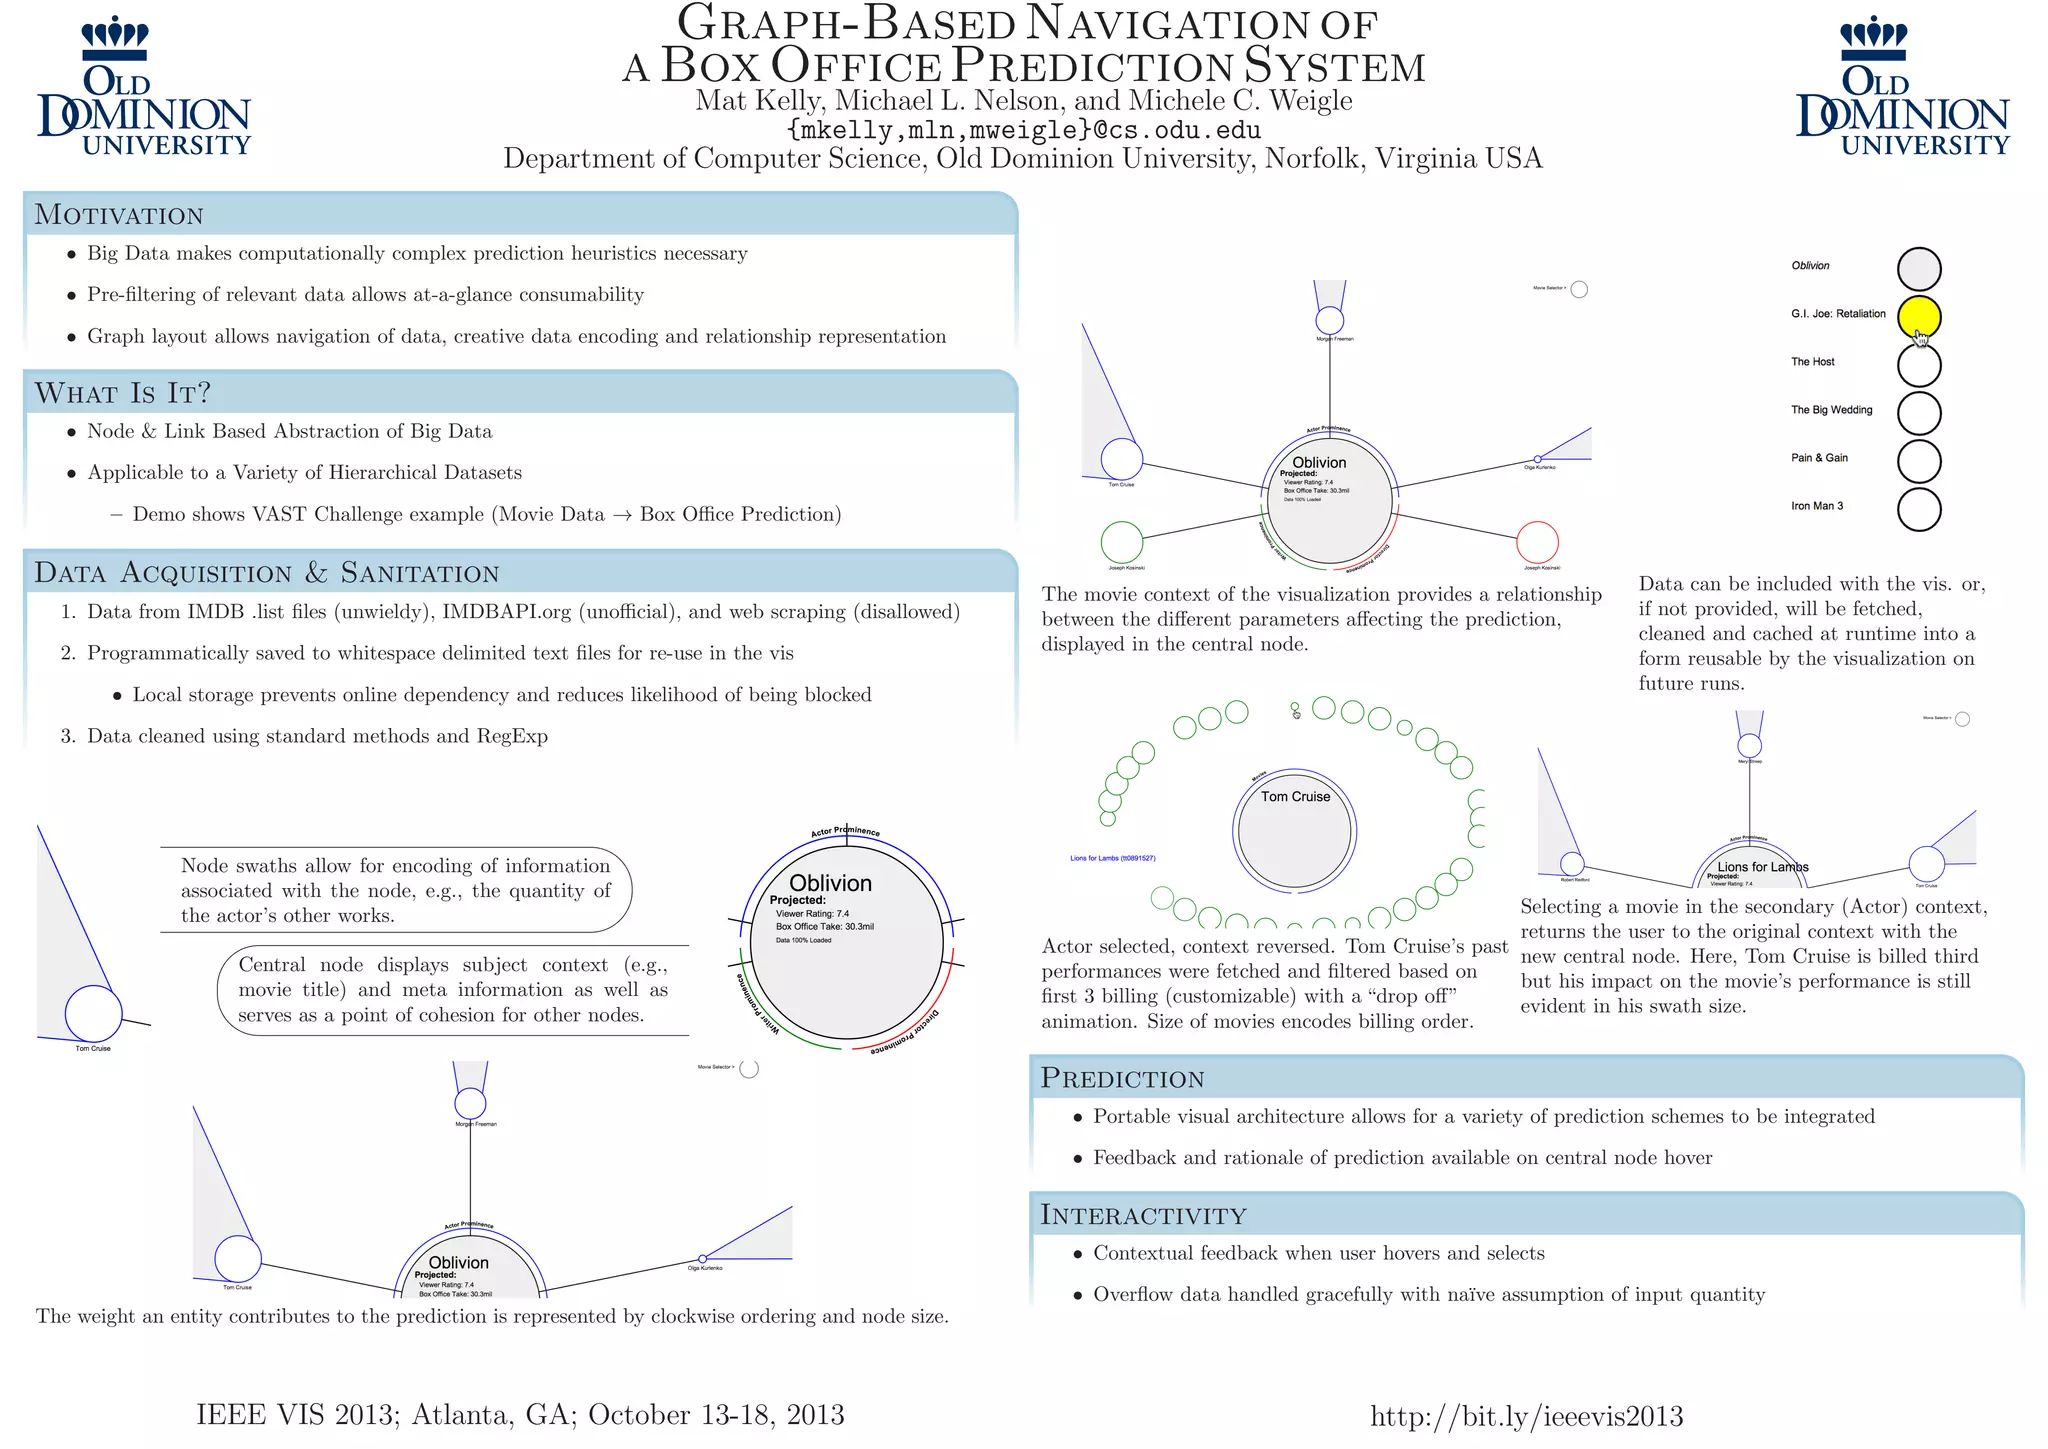

This document describes a graph-based visualization system for navigating and predicting box office performance. The system represents movie data as interconnected nodes in a graph layout. Selecting different nodes allows navigation between the movie context and related contexts like actors. Node size and position encode attributes relevant to box office predictions. The system preprocesses and caches external data to make complex predictions accessible through an interactive visual interface.