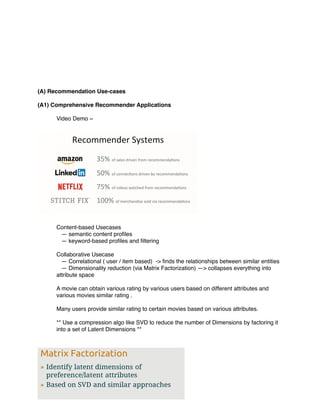
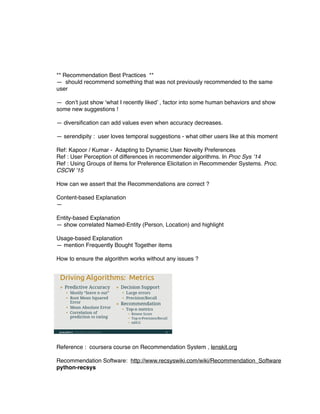
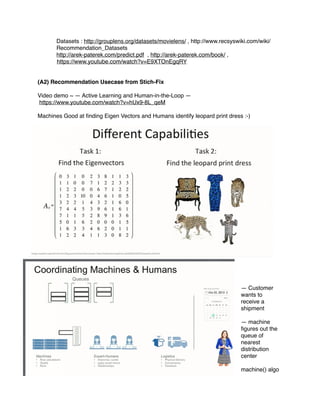
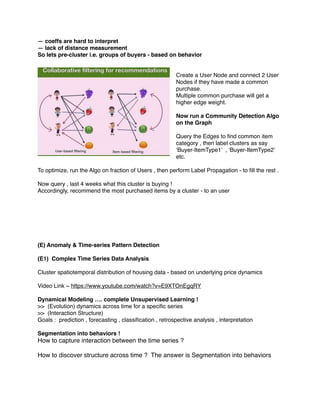
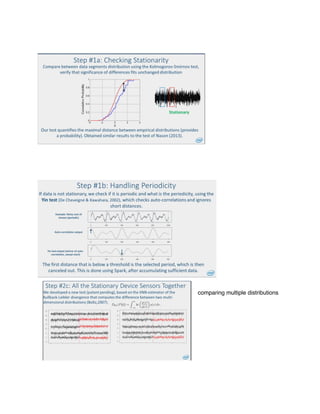
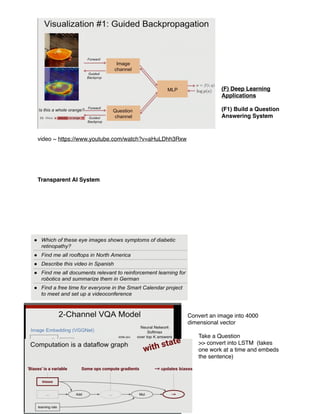
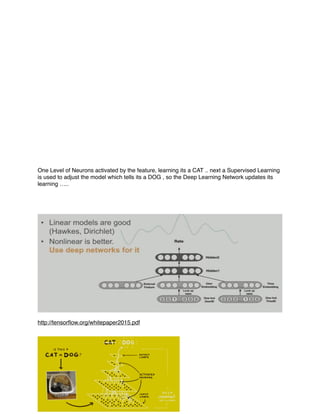
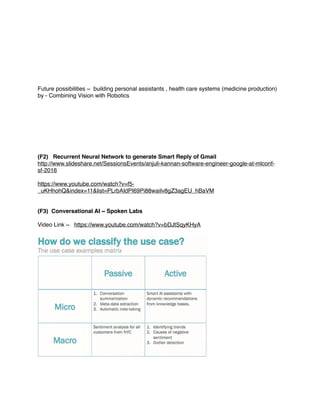
This document summarizes several practical machine learning applications and use cases that were presented at various conferences through video links and slides. It discusses advanced recommender applications, product ranking, natural language understanding, digital marketing, personalized content blending, anomaly and pattern detection in time-series data, and deep learning applications. Specific use cases covered include recommendations at Amazon, StitchFix, Netflix, natural language processing of product reviews, medical data analysis, digital advertising optimization at AOL, personalized recommendations at Pinterest, anomaly detection at Intel, and question answering, image recognition and dialogue systems using deep learning.
Containers are a developer's new best friend. For all the non-developers, what does this mean? This session will demystify this abstraction called containers, and dive deep on how it changes the way we provision, deliver, deploy and manage applications.
Speaker: Shiva Narayanaswamy, Solutions Architect, Amazon Web Services
Containers - Transforming the data centre as we know it 2016Keith Lynch
These innovative technologies are at the heart of the microservices and DevOps revolution currently sweeping through the IT industry. They are fuelling digital transformation and accelerating cloud adoption. They're helping organisations develop infrastructure agnostic applications that can be deployed anywhere i.e. Bare Metal, Virtualised Data Centres, Private and Public Cloud. They’re helping organisations to significantly reduce infrastructure costs and accelerating agile application delivery by automating application deployments and operational management. After this talk you’ll know what these open source technologies and open standards are, what they mean to you and your organisation and where you can go to try them out.
Soumith Chintala, Artificial Intelligence Research Engineer, Facebook at MLco...MLconf
Predicting the Future Using Deep Adversarial Networks: Learning With No Labeled Data: Labeling data to solve a certain task can be expensive, slow and does not scale. If unsupervised learning works, then one can have very little labelled data to help a machine solve a particular task. Most traditional unsupervised learning methods such as PCA and K-means clustering do not work well for complicated data distributions, making them useless for a lot of tasks. In this talk, I’ll go over recent advances in a technique for unsupervised learning called Generative Adversarial networks, which can learn to generate very complicated data distributions such as images and videos. These trained adversarial networks are then used to solve new tasks with very little labeled data, making them an attractive class of algorithms for many domains where there is limited labeled data but unlimited unlabeled data.
The presentation is all about computer forensics. the process , the tools and its features and some example scenarios.. It will give you a great insight into the computer forensics
What is NFV? How does it relate to SDN, what does it mean for the telecommunications industry, and why should anyone outside of that industry care?
Presentation delivered at CloudOpen Europe, Düsseldorf, October 2014
Just how closely should financial executives be paying attention? Is the disruption of blockchain technology a distant rumble or an imminent strike? Fintech is shaking the foundation of the traditional financial services industry and blockchain alone could be a game-changer, transforming transactions, custody, accounting, currency exchange, and more.
Navigating the associated business implications and expected timeline is no easy task for financial professionals. This webinar can help firms sift through the noise and will identify the most significant blockchain trends and tangible applications.
Sponsored by ALFI
Intro to Data Science for Enterprise Big DataPaco Nathan
If you need a different format (PDF, PPT) instead of Keynote, please email me: pnathan AT concurrentinc DOT com
An overview of Data Science for Enterprise Big Data. In other words, how to combine structured and unstructured data, leveraging the tools of automation and mathematics, for highly scalable businesses. We discuss management strategy for building Data Science teams, basic requirements of the "science" in Data Science, and typical data access patterns for working with Big Data. We review some great algorithms, tools, and truisms for building a Data Science practice, and provide plus some great references to read for further study.
Presented initially at the Enterprise Big Data meetup at Tata Consultancy Services, Santa Clara, 2012-08-20 http://www.meetup.com/Enterprise-Big-Data/events/77635202/
Myths and Mathemagical Superpowers of Data ScientistsDavid Pittman
Some people think data scientists are mythical beings, like unicorns, or they are some sort of nouveau fad that will quickly fade. Not true, says IBM big data evangelist James Kobielus. In this engaging presentation, with artwork created by Angela Tuminello, Kobielus debunks 10 myths about data scientists and their role in analytics and big data. You might also want to read the full blog by Kobielus that spawned this presentation: "Data Scientists: Myths and Mathemagical Superpowers" - http://ibm.co/PqF7Jn
For more information, visit http://www.ibmbigdatahub.com
A graph is a data structure composed of vertices/dots and edges/lines. A graph database is a software system used to persist and process graphs. The common conception in today's database community is that there is a tradeoff between the scale of data and the complexity/interlinking of data. To challenge this understanding, Aurelius has developed Titan under the liberal Apache 2 license. Titan supports both the size of modern data and the modeling power of graphs to usher in the era of Big Graph Data. Novel techniques in edge compression, data layout, and vertex-centric indices that exploit significant orders are used to facilitate the representation and processing of a single atomic graph structure across a multi-machine cluster. To ensure ease of adoption by the graph community, Titan natively implements the TinkerPop 2 Blueprints API. This presentation will review the graph landscape, Titan's techniques for scale by distribution, and a collection of satellite graph technologies to be released by Aurelius in the coming summer months of 2012.
Soumith Chintala at AI Frontiers: A Dynamic View of the Deep Learning WorldAI Frontiers
In this short talk, you will get an overview of Torch – a deep learning framework, and you will learn about how Torch offers certain valuable features for research that no other framework focuses on. You will also learn about new features introduced in a refreshed version of Torch.
How To Interview a Data Scientist
Daniel Tunkelang
Presented at the O'Reilly Strata 2013 Conference
Video: https://www.youtube.com/watch?v=gUTuESHKbXI
Interviewing data scientists is hard. The tech press sporadically publishes “best” interview questions that are cringe-worthy.
At LinkedIn, we put a heavy emphasis on the ability to think through the problems we work on. For example, if someone claims expertise in machine learning, we ask them to apply it to one of our recommendation problems. And, when we test coding and algorithmic problem solving, we do it with real problems that we’ve faced in the course of our day jobs. In general, we try as hard as possible to make the interview process representative of actual work.
In this session, I’ll offer general principles and concrete examples of how to interview data scientists. I’ll also touch on the challenges of sourcing and closing top candidates.
Titan is an open source distributed graph database build on top of Cassandra that can power real-time applications with thousands of concurrent users over graphs with billions of edges. Graphs are a versatile data model for capturing and analyzing rich relational structures. Graphs are an increasingly popular way to represent data in a wide range of domains such as social networking, recommendation engines, advertisement optimization, knowledge representation, health care, education, and security.
This presentation discusses Titan's data model, query language, and novel techniques in edge compression, data layout, and vertex-centric indices which facilitate the representation and processing of Big Graph Data across a Cassandra cluster. We demonstrate Titan's performance on a large scale benchmark evaluation using Twitter data.
Presented at the Cassandra 2012 Summit.
Presentation given by Dr. Diego Kuonen, CStat PStat CSci, on November 20, 2013, at the "IBM Developer Days 2013" in Zurich, Switzerland.
ABSTRACT
There is no question that big data has hit the business, government and scientific sectors. The demand for skills in data science is unprecedented in sectors where value, competitiveness and efficiency are driven by data. However, there is plenty of misleading hype around the terms big data and data science. This presentation gives a professional statistician's view on these terms and illustrates the connection between data science and statistics.
The presentation is also available at http://www.statoo.com/BigDataDataScience/.
We at Revolution Analytics are often asked “What is the best way to learn R?” While acknowledging that there may be as many effective learning styles as there are people we have identified three factors that greatly facilitate learning R. For a quick start:
- Find a way of orienting yourself in the open source R world
- Have a definite application area in mind
- Set an initial goal of doing something useful and then build on it
In this webinar, we focus on data mining as the application area and show how anyone with just a basic knowledge of elementary data mining techniques can become immediately productive in R. We will:
- Provide an orientation to R’s data mining resources
- Show how to use the "point and click" open source data mining GUI, rattle, to perform the basic data mining functions of exploring and visualizing data, building classification models on training data sets, and using these models to classify new data.
- Show the simple R commands to accomplish these same tasks without the GUI
- Demonstrate how to build on these fundamental skills to gain further competence in R
- Move away from using small test data sets and show with the same level of skill one could analyze some fairly large data sets with RevoScaleR
Data scientists and analysts using other statistical software as well as students who are new to data mining should come away with a plan for getting started with R.
Introduction to Network Function Virtualization (NFV)rjain51
Class lecture by Prof. Raj Jain on Introduction to Network Function Virtualization (NFV). The talk covers Four Innovations of NFV, Network Function Virtualization, NFV, Why We need NFV?, NFV and SDN Relationship, Mobile Network Functions, ETSI NFV ISG, NFV Specifications, NFV Architecture, NFV Concepts, Network Forwarding Graph, NFV Reference Points, NFV Framework Requirements, NFV Use Cases, NFV Proof of Concepts, PoCs, ETSI ISG Timeline, Introduction to, Four Innovations of NFV, Network Function Virtualization, NFV, Why We need NFV?, NFV and SDN Relationship, Mobile Network Functions, ETSI NFV ISG, NFV Specifications, NFV Architecture, NFV Concepts, Network Forwarding Graph, NFV Reference Points, NFV Framework Requirements, NFV Use Cases, NFV Proof of Concepts, PoCs, ETSI ISG Timeline. Video recording available in YouTube.
Video Ecosystem and some ideas about video big dataTrieu Nguyen
Introduction to Video Ecosystem Mind Map
Video Streaming Platform
Video Ad Tech Platform
Video Player Platform
Video Content Distribution Platform
Video Analytics Platform
Summary of key ideas
Q & A
Presented by Sachin sharma.
Crowdsourcing systems enlist a multitude of humans to help solve a wide variety of problems. Over the past decade, numerous such systems have appeared on the World-Wide Web. Prime examples include Wikipedia, Linux, Yahoo! Answers, Mechanical Turk-based systems, and much effort is being directed toward developing many more.
Visualizing Model Selection with Scikit-Yellowbrick: An Introduction to Devel...Benjamin Bengfort
This is an overview of the goals and roadmap for the Yellowbrick model visualization library (www.scikit-yb.org). If you're interested in contributing to Yellowbrick or writing visualizers, this is a good place to get started.
In the presentation we discuss the expected workflow of data scientists interacting with the model selection triple and Scikit-Learn. We describe the Yellowbrick API and it's relationship to the Scikit-Learn API. We introduce our primary object: the Visualizer, an estimator that learns from data and displays it visually. Finally we describe the requirements for developing for Yellowbrick, the tools and utilities in place and how to get started.
Yellowbrick is a suite of visual diagnostic tools called "Visualizers" that extend the Scikit-Learn API to allow human steering of the model selection process. In a nutshell, Yellowbrick combines Scikit-Learn with Matplotlib in the best tradition of the Scikit-Learn documentation, but to produce visualizations for your models!
This presentation was given during the opening session of the 2017 Spring DDL Research Labs.
In this talk we will share the idea of developing self guiding application that would provide the most engaging user experience possible using crowd sourced knowledge on a mobile interface. We will discuss and share how historical usage data could be mined using machine learning to identify application usage patterns to generate probable next actions. #h2ony
- Powered by the open source machine learning software H2O.ai. Contributors welcome at: https://github.com/h2oai
- To view videos on H2O open source machine learning software, go to: https://www.youtube.com/user/0xdata
Presentation from DDD Sydney, May 28th, 2016
Buzz word! More buzz words! And another buzz word!! Now that that's out of the way, if you're thinking of heading down the microservices path, then how do you do it? How do you build the services? What do you need to think about if you're starting from scratch? What if you're converting a legacy app? How do we deal with versioning? Do we have to use a NoSQL solution, just because Netflix does? Do we need to use docker/containers? What about the code? Show me the code! Well, that's what this session is all about. Designing and building microservices in .NET and then handling a bunch of other concerns that a microservices approach will force you to think about. Sounds interesting, doesn't it? You betcha.
Building Innovative Products with AgileSean Ammirati
Workshop for Carnegie Mellon's Center for Innovation & Entrepreneurship on taking an agile approach to building innovative products.
Covers: minimally viable [awesome] products
examples of MVPs
Scrum
Given at DevNation 2014, this presentation provides a high level overview for developers about why user experience practices should be a part of every project they undertake.
Through a focus on user-centric design practices, usability testing, and visual design - developers can provide a first-class application that meets and exceeds their user's needs the first time, rather than undergoing serious re-writes of applications due to misunderstandings between project stakeholders and users.
Practical Explainable AI: How to build trustworthy, transparent and unbiased ...Raheel Ahmad
This presentation is from the Federated & Distributed Machine Learning Conference. This talk focuses on why we need explainable AI and how can we build models that are trustworthy, transparency and unbiased.
A CMS has many users: authors, SEO experts, ecommerce, marketing, site managers, etc. Each has different roles and goals for accessing the website. How do we improve the user experience for each of those to help them do their jobs and accomplish their goals? See and learn how we can do better than do-it-yourself tools and using a CMS out-of-the-box.
The issues are presented as challenges to any CMS and web project, and the implemented solutions are demonstrated in Joomla.
Drones generate vast amounts of data, which is usually in the form of images or video streams. Identification of objects of interest, counting them, or detecting change over time, are some of the tasks that are monotonous and labor intensive.
FlytBase AI platform offers a complete solution to automate such tasks. It has been designed and optimised specifically for drone applications.
Movie Recommender System Using Artificial Intelligence Shrutika Oswal
In recent years, a huge amount of information is available on the internet and it is very difficult for the user to collect the relevant information. While purchasing any product also a lot of choices available and the user is confused about what to choose. This will be a time-consuming process as well. The search engine will solve this problem to some extent by but it will fail in giving a personalized recommendation. In this presentation, I will describe the different types and working of the recommender system how they gather the data, build recommender, generate recommendations from it, evaluate the performance and effectiveness of the recommender system. The further part of the presentation will describe how to build a movie recommender system using python.
Similar to Machine learning advanced applications (20)
MS CS - Selecting Machine Learning AlgorithmKaniska Mandal
ML Algorithms usually solve an optimization problem such that we need to find parameters for a given model that minimizes
— Loss function (prediction error)
— Model simplicity (regularization)
Levelwise PageRank with Loop-Based Dead End Handling Strategy : SHORT REPORT ...Subhajit Sahu
Abstract — Levelwise PageRank is an alternative method of PageRank computation which decomposes the input graph into a directed acyclic block-graph of strongly connected components, and processes them in topological order, one level at a time. This enables calculation for ranks in a distributed fashion without per-iteration communication, unlike the standard method where all vertices are processed in each iteration. It however comes with a precondition of the absence of dead ends in the input graph. Here, the native non-distributed performance of Levelwise PageRank was compared against Monolithic PageRank on a CPU as well as a GPU. To ensure a fair comparison, Monolithic PageRank was also performed on a graph where vertices were split by components. Results indicate that Levelwise PageRank is about as fast as Monolithic PageRank on the CPU, but quite a bit slower on the GPU. Slowdown on the GPU is likely caused by a large submission of small workloads, and expected to be non-issue when the computation is performed on massive graphs.
Adjusting primitives for graph : SHORT REPORT / NOTESSubhajit Sahu
Graph algorithms, like PageRank Compressed Sparse Row (CSR) is an adjacency-list based graph representation that is
Multiply with different modes (map)
1. Performance of sequential execution based vs OpenMP based vector multiply.
2. Comparing various launch configs for CUDA based vector multiply.
Sum with different storage types (reduce)
1. Performance of vector element sum using float vs bfloat16 as the storage type.
Sum with different modes (reduce)
1. Performance of sequential execution based vs OpenMP based vector element sum.
2. Performance of memcpy vs in-place based CUDA based vector element sum.
3. Comparing various launch configs for CUDA based vector element sum (memcpy).
4. Comparing various launch configs for CUDA based vector element sum (in-place).
Sum with in-place strategies of CUDA mode (reduce)
1. Comparing various launch configs for CUDA based vector element sum (in-place).
As Europe's leading economic powerhouse and the fourth-largest hashtag#economy globally, Germany stands at the forefront of innovation and industrial might. Renowned for its precision engineering and high-tech sectors, Germany's economic structure is heavily supported by a robust service industry, accounting for approximately 68% of its GDP. This economic clout and strategic geopolitical stance position Germany as a focal point in the global cyber threat landscape.
In the face of escalating global tensions, particularly those emanating from geopolitical disputes with nations like hashtag#Russia and hashtag#China, hashtag#Germany has witnessed a significant uptick in targeted cyber operations. Our analysis indicates a marked increase in hashtag#cyberattack sophistication aimed at critical infrastructure and key industrial sectors. These attacks range from ransomware campaigns to hashtag#AdvancedPersistentThreats (hashtag#APTs), threatening national security and business integrity.
🔑 Key findings include:
🔍 Increased frequency and complexity of cyber threats.
🔍 Escalation of state-sponsored and criminally motivated cyber operations.
🔍 Active dark web exchanges of malicious tools and tactics.
Our comprehensive report delves into these challenges, using a blend of open-source and proprietary data collection techniques. By monitoring activity on critical networks and analyzing attack patterns, our team provides a detailed overview of the threats facing German entities.
This report aims to equip stakeholders across public and private sectors with the knowledge to enhance their defensive strategies, reduce exposure to cyber risks, and reinforce Germany's resilience against cyber threats.
Show drafts
volume_up
Empowering the Data Analytics Ecosystem: A Laser Focus on Value
The data analytics ecosystem thrives when every component functions at its peak, unlocking the true potential of data. Here's a laser focus on key areas for an empowered ecosystem:
1. Democratize Access, Not Data:
Granular Access Controls: Provide users with self-service tools tailored to their specific needs, preventing data overload and misuse.
Data Catalogs: Implement robust data catalogs for easy discovery and understanding of available data sources.
2. Foster Collaboration with Clear Roles:
Data Mesh Architecture: Break down data silos by creating a distributed data ownership model with clear ownership and responsibilities.
Collaborative Workspaces: Utilize interactive platforms where data scientists, analysts, and domain experts can work seamlessly together.
3. Leverage Advanced Analytics Strategically:
AI-powered Automation: Automate repetitive tasks like data cleaning and feature engineering, freeing up data talent for higher-level analysis.
Right-Tool Selection: Strategically choose the most effective advanced analytics techniques (e.g., AI, ML) based on specific business problems.
4. Prioritize Data Quality with Automation:
Automated Data Validation: Implement automated data quality checks to identify and rectify errors at the source, minimizing downstream issues.
Data Lineage Tracking: Track the flow of data throughout the ecosystem, ensuring transparency and facilitating root cause analysis for errors.
5. Cultivate a Data-Driven Mindset:
Metrics-Driven Performance Management: Align KPIs and performance metrics with data-driven insights to ensure actionable decision making.
Data Storytelling Workshops: Equip stakeholders with the skills to translate complex data findings into compelling narratives that drive action.
Benefits of a Precise Ecosystem:
Sharpened Focus: Precise access and clear roles ensure everyone works with the most relevant data, maximizing efficiency.
Actionable Insights: Strategic analytics and automated quality checks lead to more reliable and actionable data insights.
Continuous Improvement: Data-driven performance management fosters a culture of learning and continuous improvement.
Sustainable Growth: Empowered by data, organizations can make informed decisions to drive sustainable growth and innovation.
By focusing on these precise actions, organizations can create an empowered data analytics ecosystem that delivers real value by driving data-driven decisions and maximizing the return on their data investment.
Explore our comprehensive data analysis project presentation on predicting product ad campaign performance. Learn how data-driven insights can optimize your marketing strategies and enhance campaign effectiveness. Perfect for professionals and students looking to understand the power of data analysis in advertising. for more details visit: https://bostoninstituteofanalytics.org/data-science-and-artificial-intelligence/
1. Advanced Machine Learning Practical Applications and Use cases
Conference Notes on some interesting practical applications.
Implementation approaches are explained in related videos and slides.
Video Links
~ Data Science Summit 2016
~ ML Conf 2016 ( slides - http://www.slideshare.net/SessionsEvents/presentations )
— Advanced Recommender Applications
~ Deep Personalization Techniques by Amazon - https://www.youtube.com/watch?
v=MMu0nDA-nog , https://www.youtube.com/watch?
v=ofaPq5aRKZ0&index=10&list=PLrbAIdPI69Pi88waiIv8gZ3agEU_hBaVM
~ (Advanced Recommender for Marketing) https://www.youtube.com/watch?
v=2DHNwpu_jKg
~ (Graph Reco Algo by Teachers-payTeachers) https://www.youtube.com/watch?
v=oFXVbvVqHpY
~ (Stitch-Fix Synthesize human-machine capabilities)
https://www.youtube.com/watch?v=flLCO6An6xI
~ (Community Detection) https://www.youtube.com/watch?v=uS6ifgdp86w
~ (Explain the Recommendations) https://www.youtube.com/watch?v=ABweFa7Y6aA
— Product Ranking
~ Amazon Search — https://www.youtube.com/watch?v=NLrhmn-
EZ88&list=PLrbAIdPI69Pi88waiIv8gZ3agEU_hBaVM&index=6
— Natural Language Understanding
~ (NLP & ElasticSearch) https://www.youtube.com/watch?v=L0zQh-ii3sI
~ (Walmart Labs Product Review) https://www.youtube.com/watch?
v=GYhb6sb4YYk&index=17&list=PLrbAIdPI69Pi88waiIv8gZ3agEU_hBaVM ~
~ (Medical Data Analysis) https://www.youtube.com/watch?v=QwN1U6nlA5E
— Digital Marketing
~ (AOL - AdLearn Platform) https://www.youtube.com/watch?v=vJh6Nd7tCok
— Personalized Content Blending
- Pinterest Usecase
- https://www.youtube.com/watch?v=mN6MrzL1i78 ,
- https://www.youtube.com/watch?
v=QcW1tOHybak&list=PLrbAIdPI69Pi88waiIv8gZ3agEU_hBaVM&index=7
— Anomaly and Pattern Detection from multi-dimensional time-series
~ https://www.youtube.com/watch?v=UxJB_5PyKTI
2. ~ (Intel IoT) https://www.youtube.com/watch?v=DD_BbAb9RhM
—
— Deep Learning Apps
~ Image Similarity - https://www.youtube.com/watch?v=DJnLfaG6xZE
~ Question Answering System - https://www.youtube.com/watch?v=aHuLDhh3Rxw
~ https://www.youtube.com/watch?v=GxZUdZMPGpQ
~ Spoken Lab - https://www.youtube.com/watch?v=bDJtSqyKHyA
— Deep Reinforcement Learning
~ Dialog Systems - https://www.youtube.com/watch?
v=s-8WkKhHYqA&list=PLrbAIdPI69Pi88waiIv8gZ3agEU_hBaVM&index=3
(A) Deep Personalization Techniques
Traditional Factorial Models usually involve estimating parameters:
3. Using LSTMs for non-parametric hierarchical
model to share statistical strengths and past
observations ~ as continuous inputs to next
layers.
Instead of estimating parameters , the functions
are estimated.
Why LSTM ? As we have to take relative
temporal decision which should be adjusted
gradually
Build model gradually and calculate survival probability
e.g. find the prob user will survive till time t without using an app
When the user opens up the app ? Is the User really going to like the movie 2 weeks from now ?
Did the taste for the product change over time for an user ?
Is he going to come back tomorrow , next week , never ?
How engaged the user is over time ?
The answer is not a Binary decision
(like switching to different Insurance
company or credit provider) but a
relative temporal decision which
should be adjusted gradually ….
4. So how does the LSTM look like ?
The central Cell models the latent
space of the user.
Xt is the observation
Now we get a global model of how
the world changes :
We also learn the individual state !
Overall , for large number of
temporal data , avoid feature
engineering …..
Lets imagine we have LSTM for
Movie Attribute , LSTM for User
Attribute
Every time user watches movie ,
something changes (either cluster
5. membership) due to user interest …
so consider every movie as a function of time … not just collection of attributes ….
Normal Memory Cells - read , write ,
erase .
LSTM cells can - read 30% , erase
60% … allowing the cells to be
Differentiable … the cells hold on for
a while , erase at later point of time
in a sequence …. add long range
dependency ….
e.g. look back 20 words to find a hint
…
State-based
DataFlow
Computation
>> remember
and propagate
biases so that a
node can
update it at later
stage .
>> nodes
automatically
update the
model and add
operations to
calculate symbolic gradients of variables w.r.t. loss function
6. (A) Recommendation Use-cases
(A1) Comprehensive Recommender Applications
Video Demo ~
Content-based Usecases
— semantic content profiles
— keyword-based profiles and filtering
Collaborative Usecase
— Correlational ( user / item based) -> finds the relationships between similar entities
— Dimensionality reduction (via Matrix Factorization) —> collapses everything into
attribute space
A movie can obtain various rating by various users based on different attributes and
various movies similar rating .
Many users provide similar rating to certain movies based on various attributes.
** Use a compression algo like SVD to reduce the number of Dimensions by factoring it
into a set of Latent Dimensions **
7. ** Recommendation Best Practices **
— should recommend something that was not previously recommended to the same
user
— don’t just show ‘what I recently liked’ , factor into some human behaviors and show
some new suggestions !
— diversification can add values even when accuracy decreases.
— serendipity : user loves temporal suggestions - what other users like at this moment
Ref: Kapoor / Kumar - Adapting to Dynamic User Novelty Preferences
Ref : User Perception of differences in recommender algorithms. In Proc Sys ’14
Ref : Using Groups of Items for Preference Elicitation in Recommender Systems. Proc.
CSCW ’15
How can we assert that the Recommendations are correct ?
Content-based Explanation
—
Entity-based Explanation
— show correlated Named-Entity (Person, Location) and highlight
Usage-based Explanation
— mention Frequently Bought Together items
How to ensure the algorithm works without any issues ?
Reference : coursera course on Recommendation System , lenskit.org
Recommendation Software: http://www.recsyswiki.com/wiki/Recommendation_Software
python-recsys
8. Datasets : http://grouplens.org/datasets/movielens/ , http://www.recsyswiki.com/wiki/
Recommendation_Datasets
http://arek-paterek.com/predict.pdf , http://arek-paterek.com/book/ ,
https://www.youtube.com/watch?v=E9XTOnEgqRY
(A2) Recommendation Usecase from Stich-Fix
Video demo ~ — Active Learning and Human-in-the-Loop —
https://www.youtube.com/watch?v=hUx9-8L_qeM
Machines Good at finding Eigen Vectors and Humans identify leopard print dress :-)
— Customer
wants to
receive a
shipment
— machine
figures out the
queue of
nearest
distribution
center
machine() algo
9. does PCA to explain most variations, Matrix Factorization to find latent attributes (to find
relevancy to other customers) , mix-match model (relationship been Product and
customer attributes) , ANN (for image and text data)
— Final Ranked products sent to Queue , then human() also triggers human activities (curates /
personal touch)
— M-> lda(), H-> curate()
Finally Logistics performs shipment.
(A3) Recommendation at Netflix
https://www.youtube.com/watch?v=coeak1YsaYc
tutorials ~ https://www.youtube.com/watch?v=gCaOa3W9kM0
(B) Content Review Analysis
(B1) Product Review Analysis
~ by Walmart Labs
* Feature Space Computation
— TF/IDF transform on documents (stop words removal, stemming, pos selection, spell-
checking etc.)
* Synonym computation
— use word embedding (glove , word2vec)
— can build synonym graph (using wikipedia / dictionary)
— unsupervised algo
* Sentiment Computation
— use VADER ( valence Aware Dictionary and Sentiment Reasoner
— find the intensity of the sentiment as a prob density function (pdf)
10. (B2) Analyze the Review Content with NLP
Github ~ https://github.com/MachineLearning-Tutorials/nlp_elasticsearch_reviews
1) as always - first do the Exploratory Data Analysis
- Find most important items with good number of review scores
- Show a rolling average of review score trend over time
- Discard very long review / short reviews and that can’t be tokenized well
2) apply NLP - to find tokens in Review
3) then perform Dictionary-based Sentiment analysis per review
4) store all result for index / search / lookups in ES using msgpack format
https://www.youtube.com/watch?v=L0zQh-ii3sI
(B3) Medical Treatment Data Analysis
Find who need to be vaccinated ? Who fits this Clinical Trial ? Who is at risk for sepis ?
Who on this protocol didn’t have this side effect ?
Who is getting Meds they are allergic to ?
(C) Digital Marketing
11. (C1) Video Demo ~ https://www.youtube.com/watch?v=IQXkq0_rruU
(C2) Advertisement Prediction and Optimization - by AOL
Video Link ~
Advertisers want clicks or
conversion predictions
Every time an user visits ABC.com , it opens up an Advertising opportunity for ABC by doing a
real-time bidding on behalf of ABC ! After winning the bids, the ads need to placed !
The platform decides how
much to bid
12. Calculate the Likelihood that user will
click —
Statistical Signal processing - is
used to extract signal from non-
stationery data.
predicted conversion rate (yellow)
catches up with blue line
(observed)
Once ad is won , boost and explore performance of Ad,
then exploit the information gain —
13. Classical Operations Research theory (Multi-Arm bandits Theory) is applied ~ to ~ find the
Values associated to information gained when showing a specific AD is estimated using
techniques similar to option valuation !!!!
(D) Personalized Content Blending - A Complex combination of Usecases
Pinterest Video Link ~ https://www.youtube.com/watch?v=mN6MrzL1i78
Data : Large Bipartitie Graph of 10B+ pins and 800M+ collections of Pinterest
UseCases :
Pin and Board Recommendations
New-user interest Recommendations
User action prediction (drives Ads and monetization)
Email timings, frequency, content (Notifications)
Which pins are related to given pins
Pin Rankings (common topics)
Interesting Problems:
Product Comprehension
- optimize the business metric - WAU28
- (weekly active user after 28 days360 Recommendation
A brand new user comes :
> How to keep him engaged ?
> what topics to recommend ?
> let him select a list of interests
>
Given a pin what interest it belong to ?
How to translate text images into different languages ?
How to add captions to images ?
How to identify a cluster of buyers and send a product recommendations email to the cluster ?
conventional collaborative filtering will not solve the problem ….
— not optimized to find clusters
14. — coeffs are hard to interpret
— lack of distance measurement
So lets pre-cluster i.e. groups of buyers - based on behavior
Create a User Node and connect 2 User
Nodes if they have made a common
purchase.
Multiple common purchase will get a
higher edge weight.
Now run a Community Detection Algo
on the Graph
Query the Edges to find common item
category , then label clusters as say
‘Buyer-ItemType1’ , ‘Buyer-ItemType2’
etc.
To optimize, run the Algo on fraction of Users , then perform Label Propagation - to fill the rest .
Now query , last 4 weeks what this cluster is buying !
Accordingly, recommend the most purchased items by a cluster - to an user
(E) Anomaly & Time-series Pattern Detection
(E1) Complex Time Series Data Analysis
Cluster spatiotemporal distribution of housing data - based on underlying price dynamics
Video Link ~ https://www.youtube.com/watch?v=E9XTOnEgqRY
Dynamical Modeling …. complete Unsupervised Learning !
>> (Evolution) dynamics across time for a specific series
>> (Interaction Structure)
Goals : prediction , forecasting , classification , retrospective analysis , interpretation
Segmentation into behaviors !
How to capture interaction between the time series ?
How to discover structure across time ? The answer is Segmentation into behaviors
15. How do we perform Segmentation ? - first approach is ‘Learned HMM’ to learn the
parameters associated with the model.
Learning of parameters using HMM ….
How many behaviors are present ? - Bayesian nonparametrics - help build the infinite
set of behaviors and then narrow down into small set .
Find the ‘shared segments’ e.g. ‘Volatility regimes in financial time series’ and ‘Speech
segmentation’ …..
How to scale up - Learning of Bayesian HMMs ?
Instead of iterating through say 250 million indexes , break into manageable segments .
For millions of data points across time-serieses , break into vertical minibatches of time-points
and apply stochastic gradient alg.
Discover Groups with Correlated Dynamics ….
e.g. Cluster spatiotemporal distribution of housing data - based on underlying price dynamics !
— for each census track i, value of census (x) ->
— for each time-stamp there is multiple house sells at multiple places
16. — if there is
no sale in my
neighborhood
, real-estate
appraisal
agents find
similar
neighborhoods
to do the comps …
Now , instead of treating the individual sensor tract
17. independent random variable — consider the Joint Distribution of across all the regions …
multi-variate normal distribution with a covariance matrix …. SIGMA …
if 2 sensor tracks fall into same block —- then they are correlated …. and if they are in different
block .. then they are independent ….
thus we get STRUCTURE of CORRELATED structures (Diagonal Blocks)
similarities in sole latent unobserved spaces with noisy measurements ….
now the Bayesian nonparametrics … offer the actual number of structures …
— Always do the dimensional modeling on
low rank data ….
18. High Dimensional Time-Series Analysis
Example : Daily returns of global stock indices — using time series graph — assume temporal
dependence ….
Transform X(t) time-series into Fourier Coeffs
Machine Learning Work Shop - Bayesian Nonparametrics for Complex Dynamical
models : https://www.youtube.com/watch?v=qo7BGf-I06I&spfreload=5
Bayesian Dynamic Modeling: Sharing Information Across Time and Space :
https://www.youtube.com/watch?v=LVPikT58meg
(E2) Forecasting Timeseries data
Machine Learning for Time Series Data in Python :
https://www.youtube.com/watch?v=ZgHGCfwExw0
Time Series Forecasting : https://www.youtube.com/watch?v=msFkHl7P28k&spfreload=5
ARIMA Models : https://www.youtube.com/watch?v=Aw77aMLj9uM , basics : https://
www.youtube.com/watch?v=HIWXdHlDSFs
MIT Courseware : https://www.youtube.com/watch?v=uBeM1FUk4Ps
(E3) Detect and model - periodic patterns in millions of time series data
video link ~ https://www.youtube.com/watch?v=xjHlu9OViVc
19.
20. (E4) Intel’s use case - Anamoly Detection in IOT
Video Link ~ https://www.youtube.com/watch?v=DD_BbAb9RhM
Key point ~ capture non-stationery periodicity
Detect sudden changes in correlation between a pair of sensors :
23. (F) Deep Learning
Applications
(F1) Build a Question
Answering System
video ~ https://www.youtube.com/watch?v=aHuLDhh3Rxw
Transparent AI System
Convert an image into 4000
dimensional vector
Take a Question
>> convert into LSTM (takes
one work at a time and embeds
the sentence)
24. One Level of Neurons activated by the feature, learning its a CAT .. next a Supervised Learning
is used to adjust the model which tells its a DOG , so the Deep Learning Network updates its
learning …..
http://tensorflow.org/whitepaper2015.pdf
25. Future possibilities ~ building personal assistants , health care systems (medicine production)
by - Combining Vision with Robotics
(F2) Recurrent Neural Network to generate Smart Reply of Gmail
http://www.slideshare.net/SessionsEvents/anjuli-kannan-software-engineer-google-at-mlconf-
sf-2016
https://www.youtube.com/watch?v=f5-
_uKHhohQ&index=11&list=PLrbAIdPI69Pi88waiIv8gZ3agEU_hBaVM
(F3) Conversational AI ~ Spoken Labs
Video Link ~ https://www.youtube.com/watch?v=bDJtSqyKHyA
27. Video Demo ~
Reinforcement Learning - is a Data-driven Approach for learning behavior
find the most suitable behavior i.e. estimate a function that maps environment state to actions
RL is the best approach as
> its not important to specify a function
> easy to identify correct output
> easy to specify behavior
A Robot - is in state theta1, theta2, wt1, wt2 (angles of movement)
Action - clockwise torque
Goal - balance the movement
RL doesn’t need good policy
RL doesn’t need labelled data
RL adapts to environment changes (sample distribution changes during learning)
Deep RL -
> variation of Q-Learning that uses deep neural network and random drawing of data
> uses 2 networks - regular Q and Q’ to mitigate non-stationery updates
> deep RL is applied directly to the belief-state space due to strong generalization properties to
find an effective policy
29. (I) Applying Neural Turing Machine
these are differentiable turning machines (sharp functions made
smooth , trains with back propagation)
-learns simple algorithms (copy, repeat, recognize simple formal
language)
-generalizes quickly (specially for Language Modeling)
-Note : LSTM
Special techniques like - Gradient Clipping , Loss Clipping and
Adam’s Optimizer are used.
Grand Unified Theory of Machine Learning
— Representation :
probabilistic logic >> Markov Logic Network
Formula : present the model as combination of first-order logics and bayesian network
Weights :
— Evaluation :
> find the Hyposthesis with highest posterior probability
> whats the objective function —
say business wants to optimize ROI (objective function)
— Optimization :
> discover best formula (Genetic Programming)
> learn the weights of the formula (Bacprops)