Download to read offline
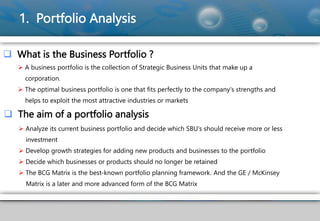
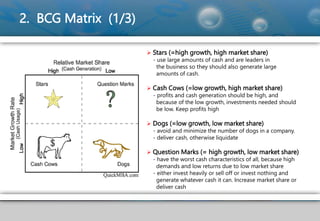
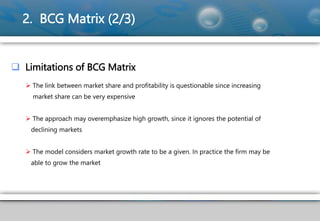
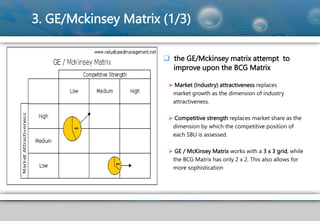
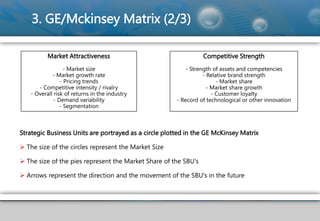

This document discusses portfolio analysis tools including the BCG matrix and GE/McKinsey matrix. It provides an overview of each including: 1) The BCG matrix categorizes business units as stars, cash cows, dogs, or question marks based on market growth and market share. It aims to analyze a company's portfolio and determine investment levels. 2) The GE/McKinsey matrix evaluates business units based on industry attractiveness and competitive strength instead of growth and share. It uses a 3x3 grid instead of 2x2. 3) Both tools have advantages in evaluating businesses but also limitations like oversimplifying factors and not capturing interactions between units.


