Download to read offline
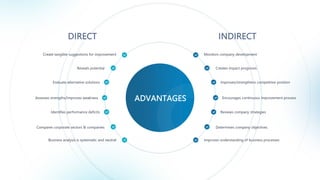
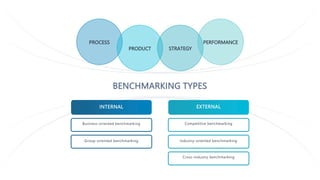
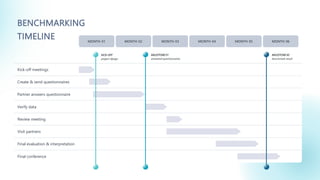
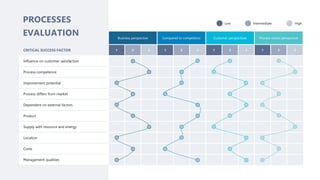
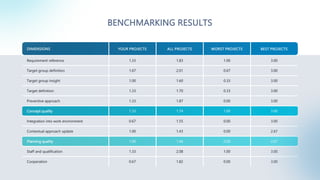

This document provides information on benchmarking, including its advantages, types, process, and results. It lists the advantages of benchmarking as creating improvement suggestions, revealing potential, evaluating solutions, assessing strengths/weaknesses, and more. It describes the main types of benchmarking as process, product, strategy, and performance benchmarking, which can be internal or external. The benchmarking process and timeline are then outlined in steps over a 6 month period. Metrics for evaluating processes are shown, followed by sample benchmarking results across different dimensions and projects.


