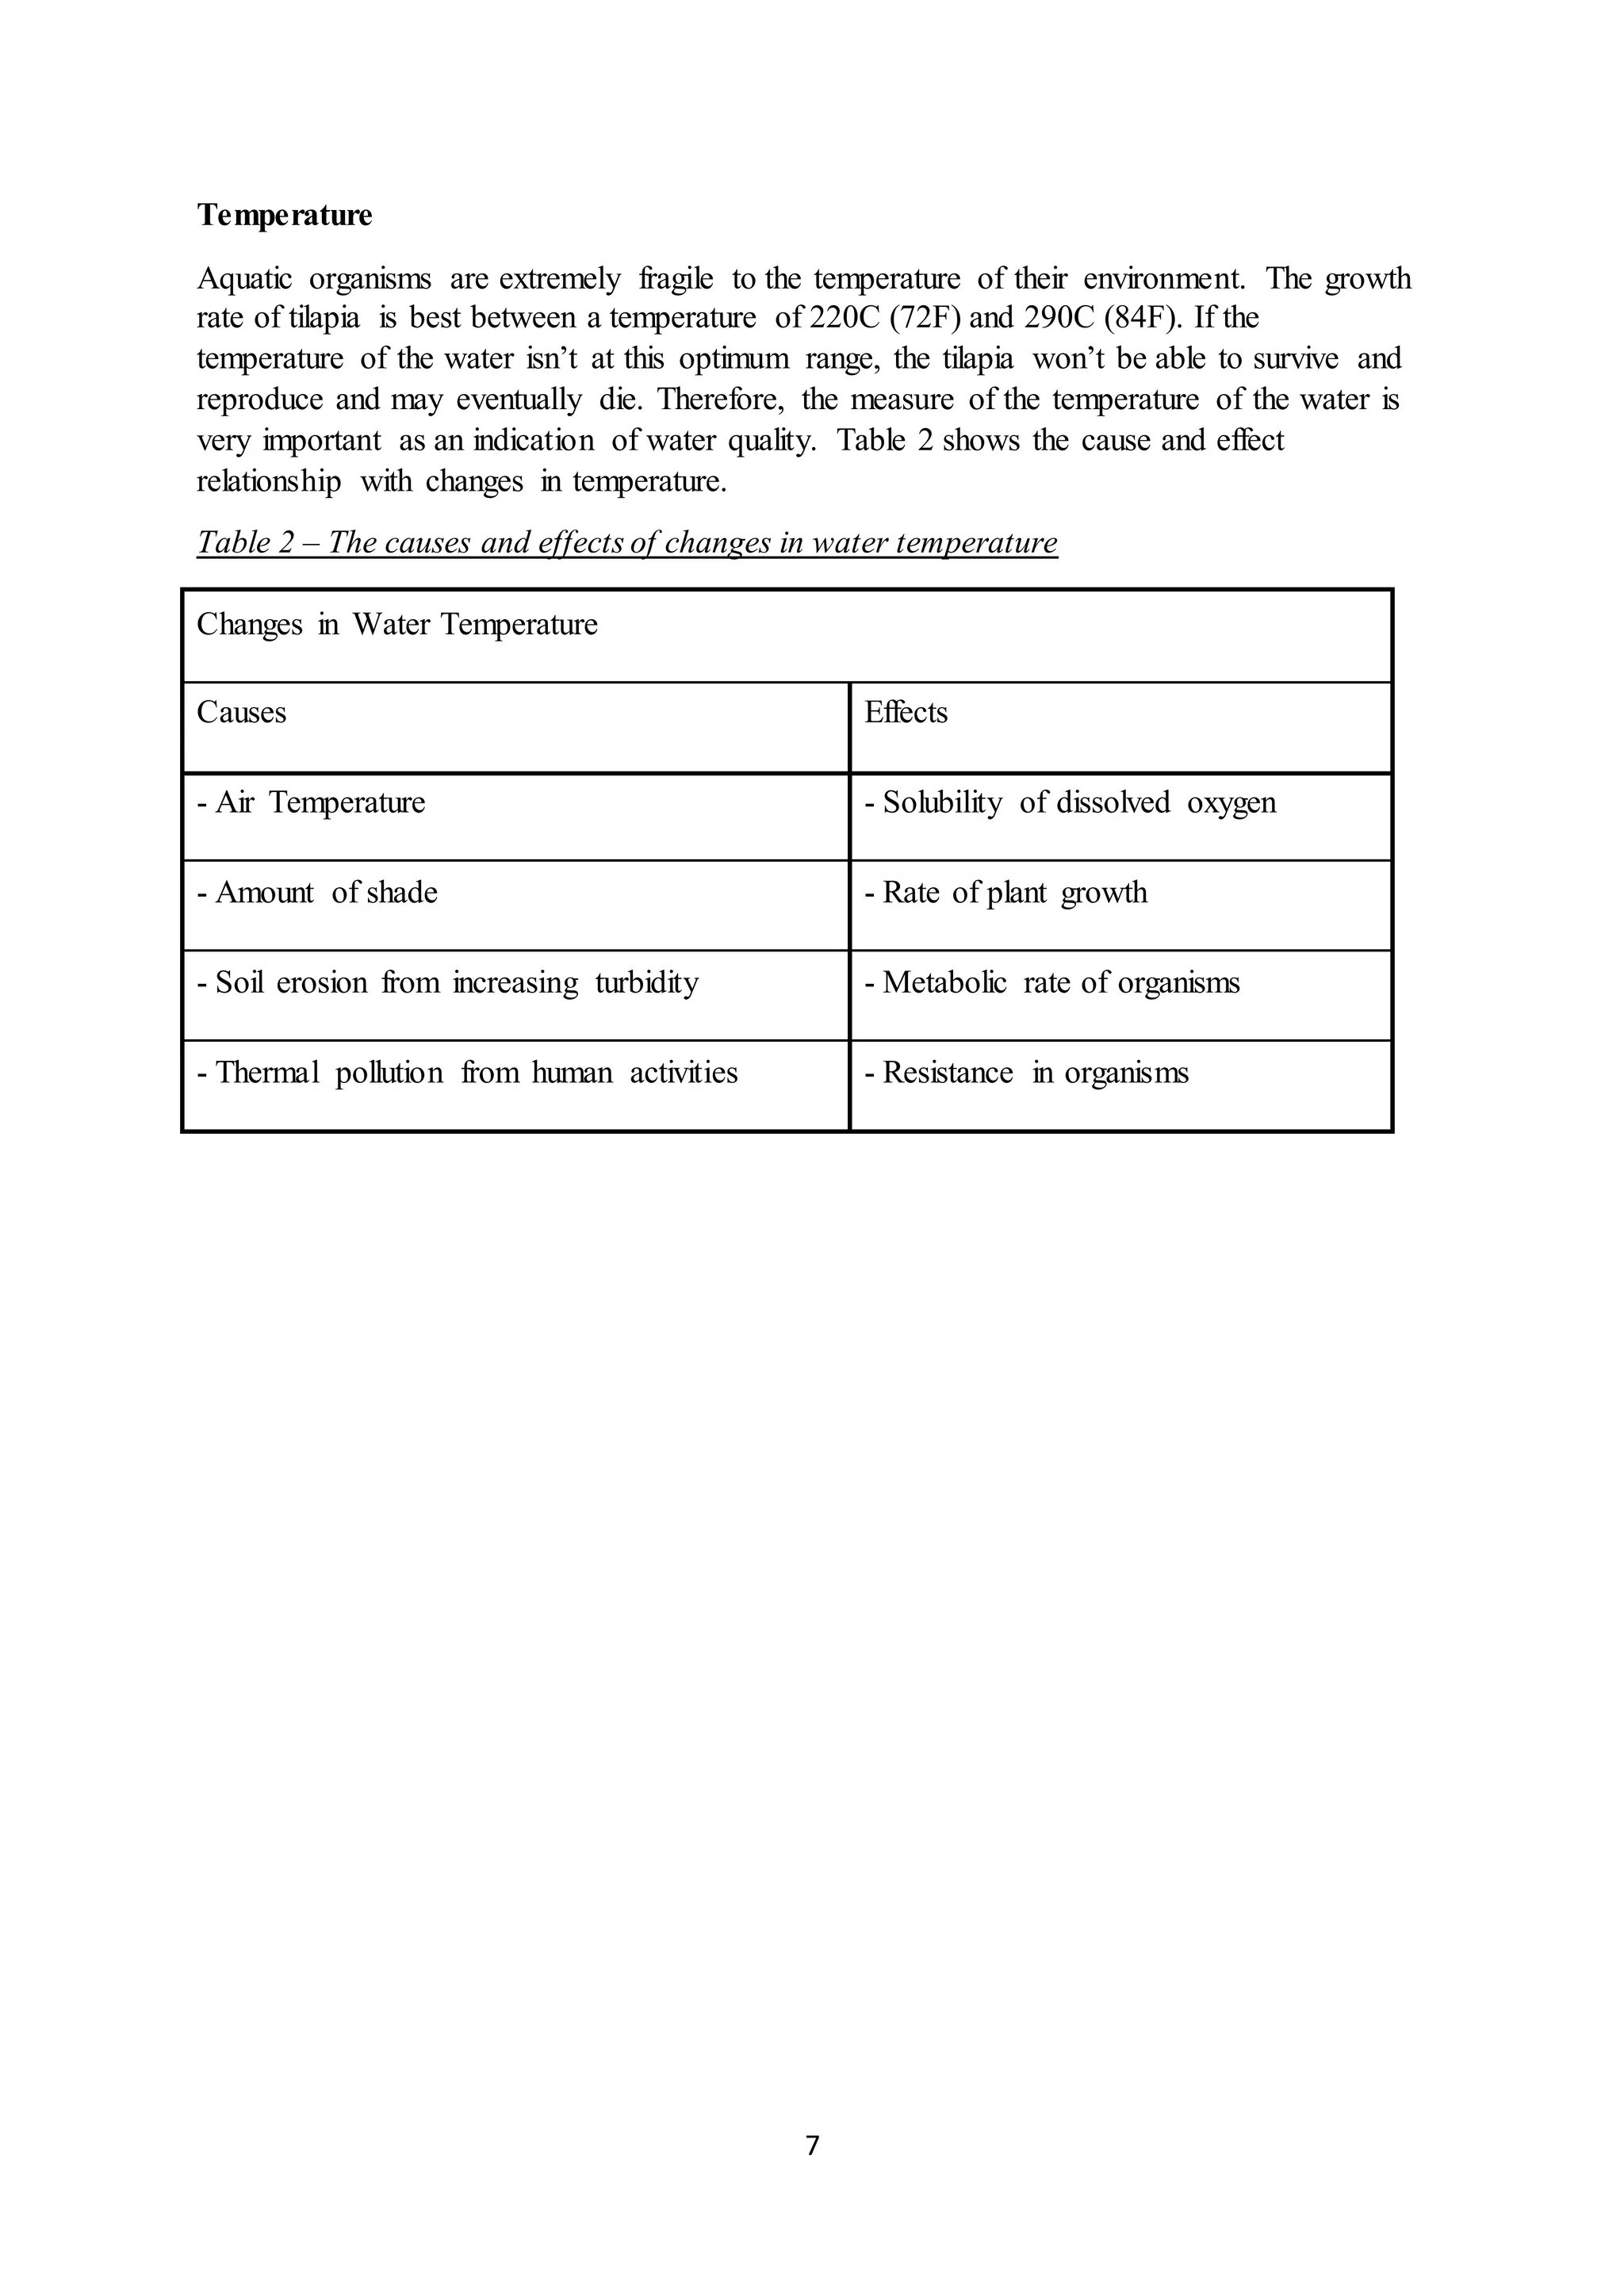
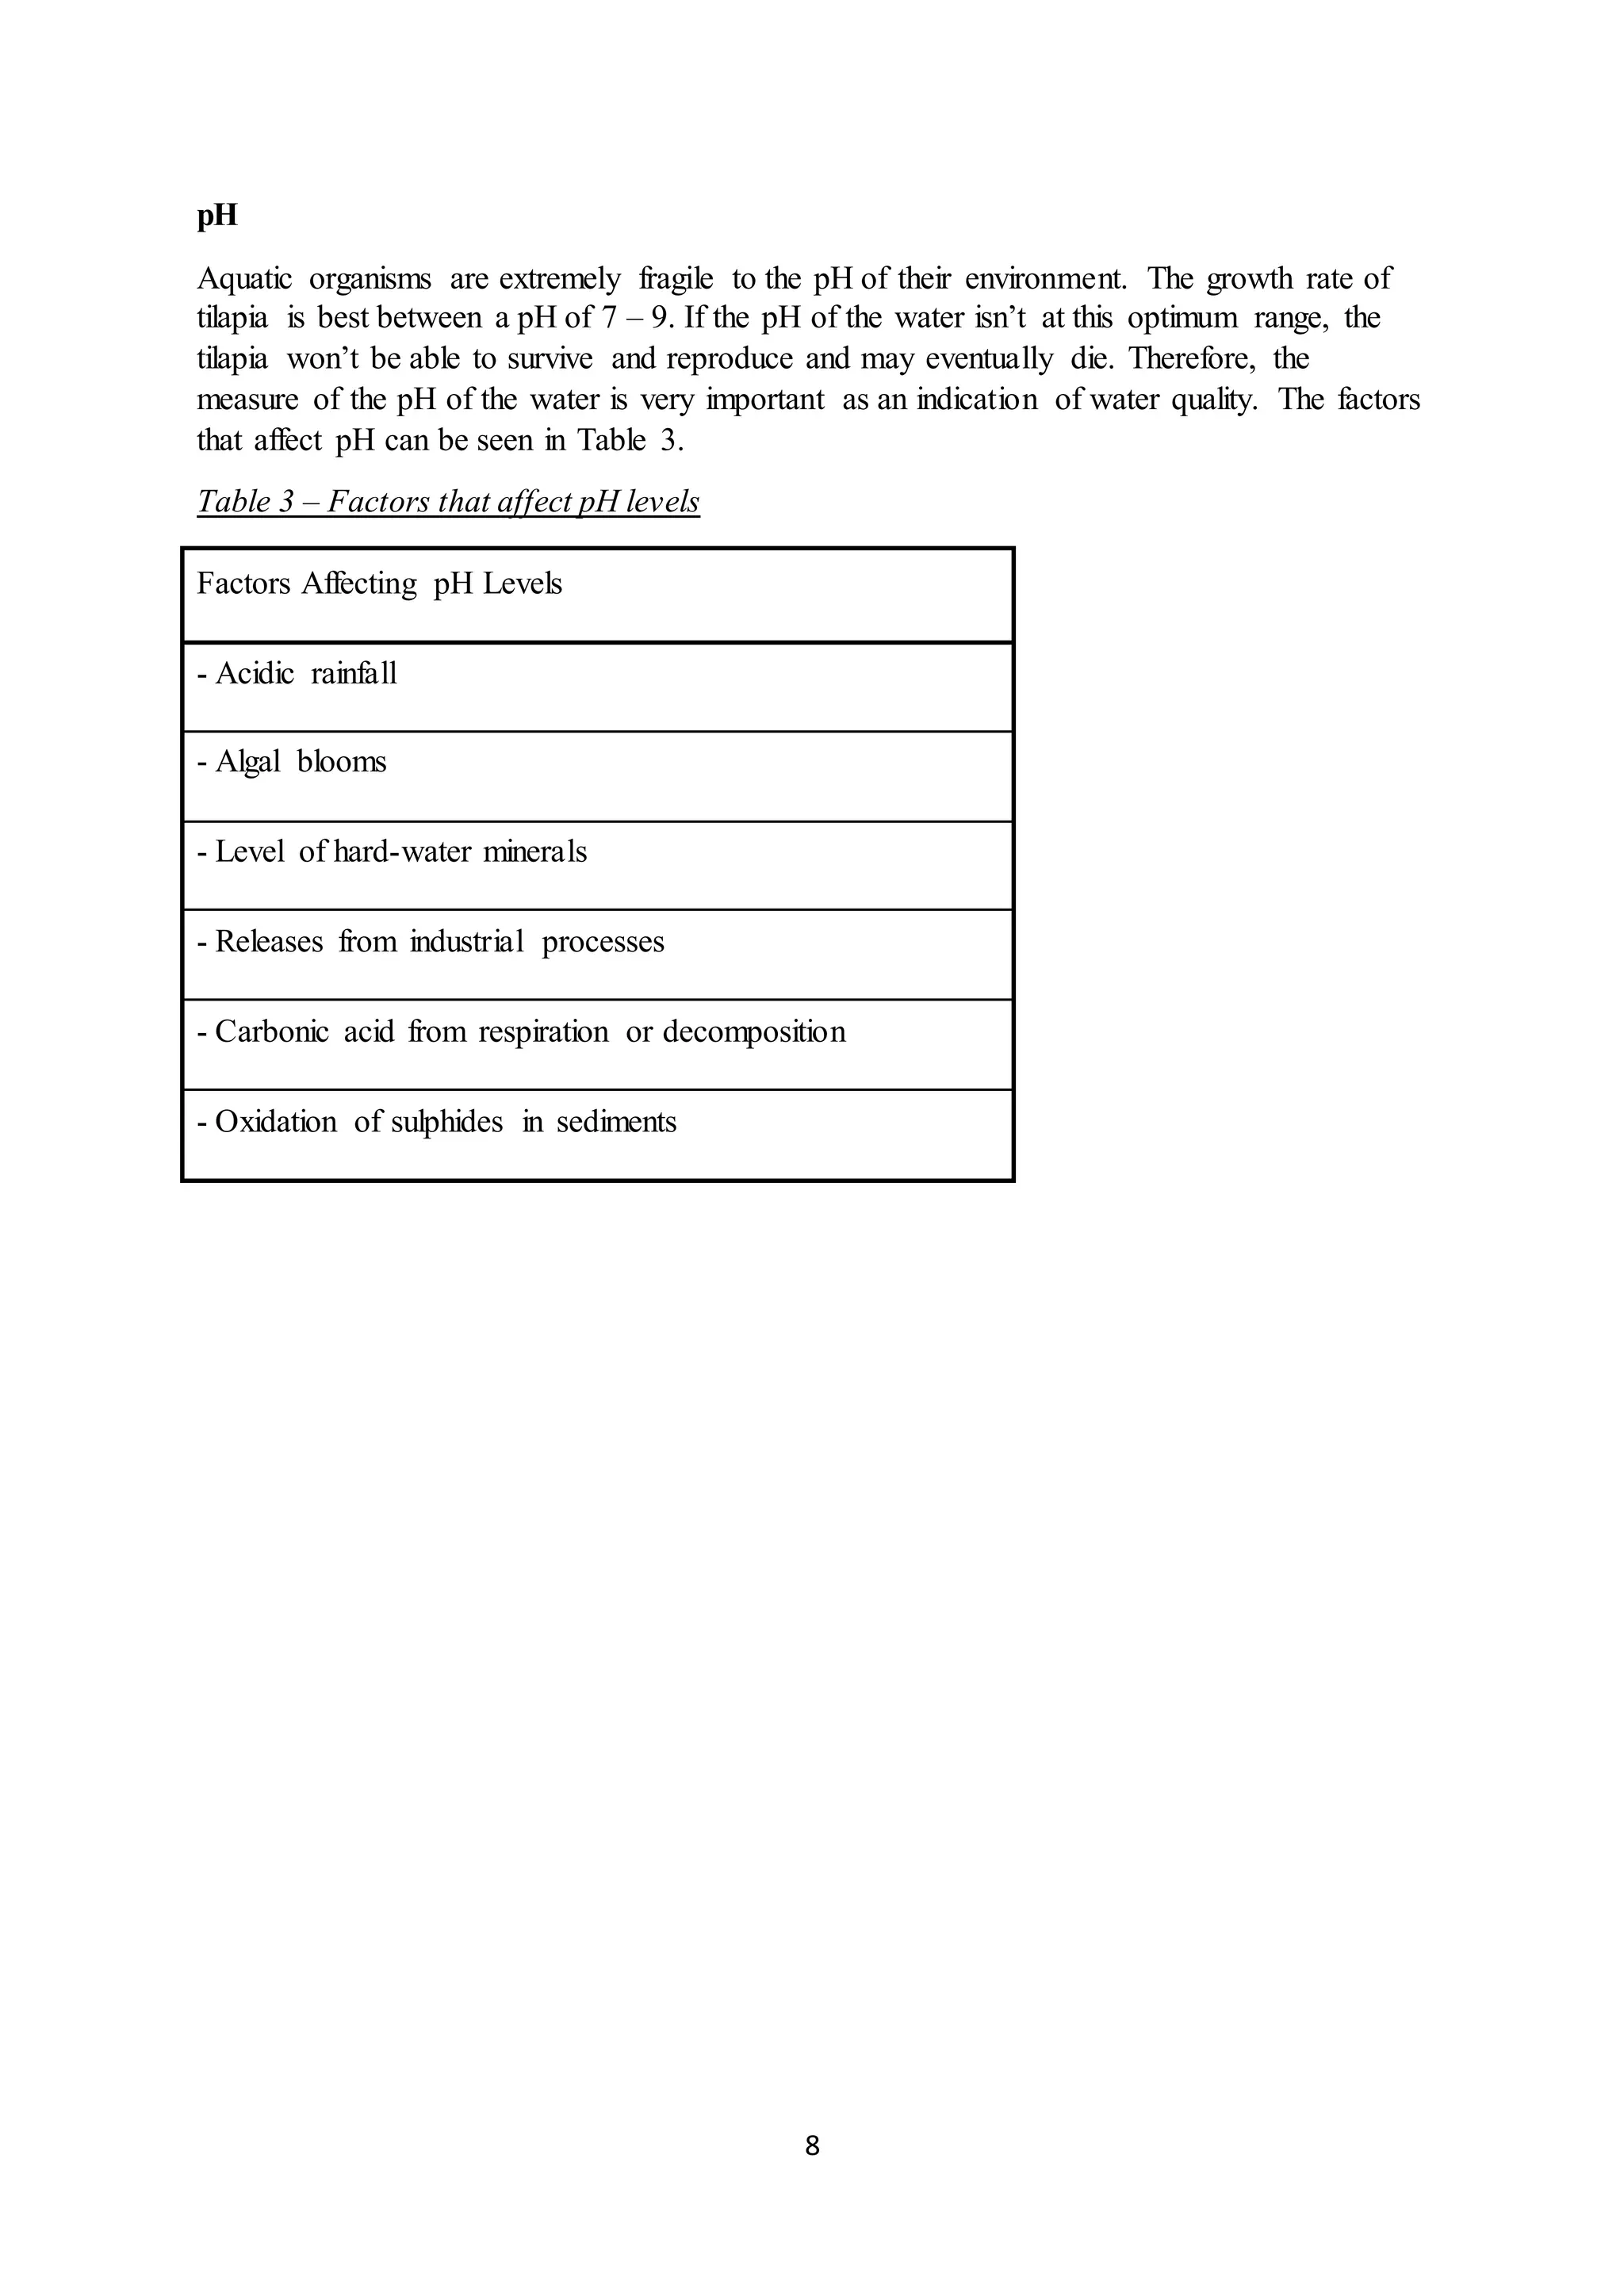
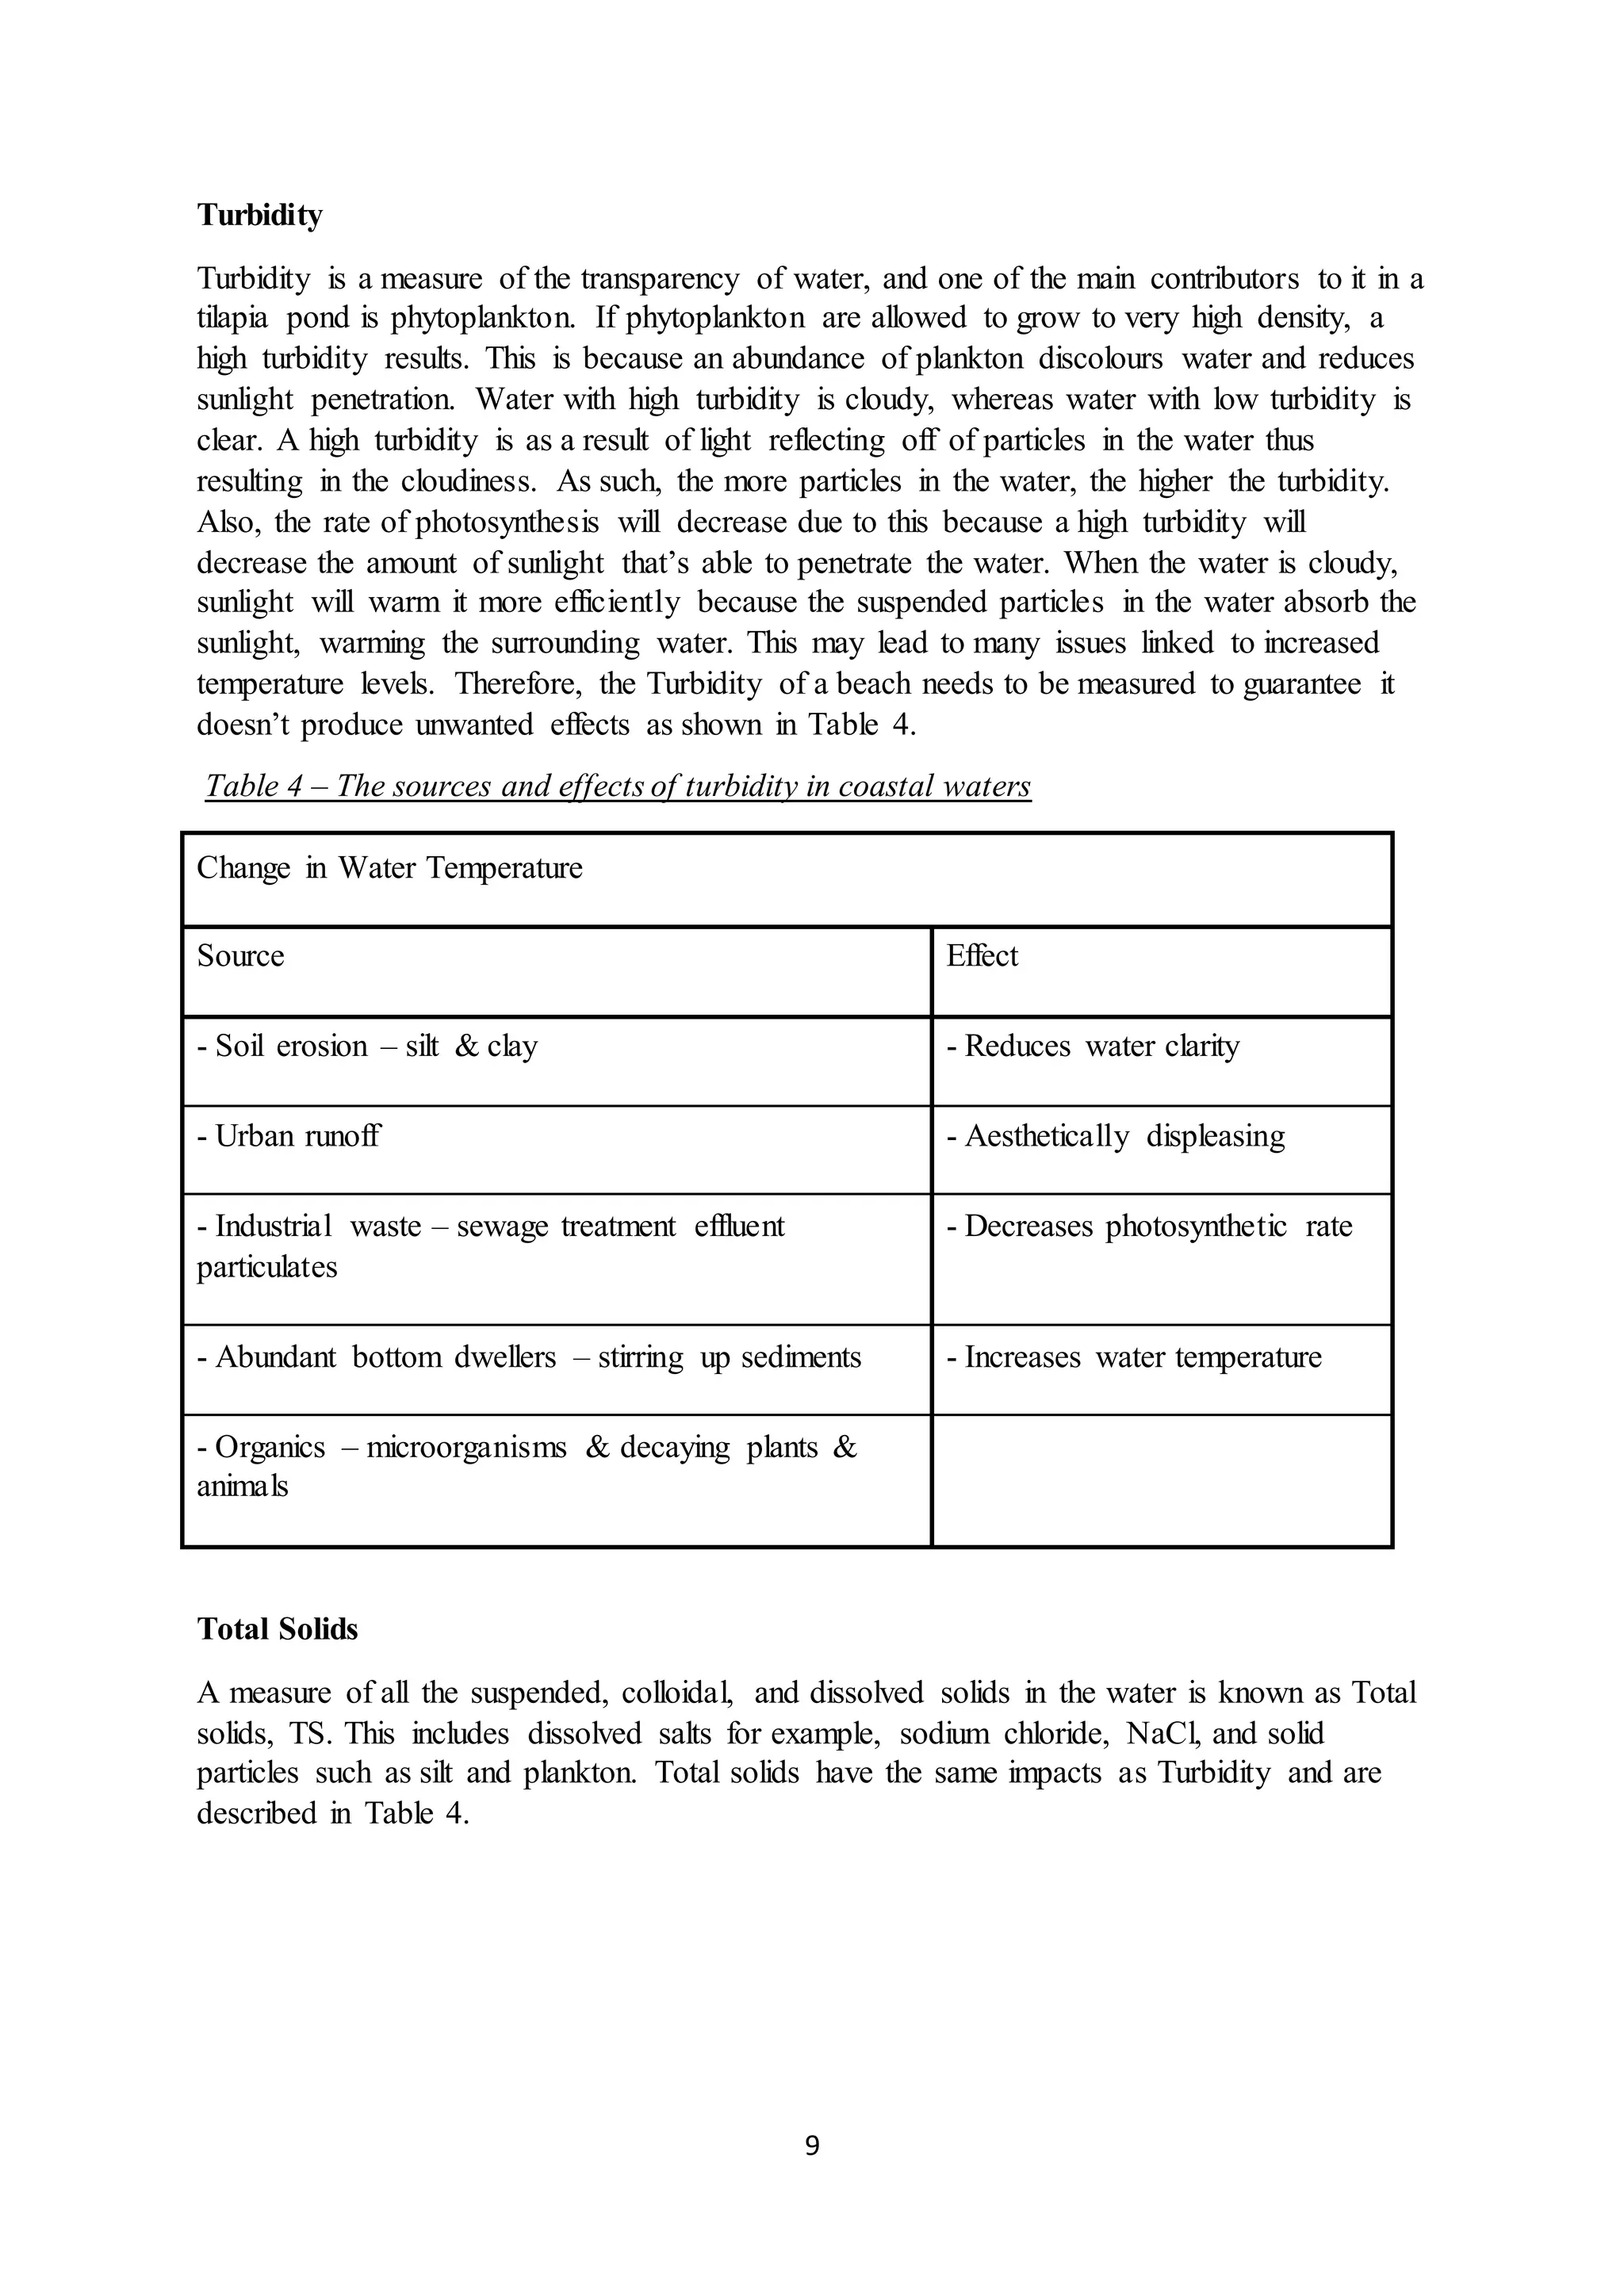
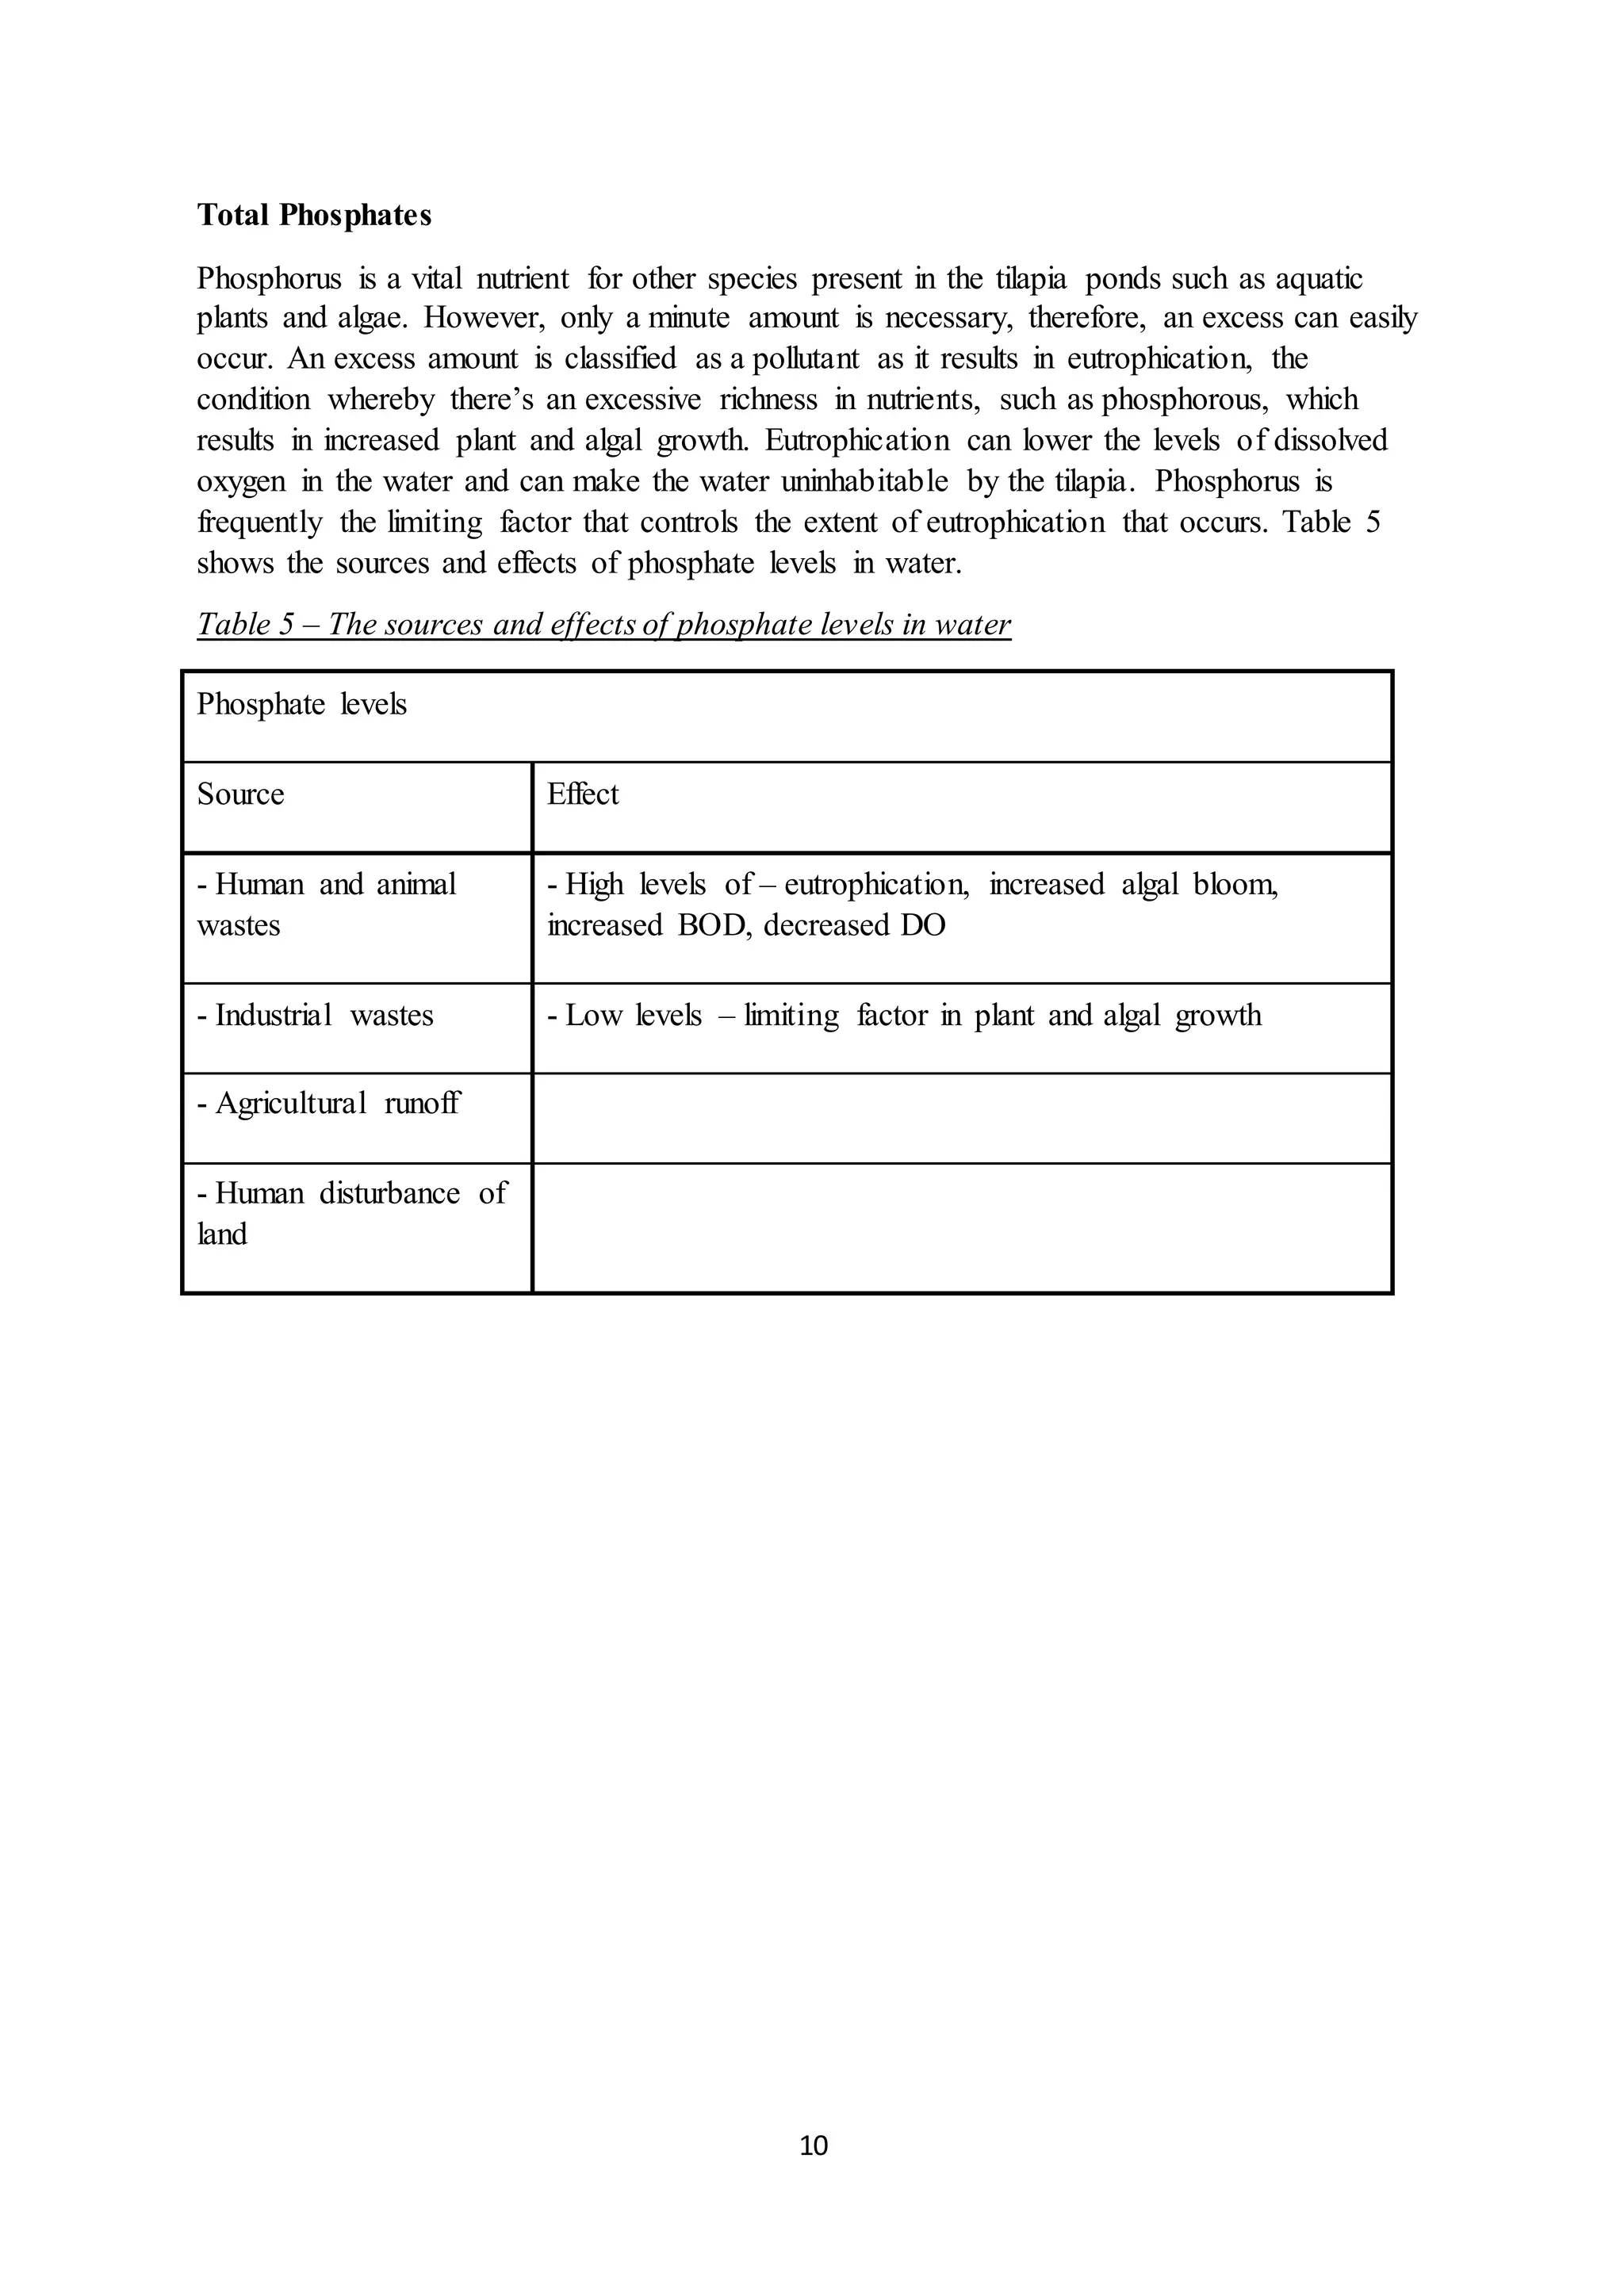
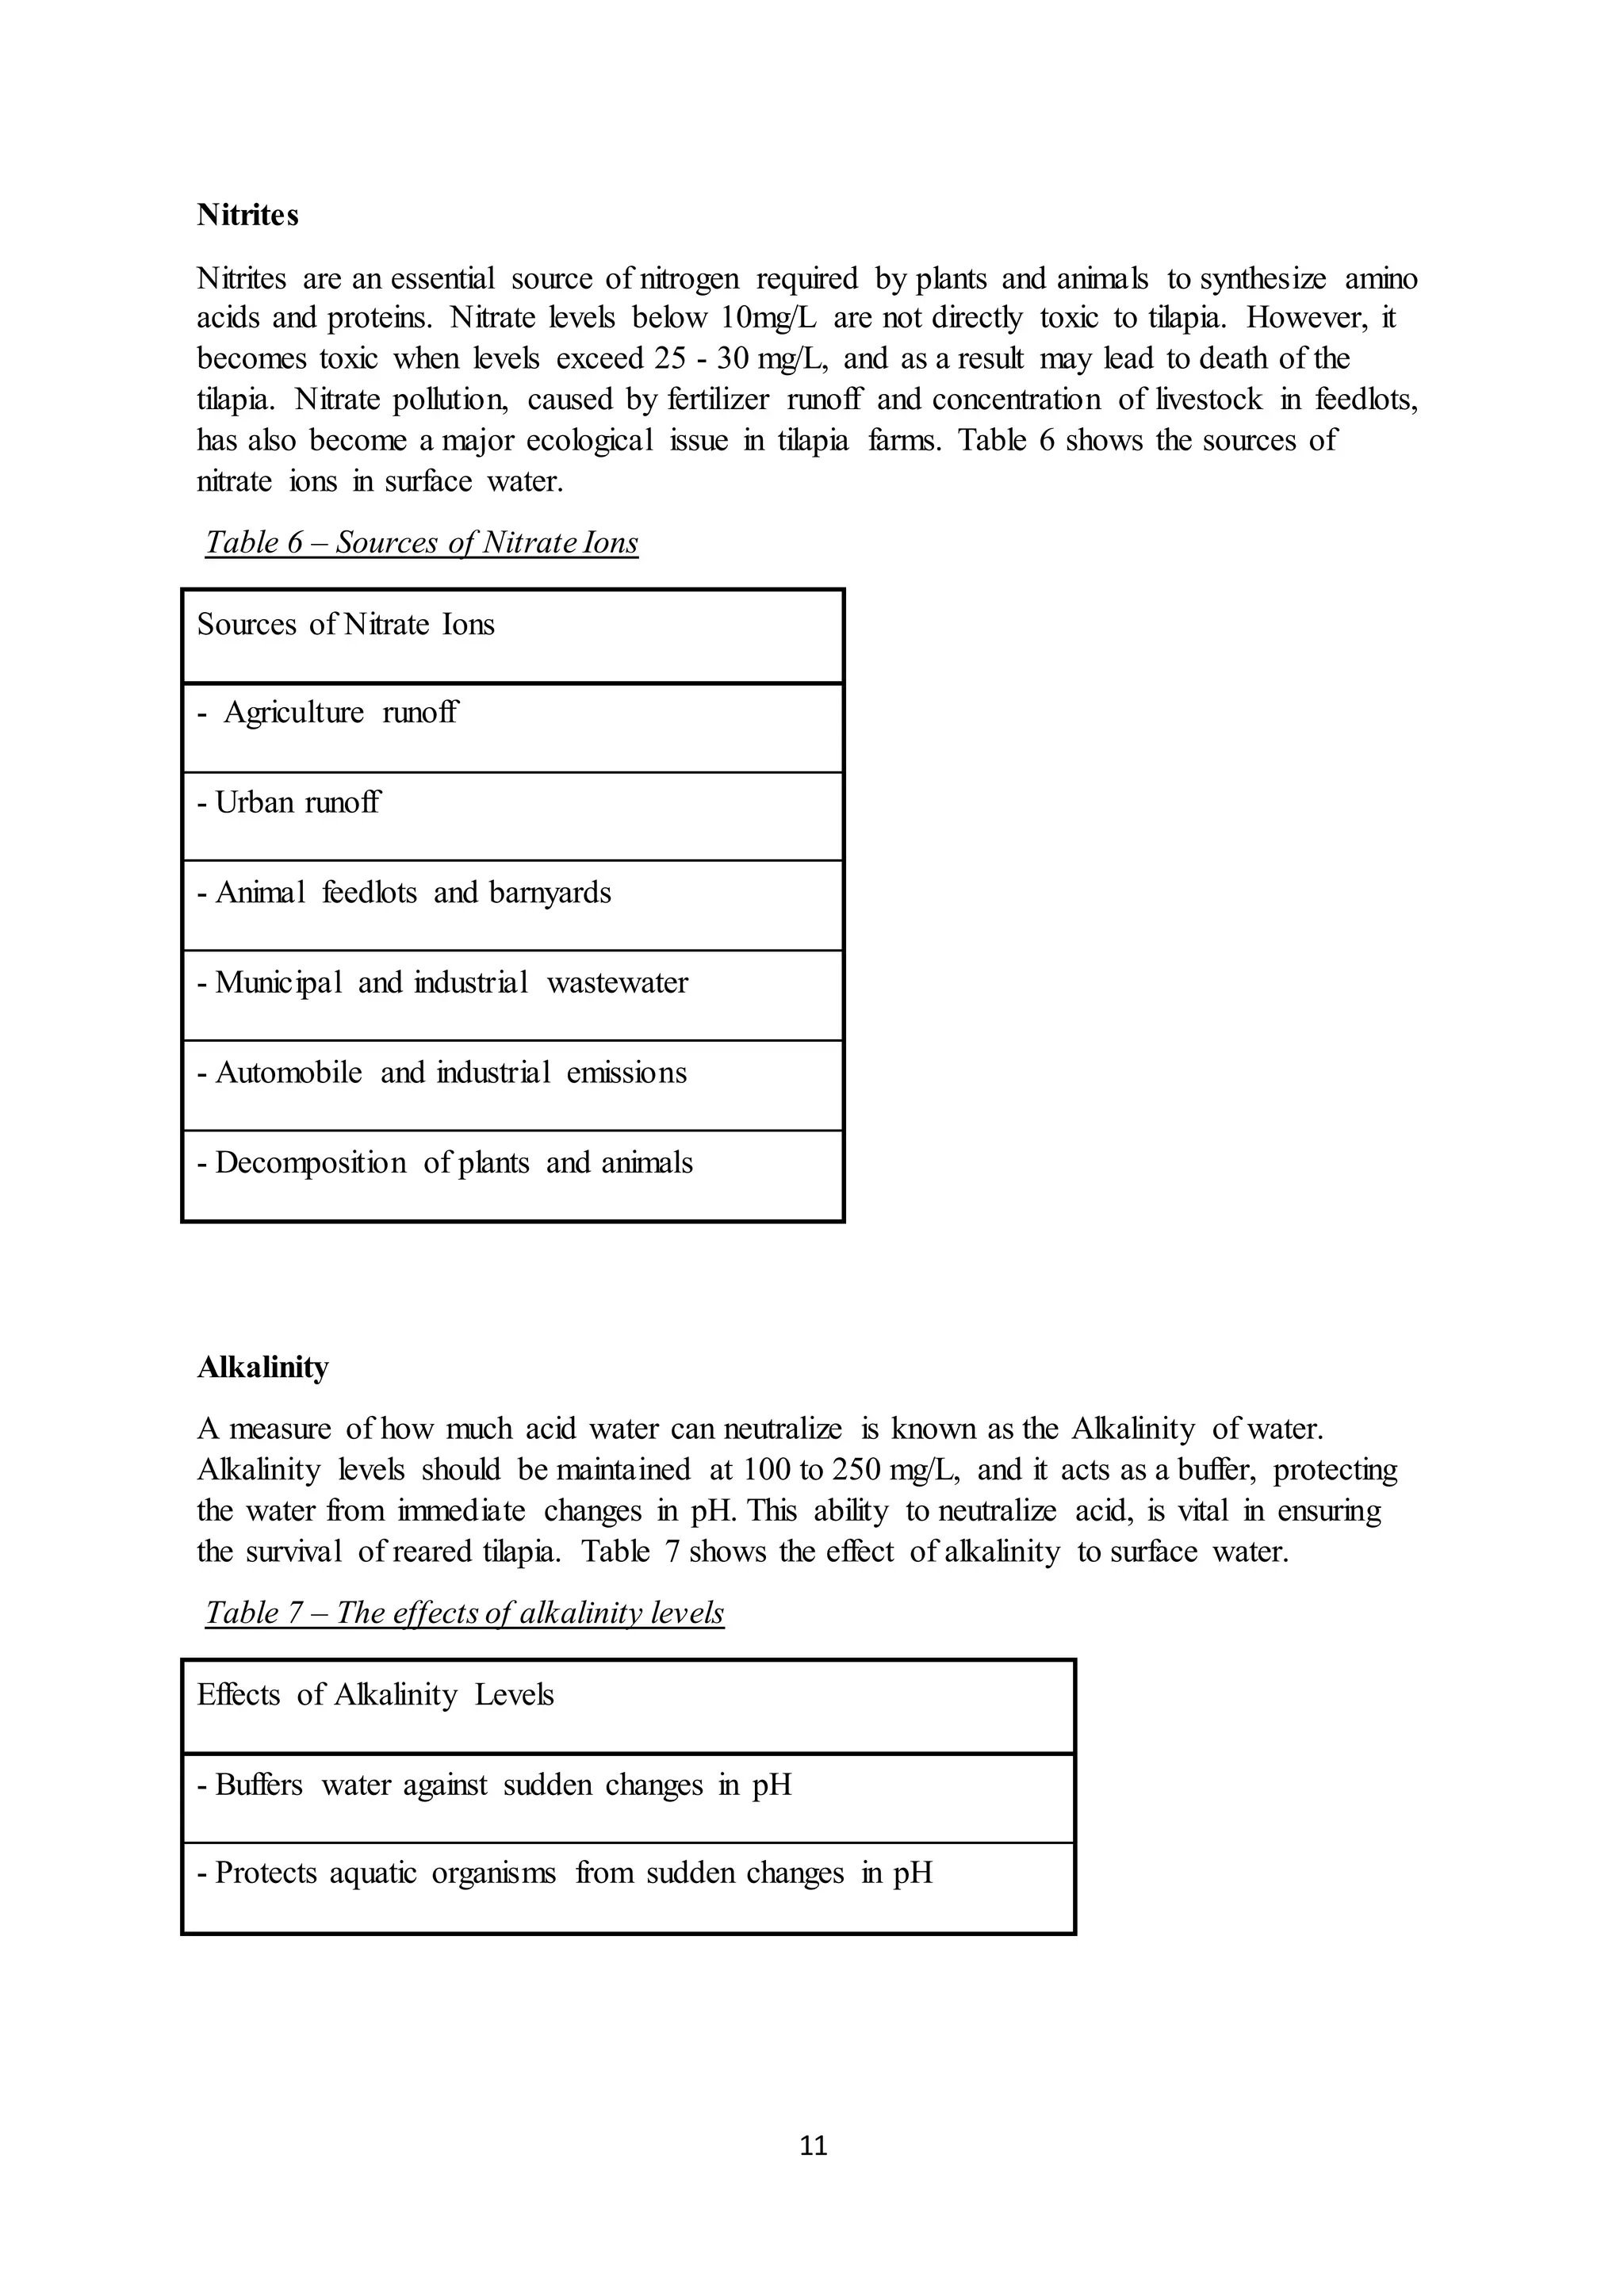
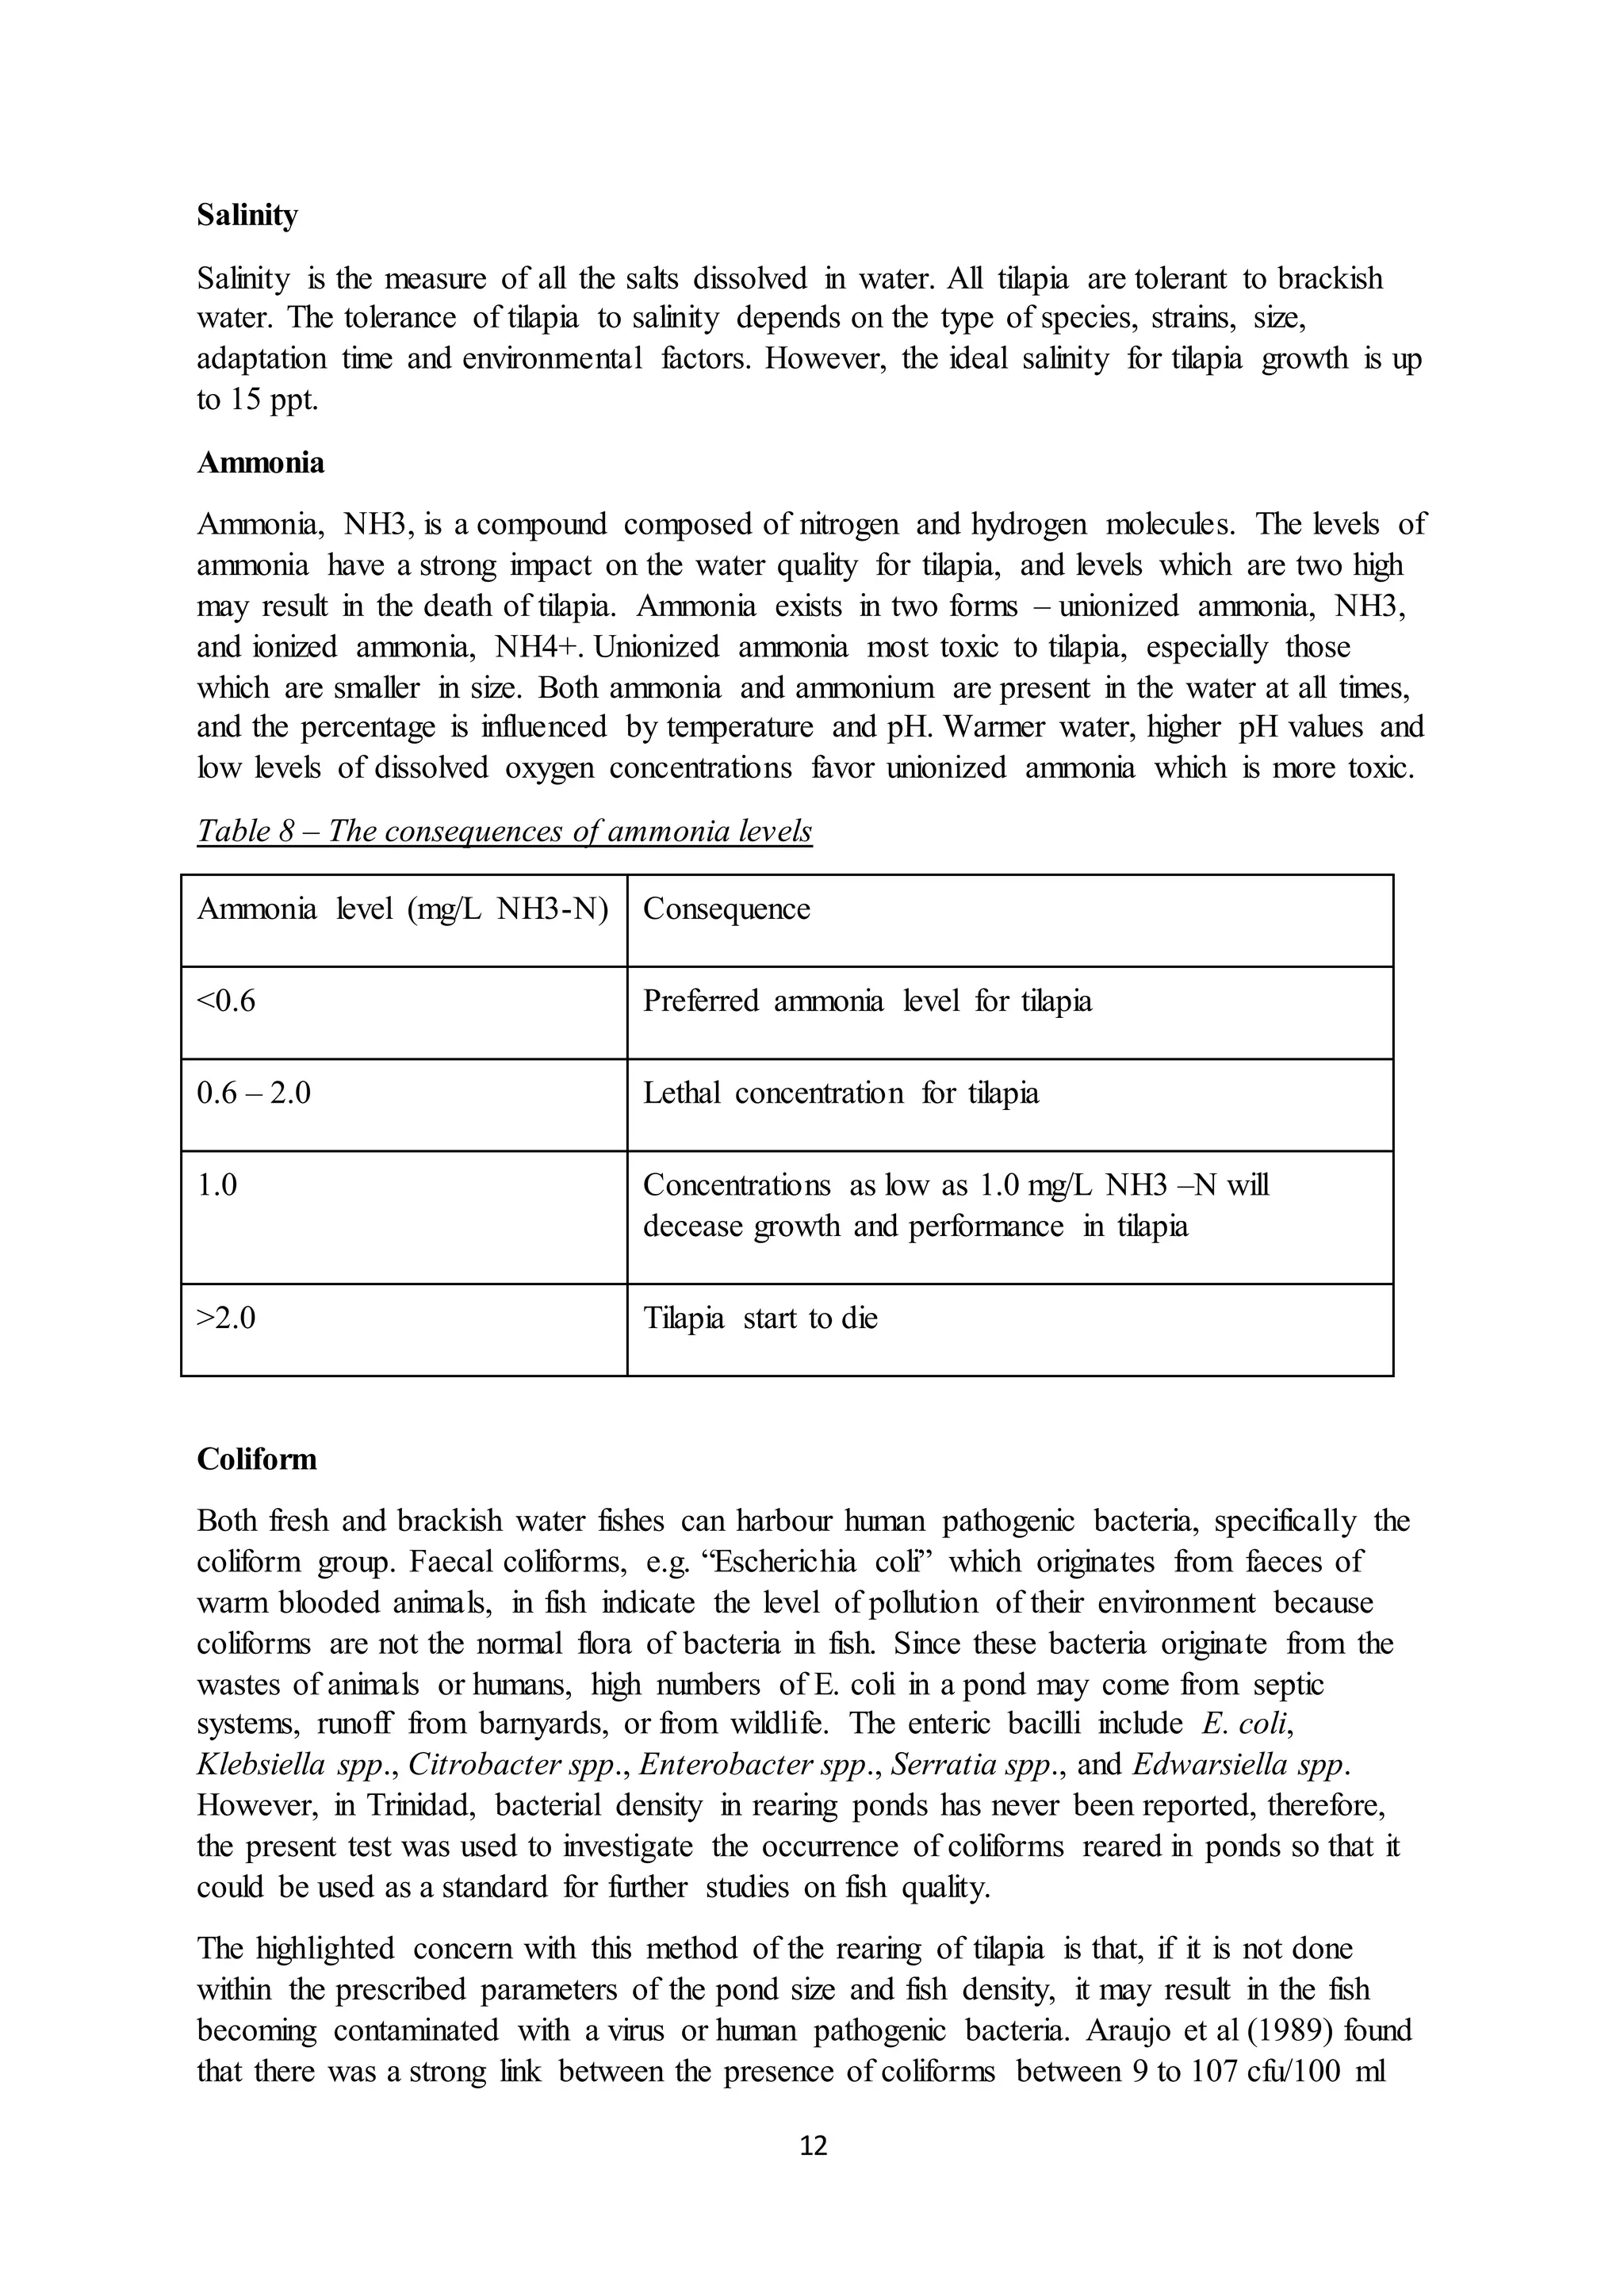
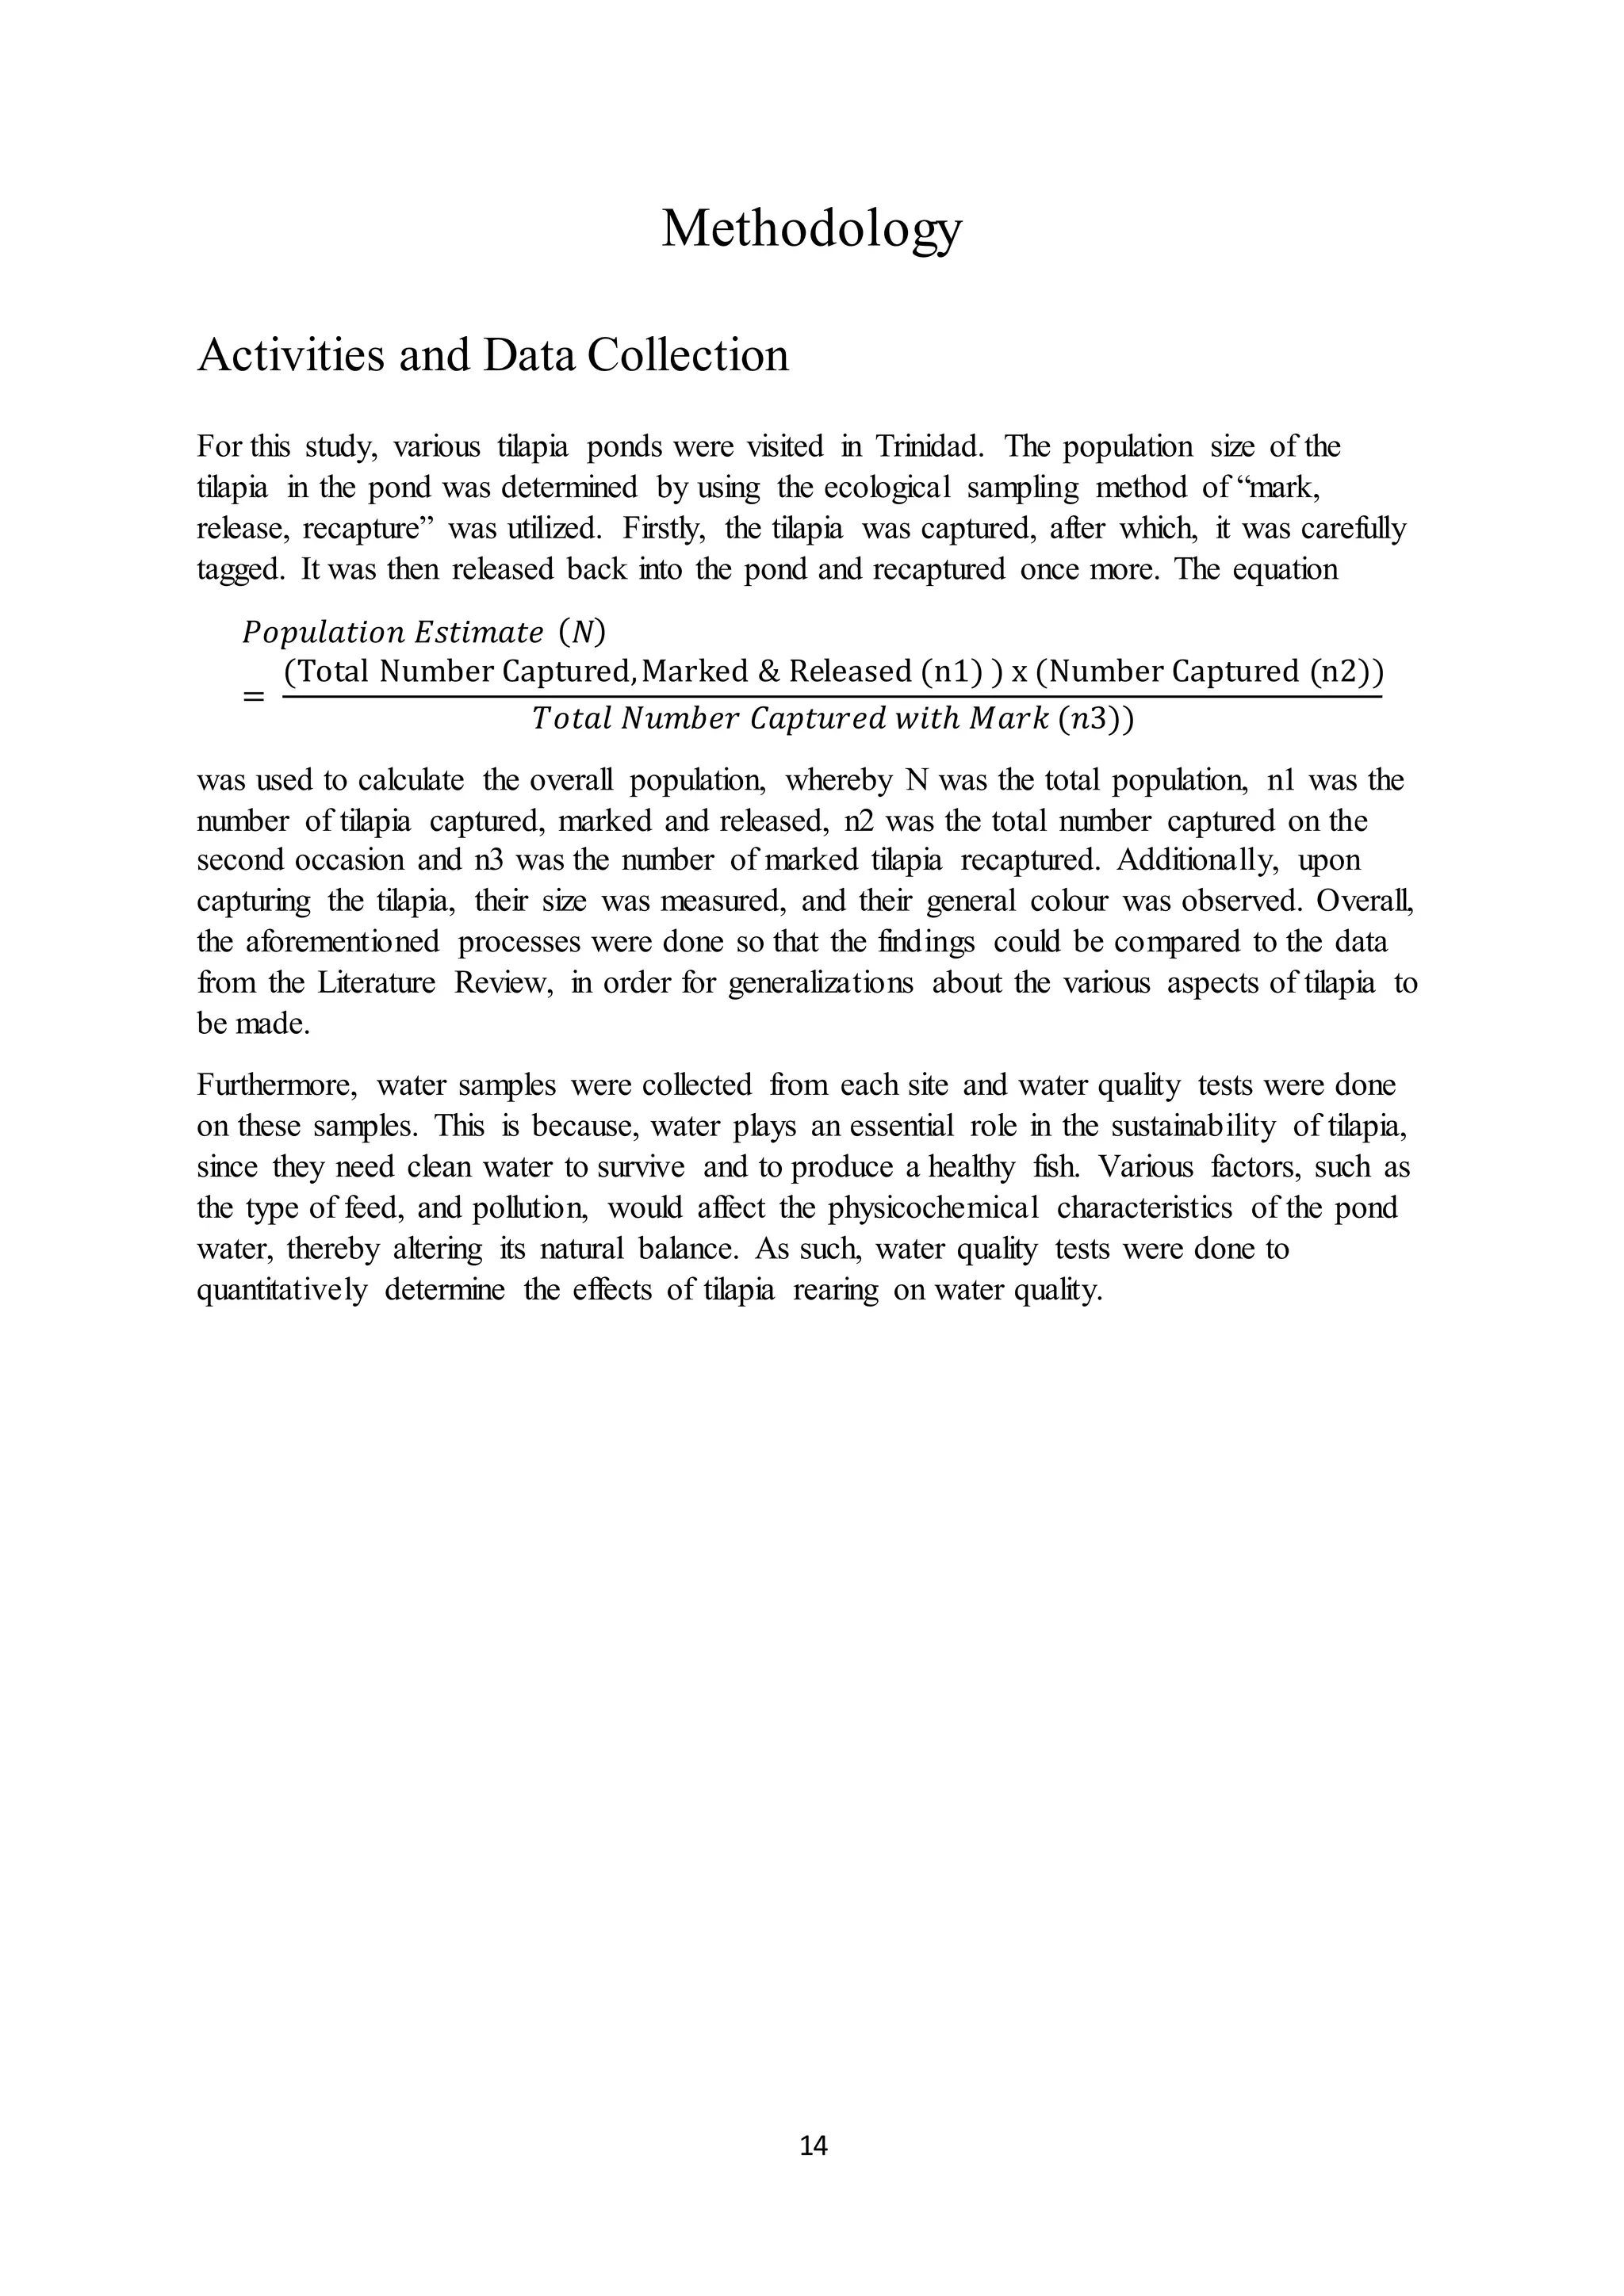
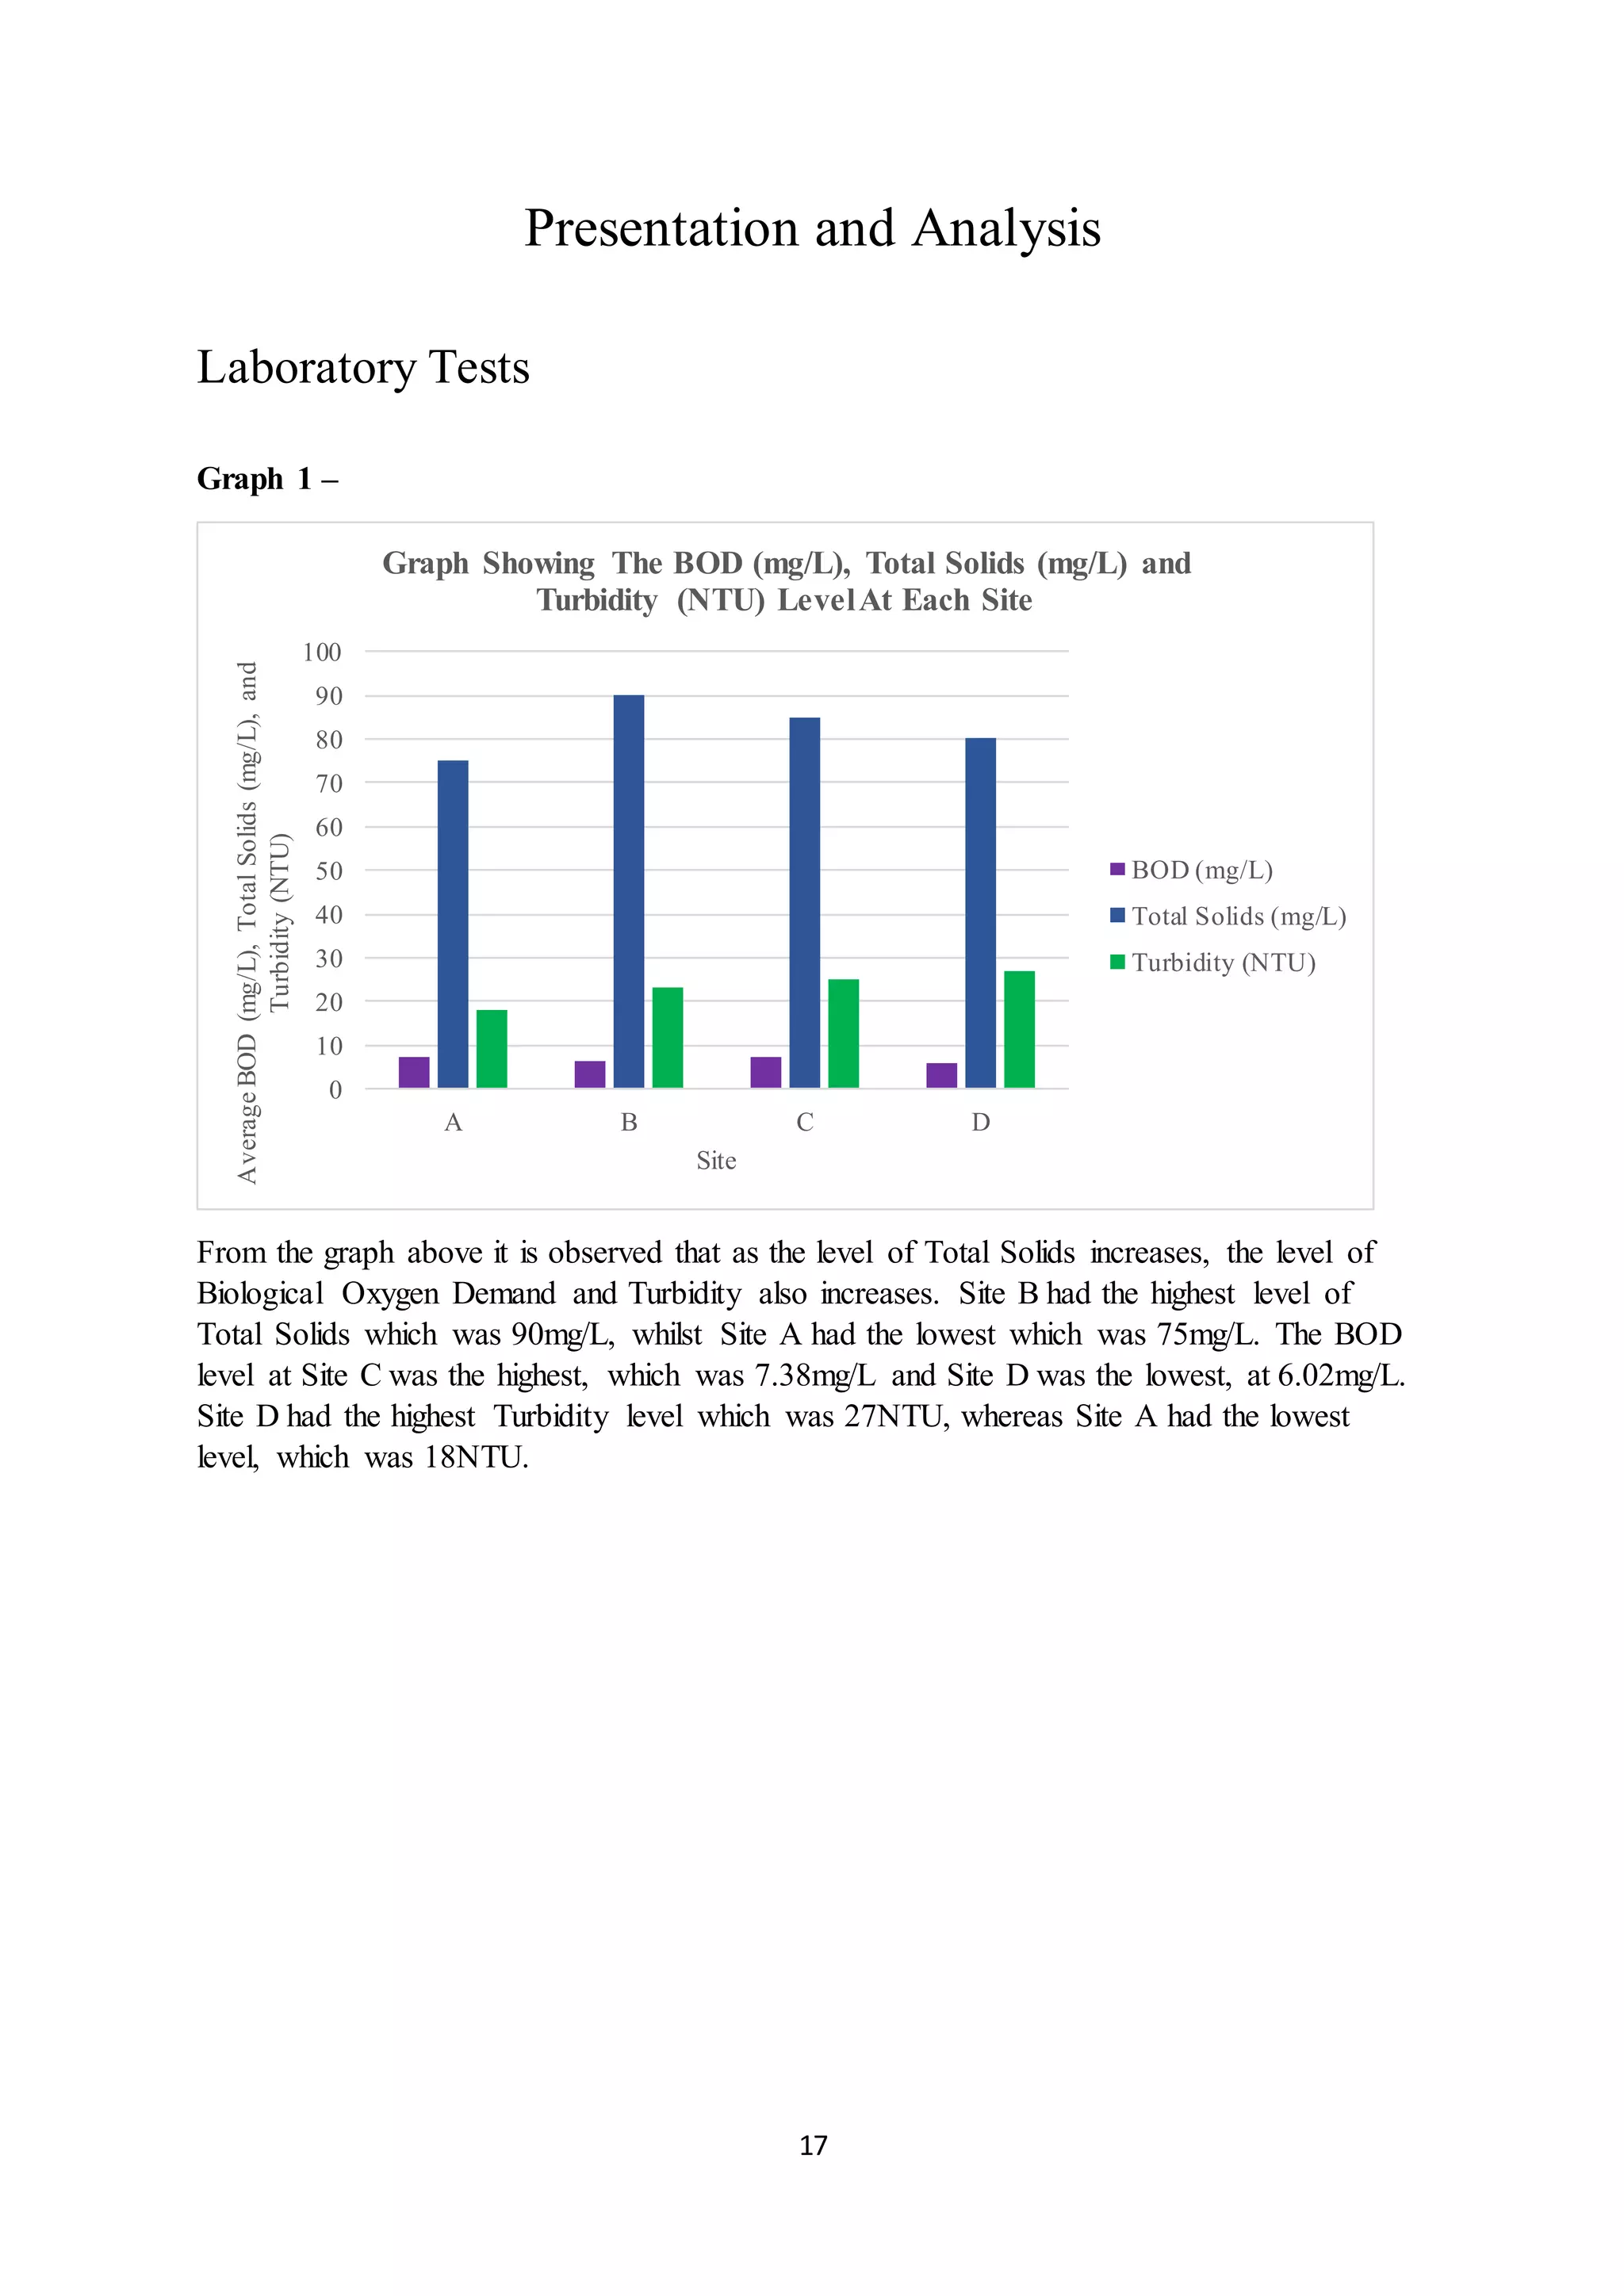
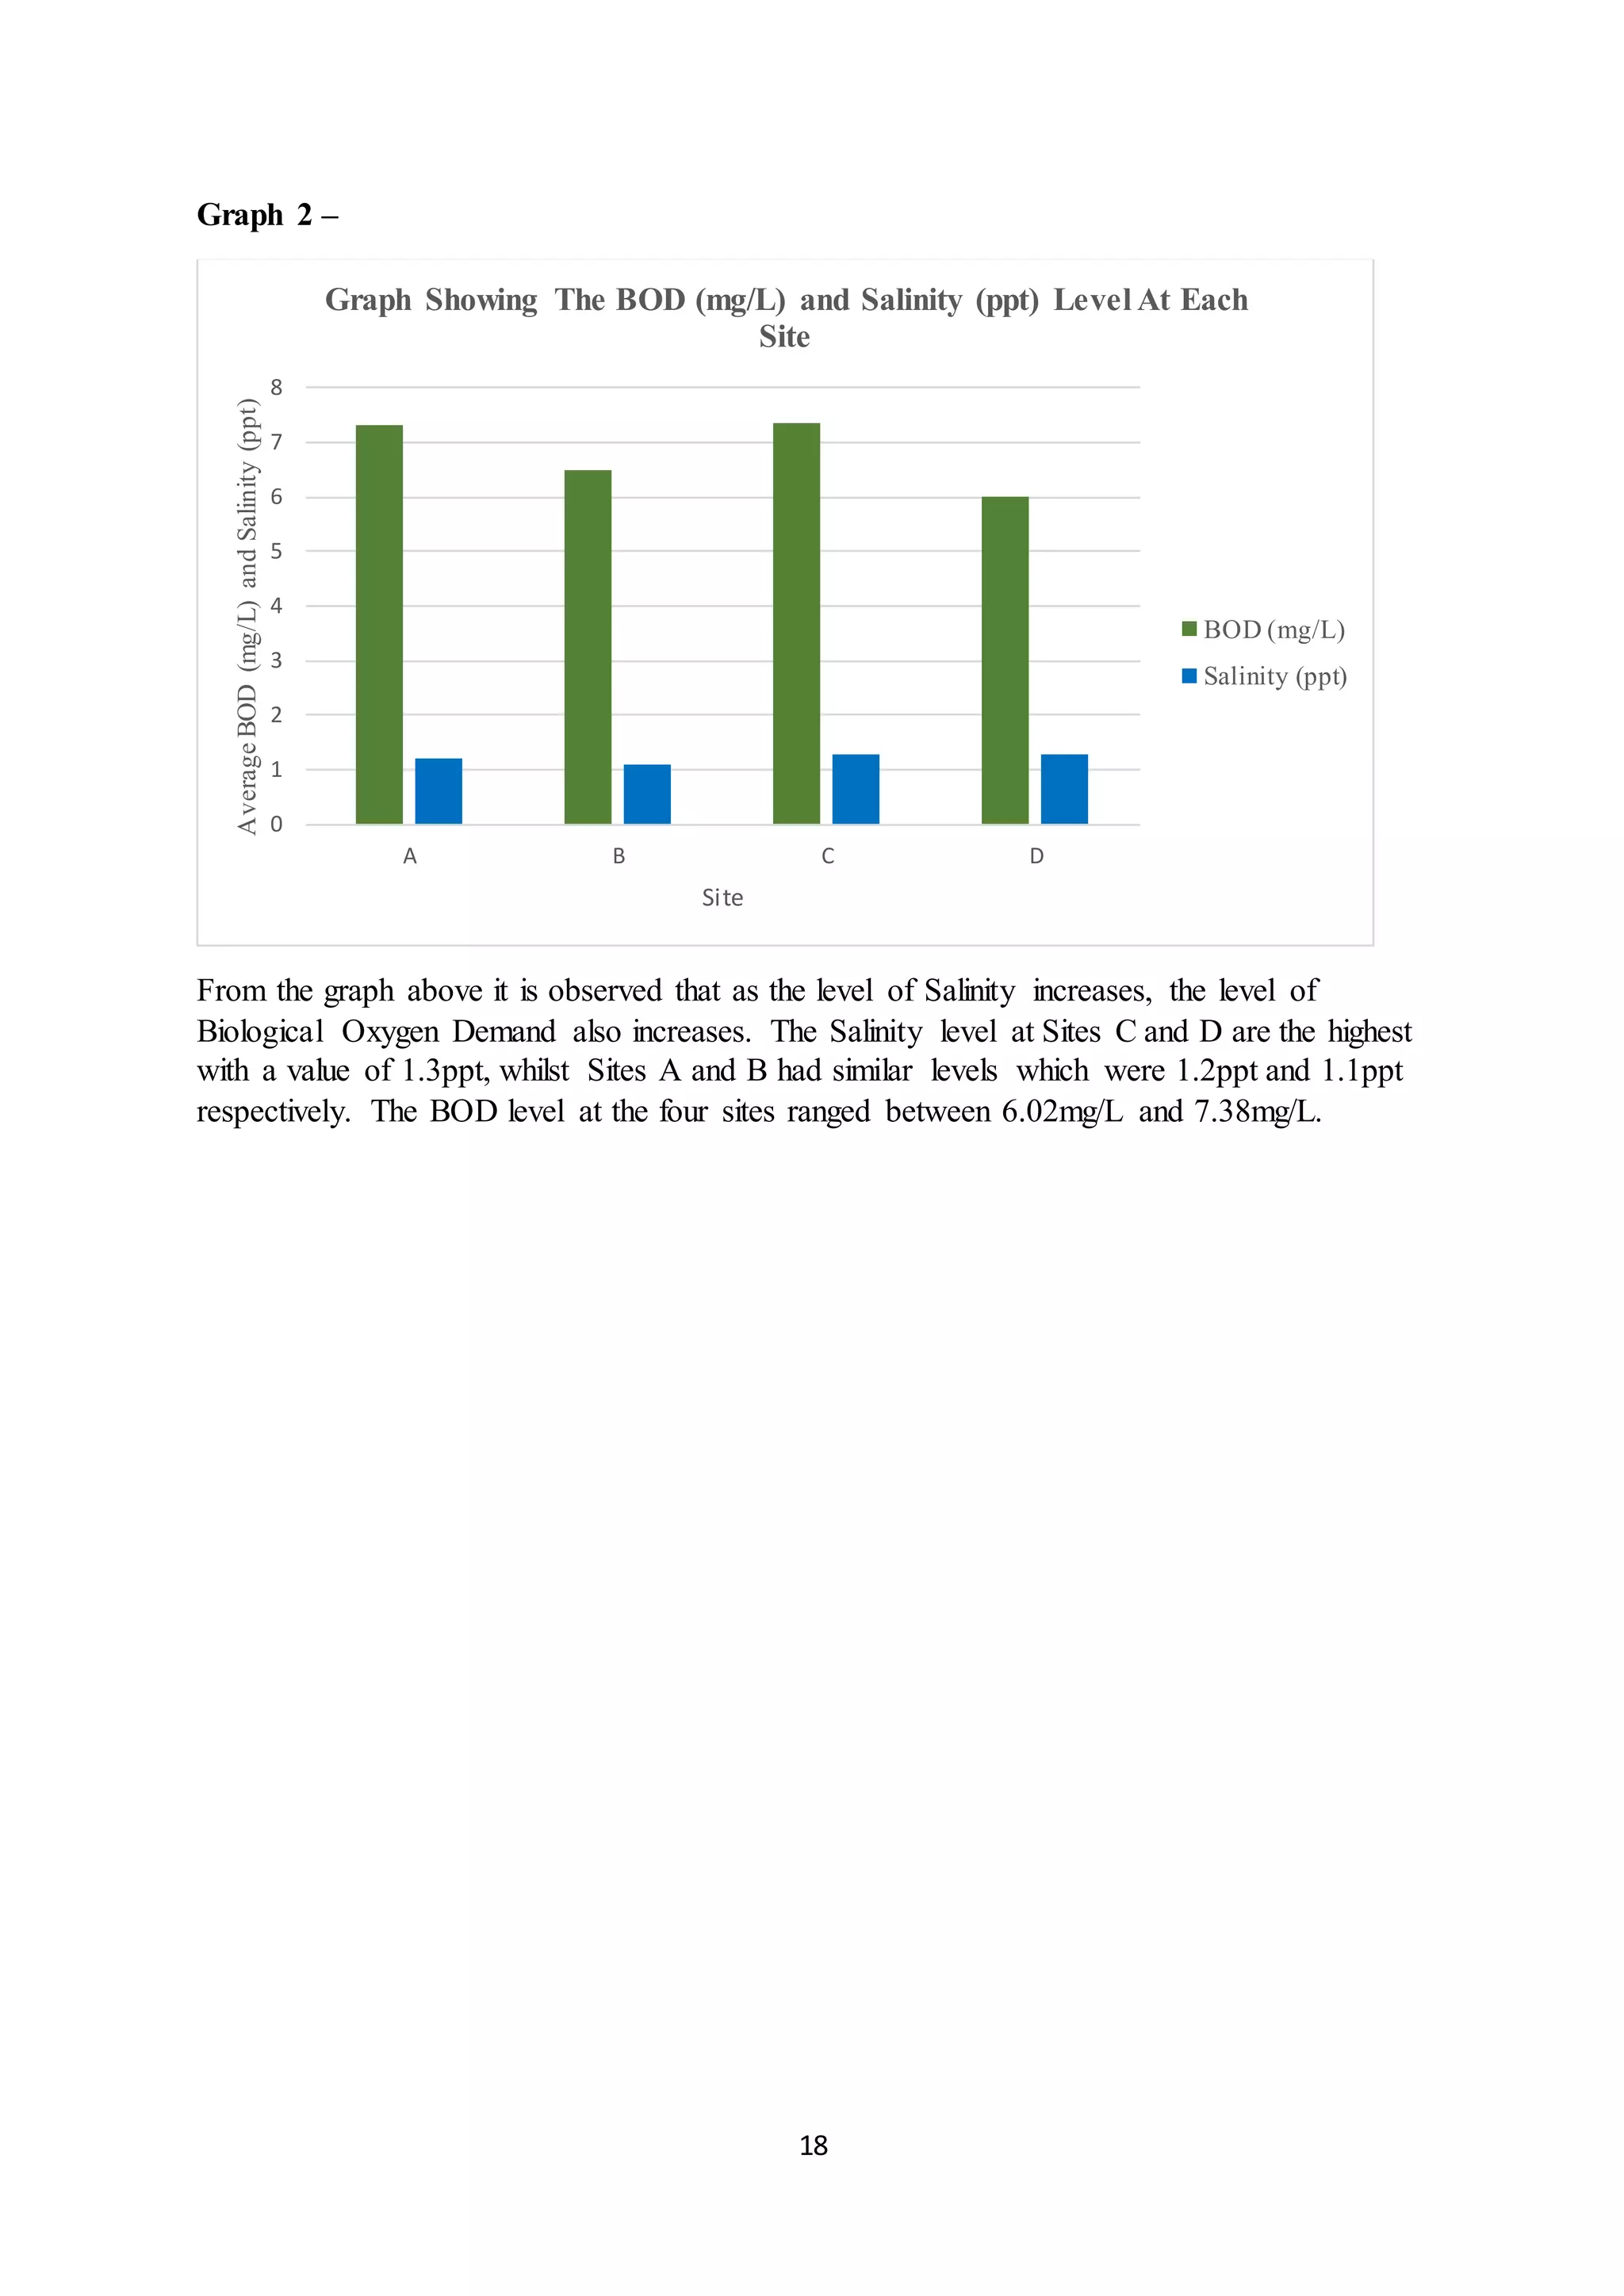
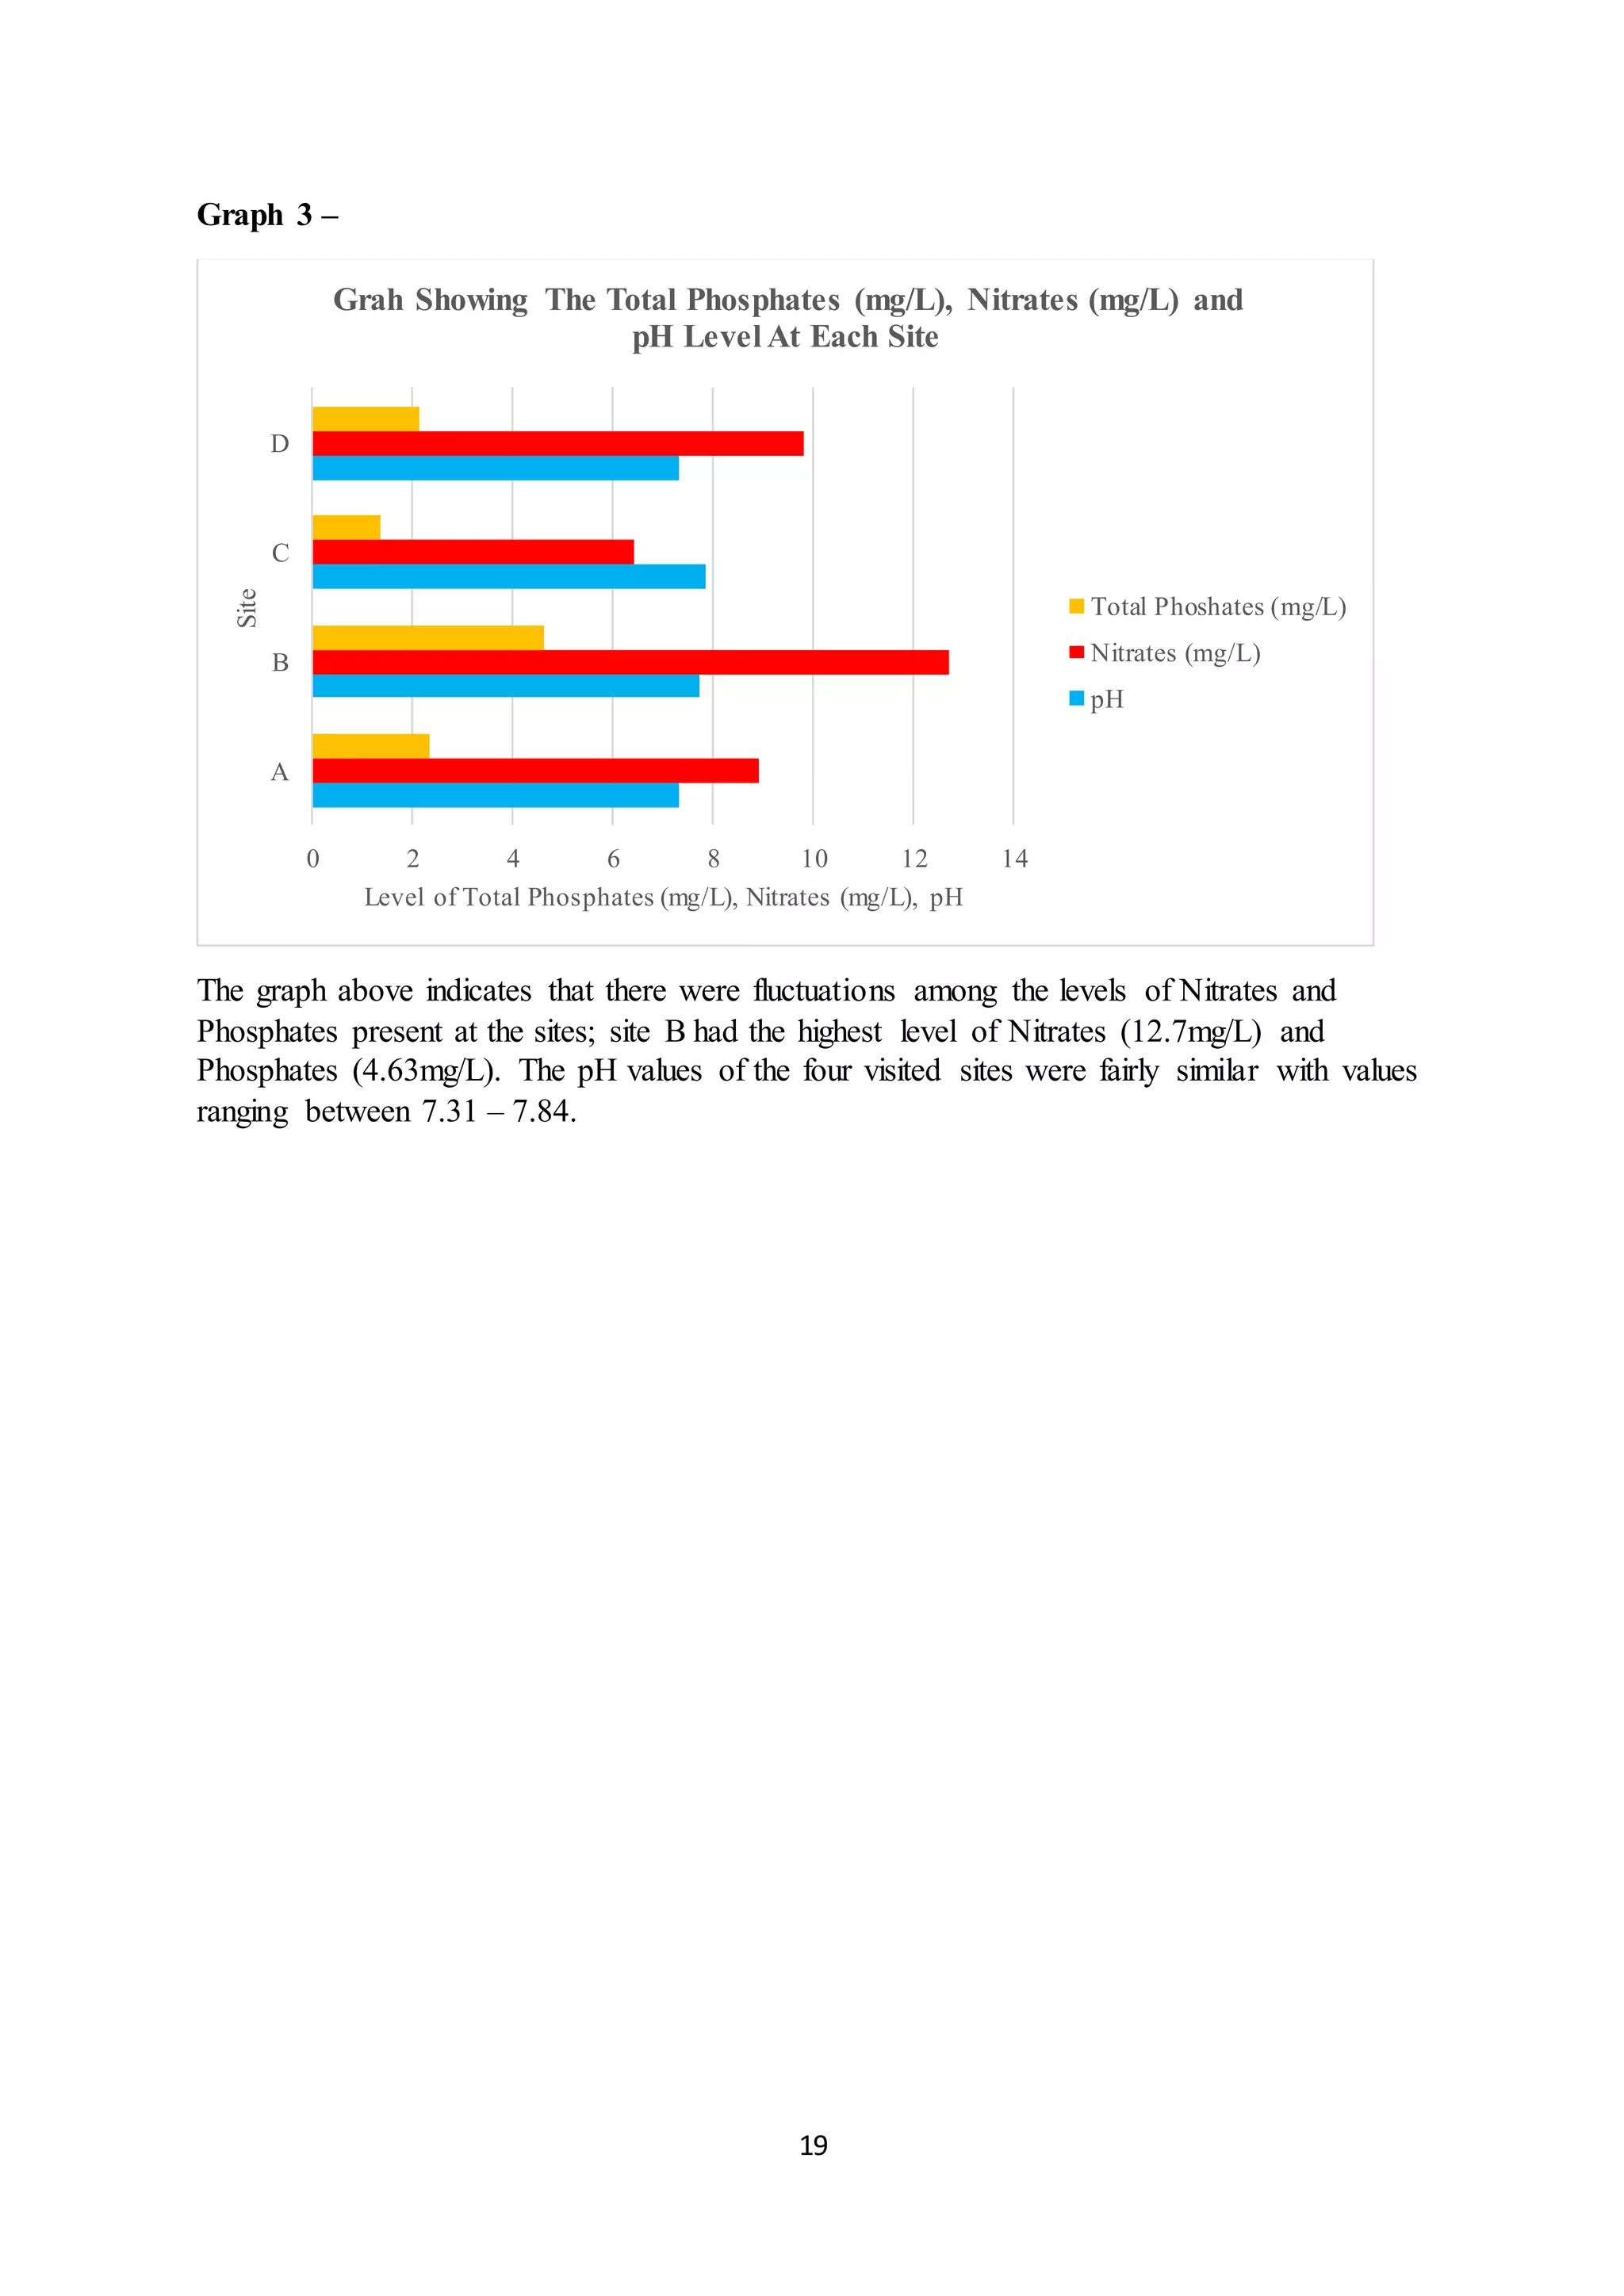
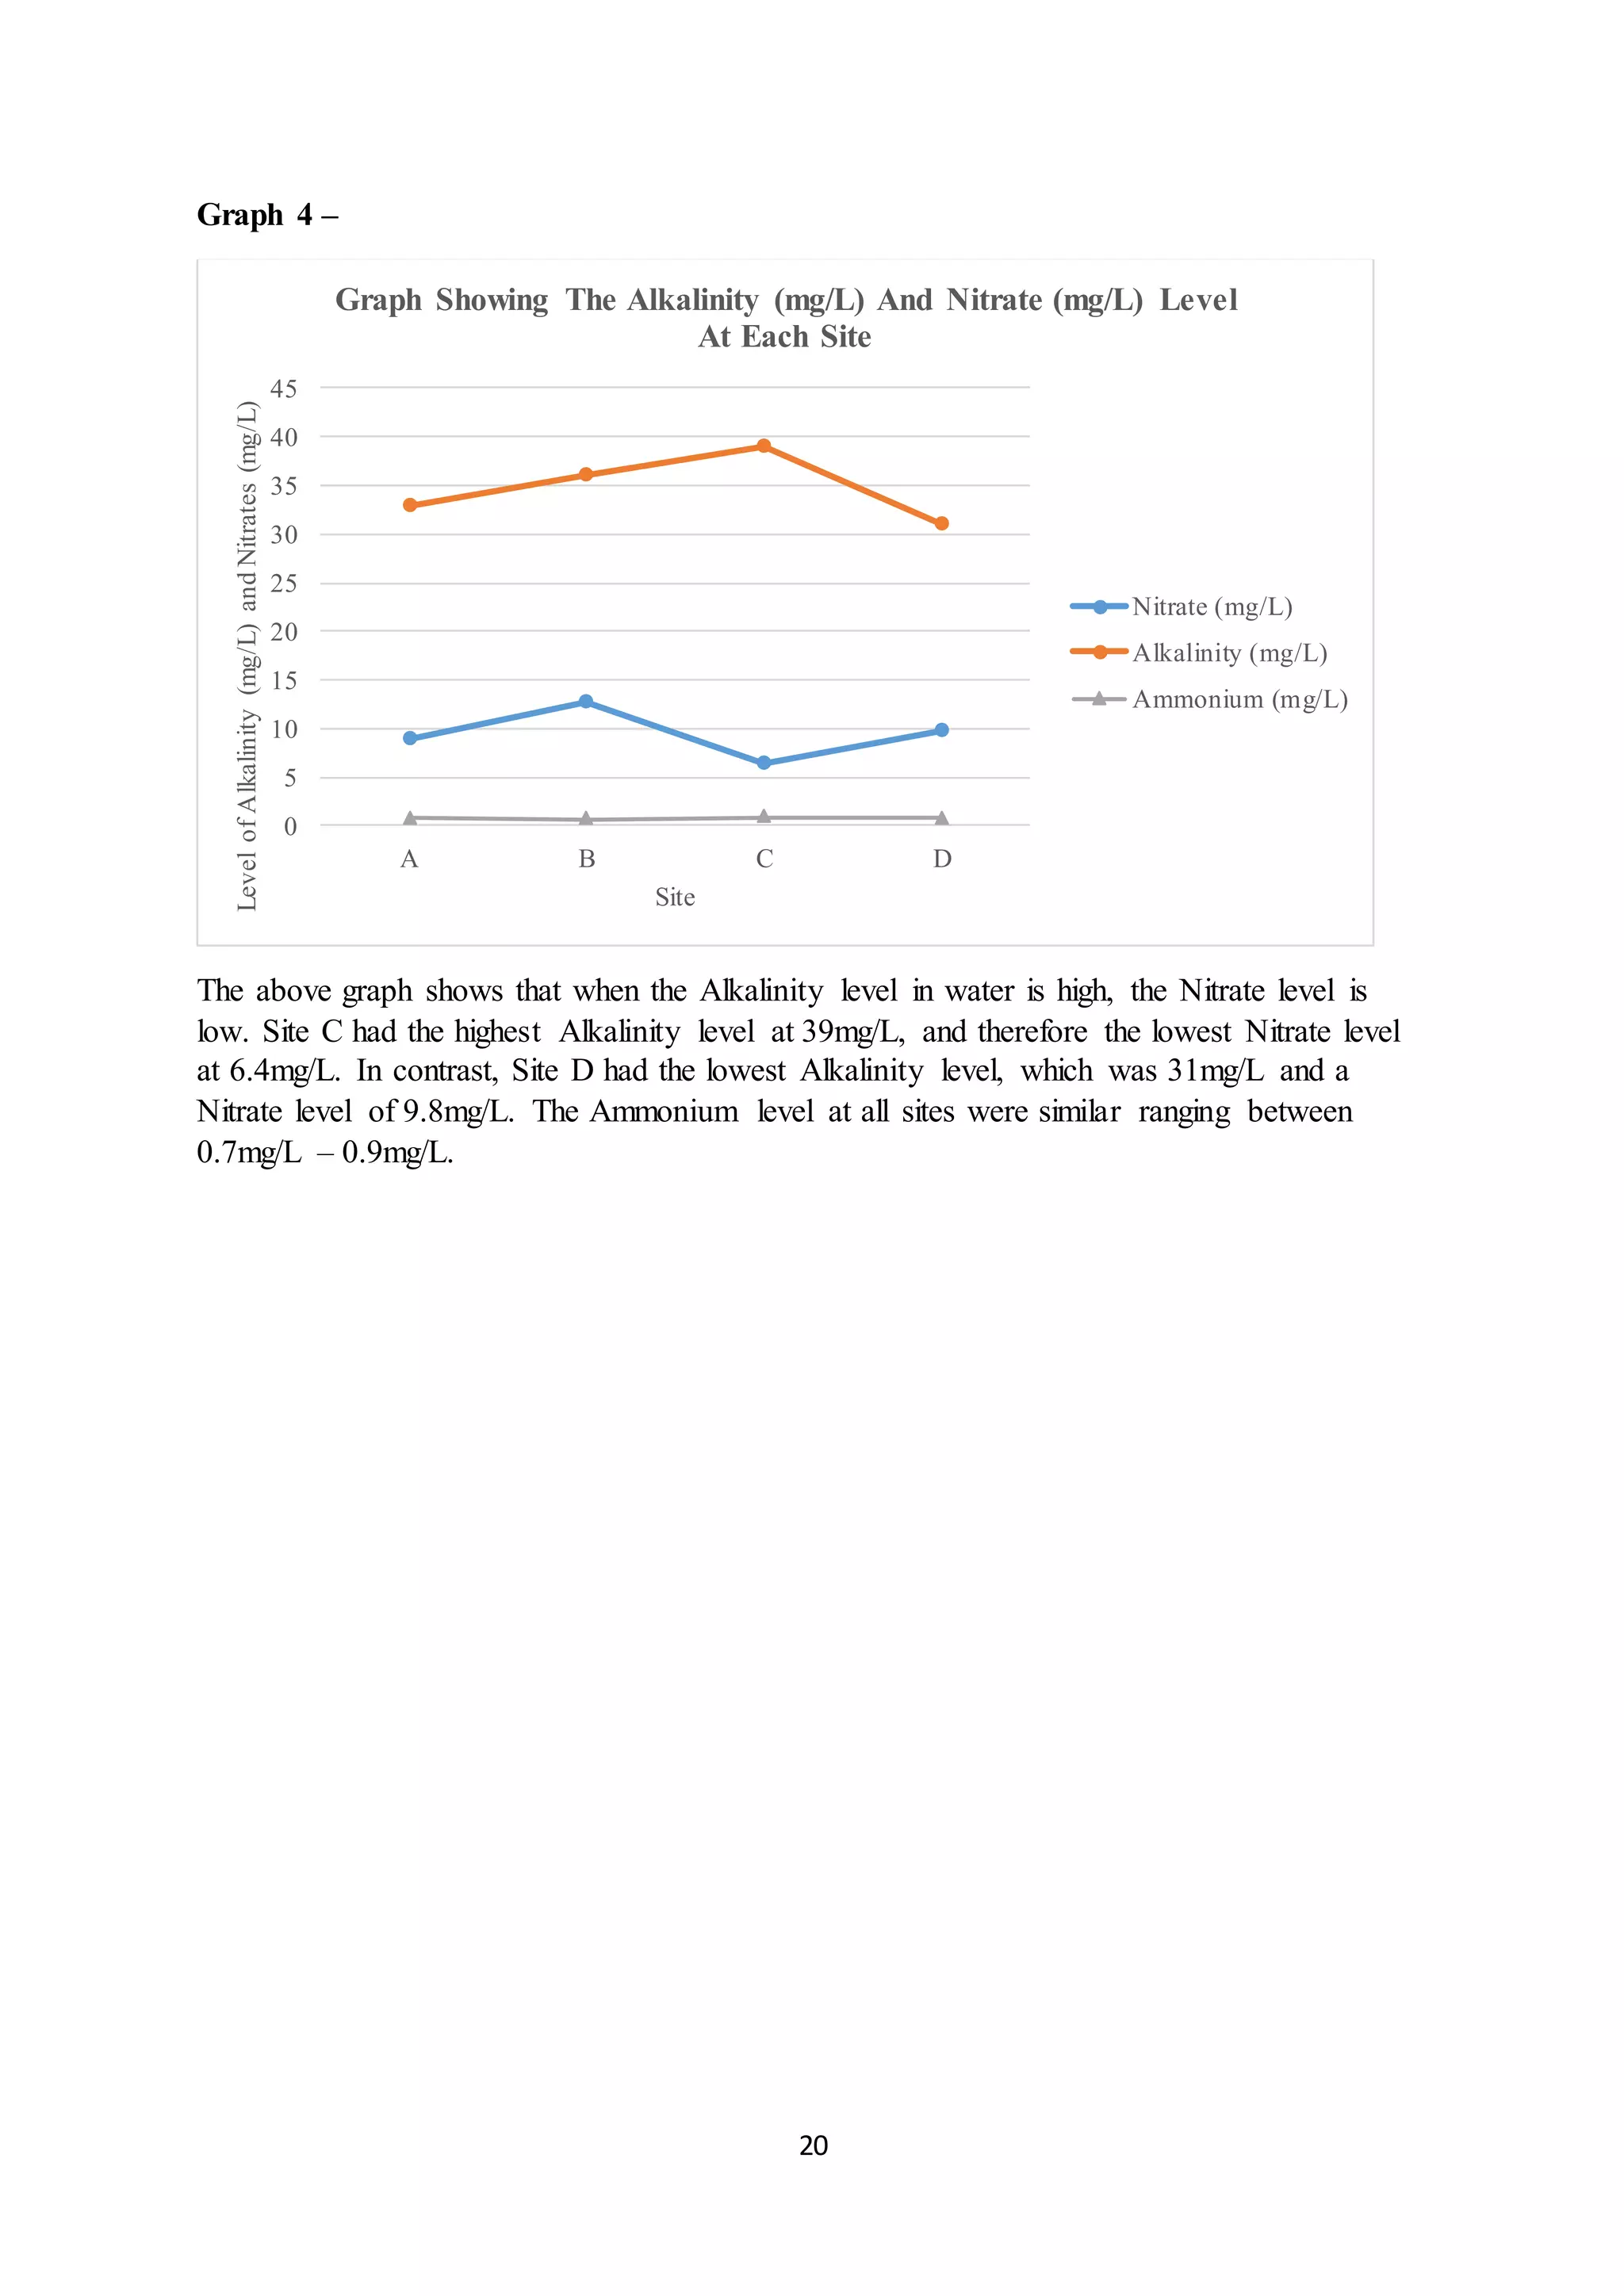
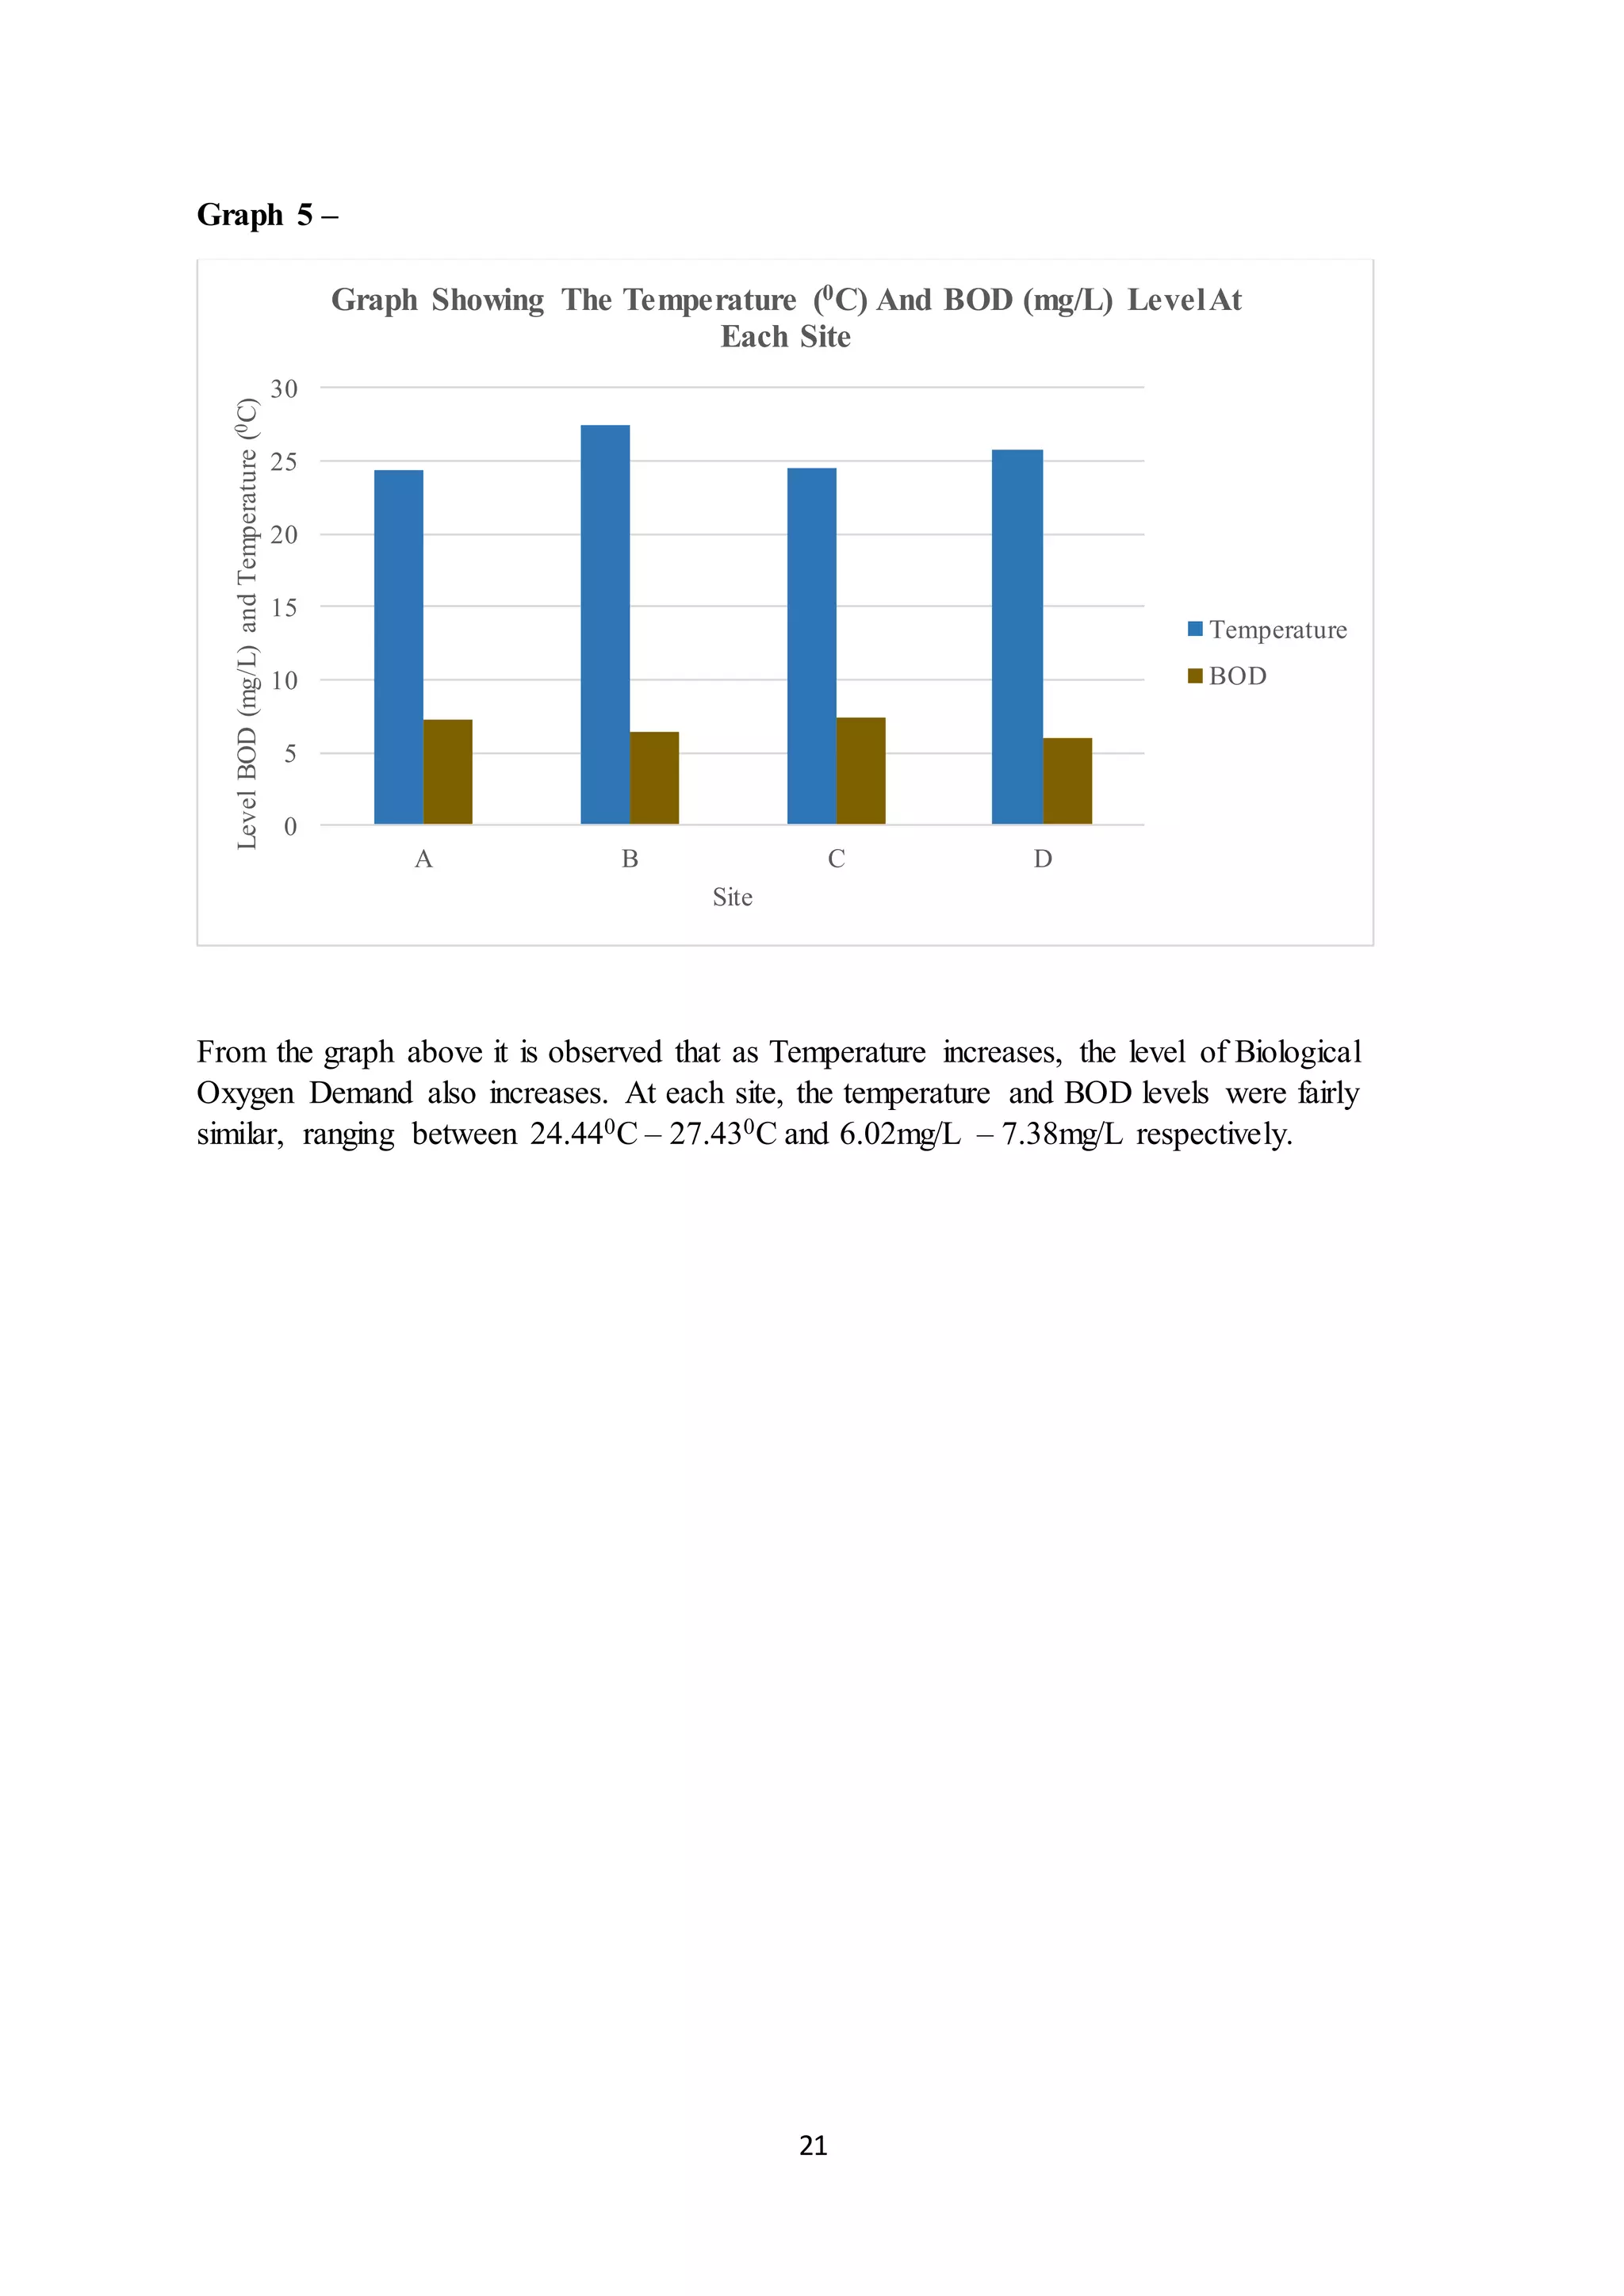
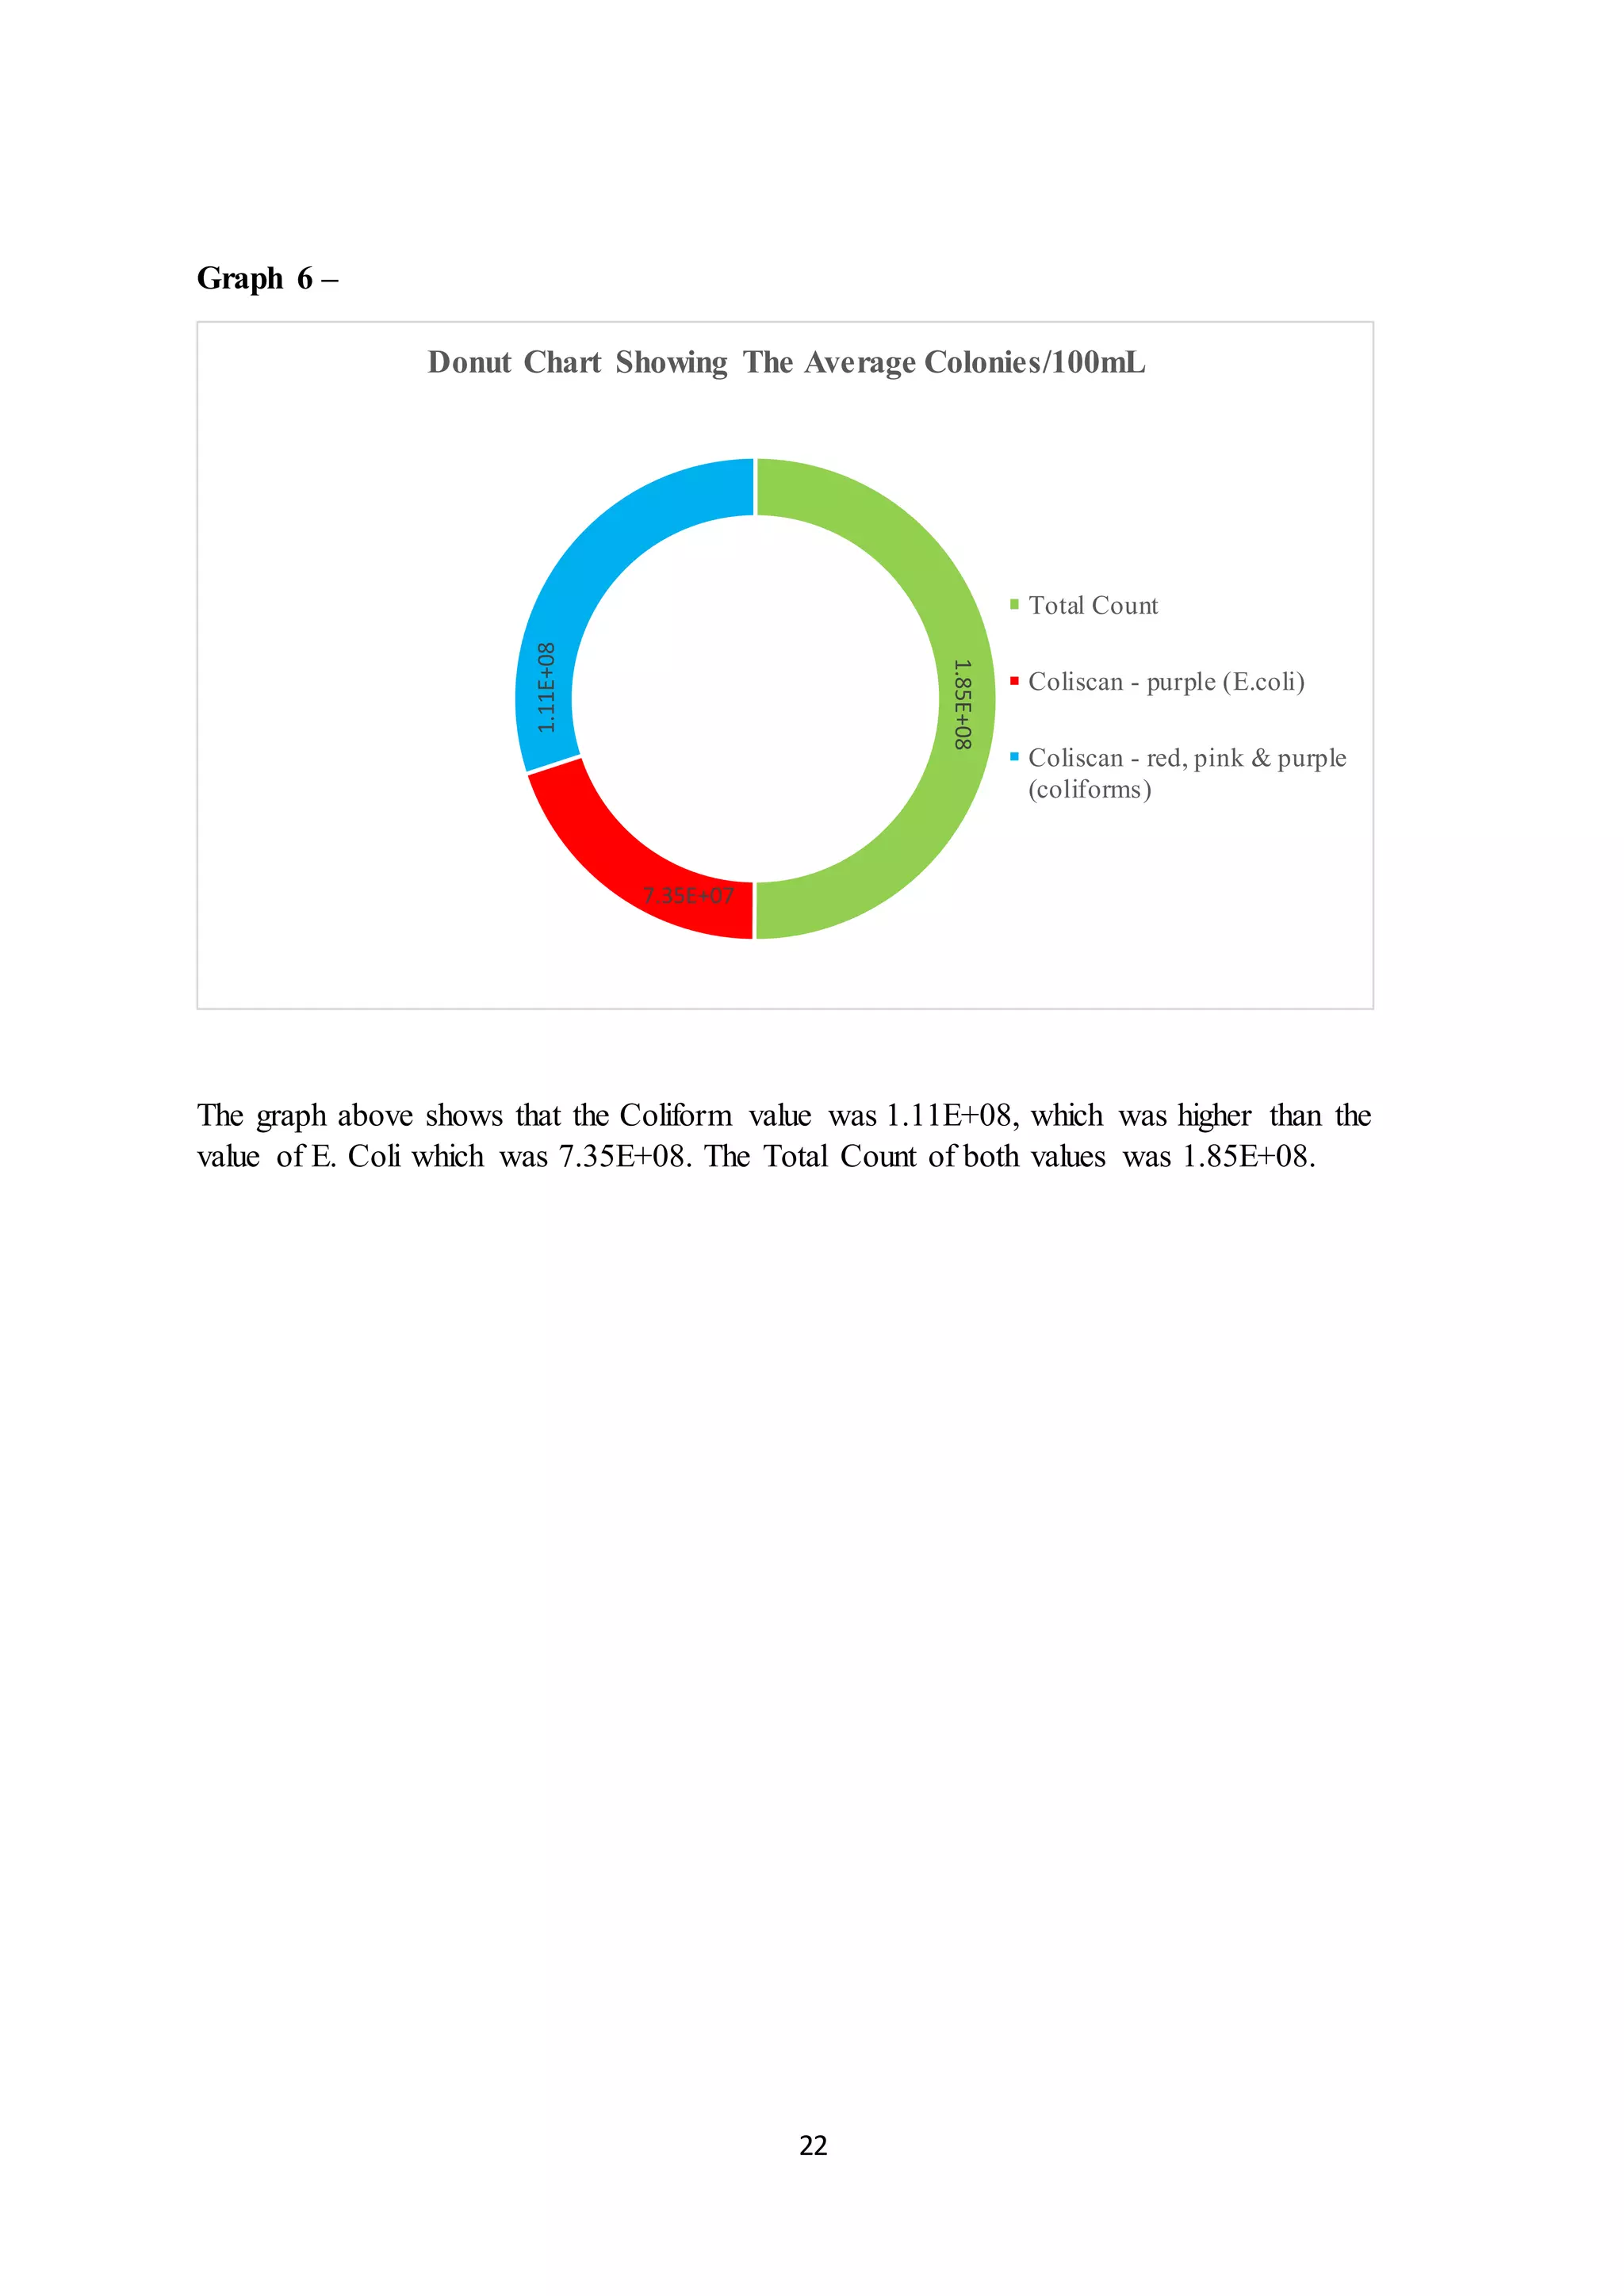
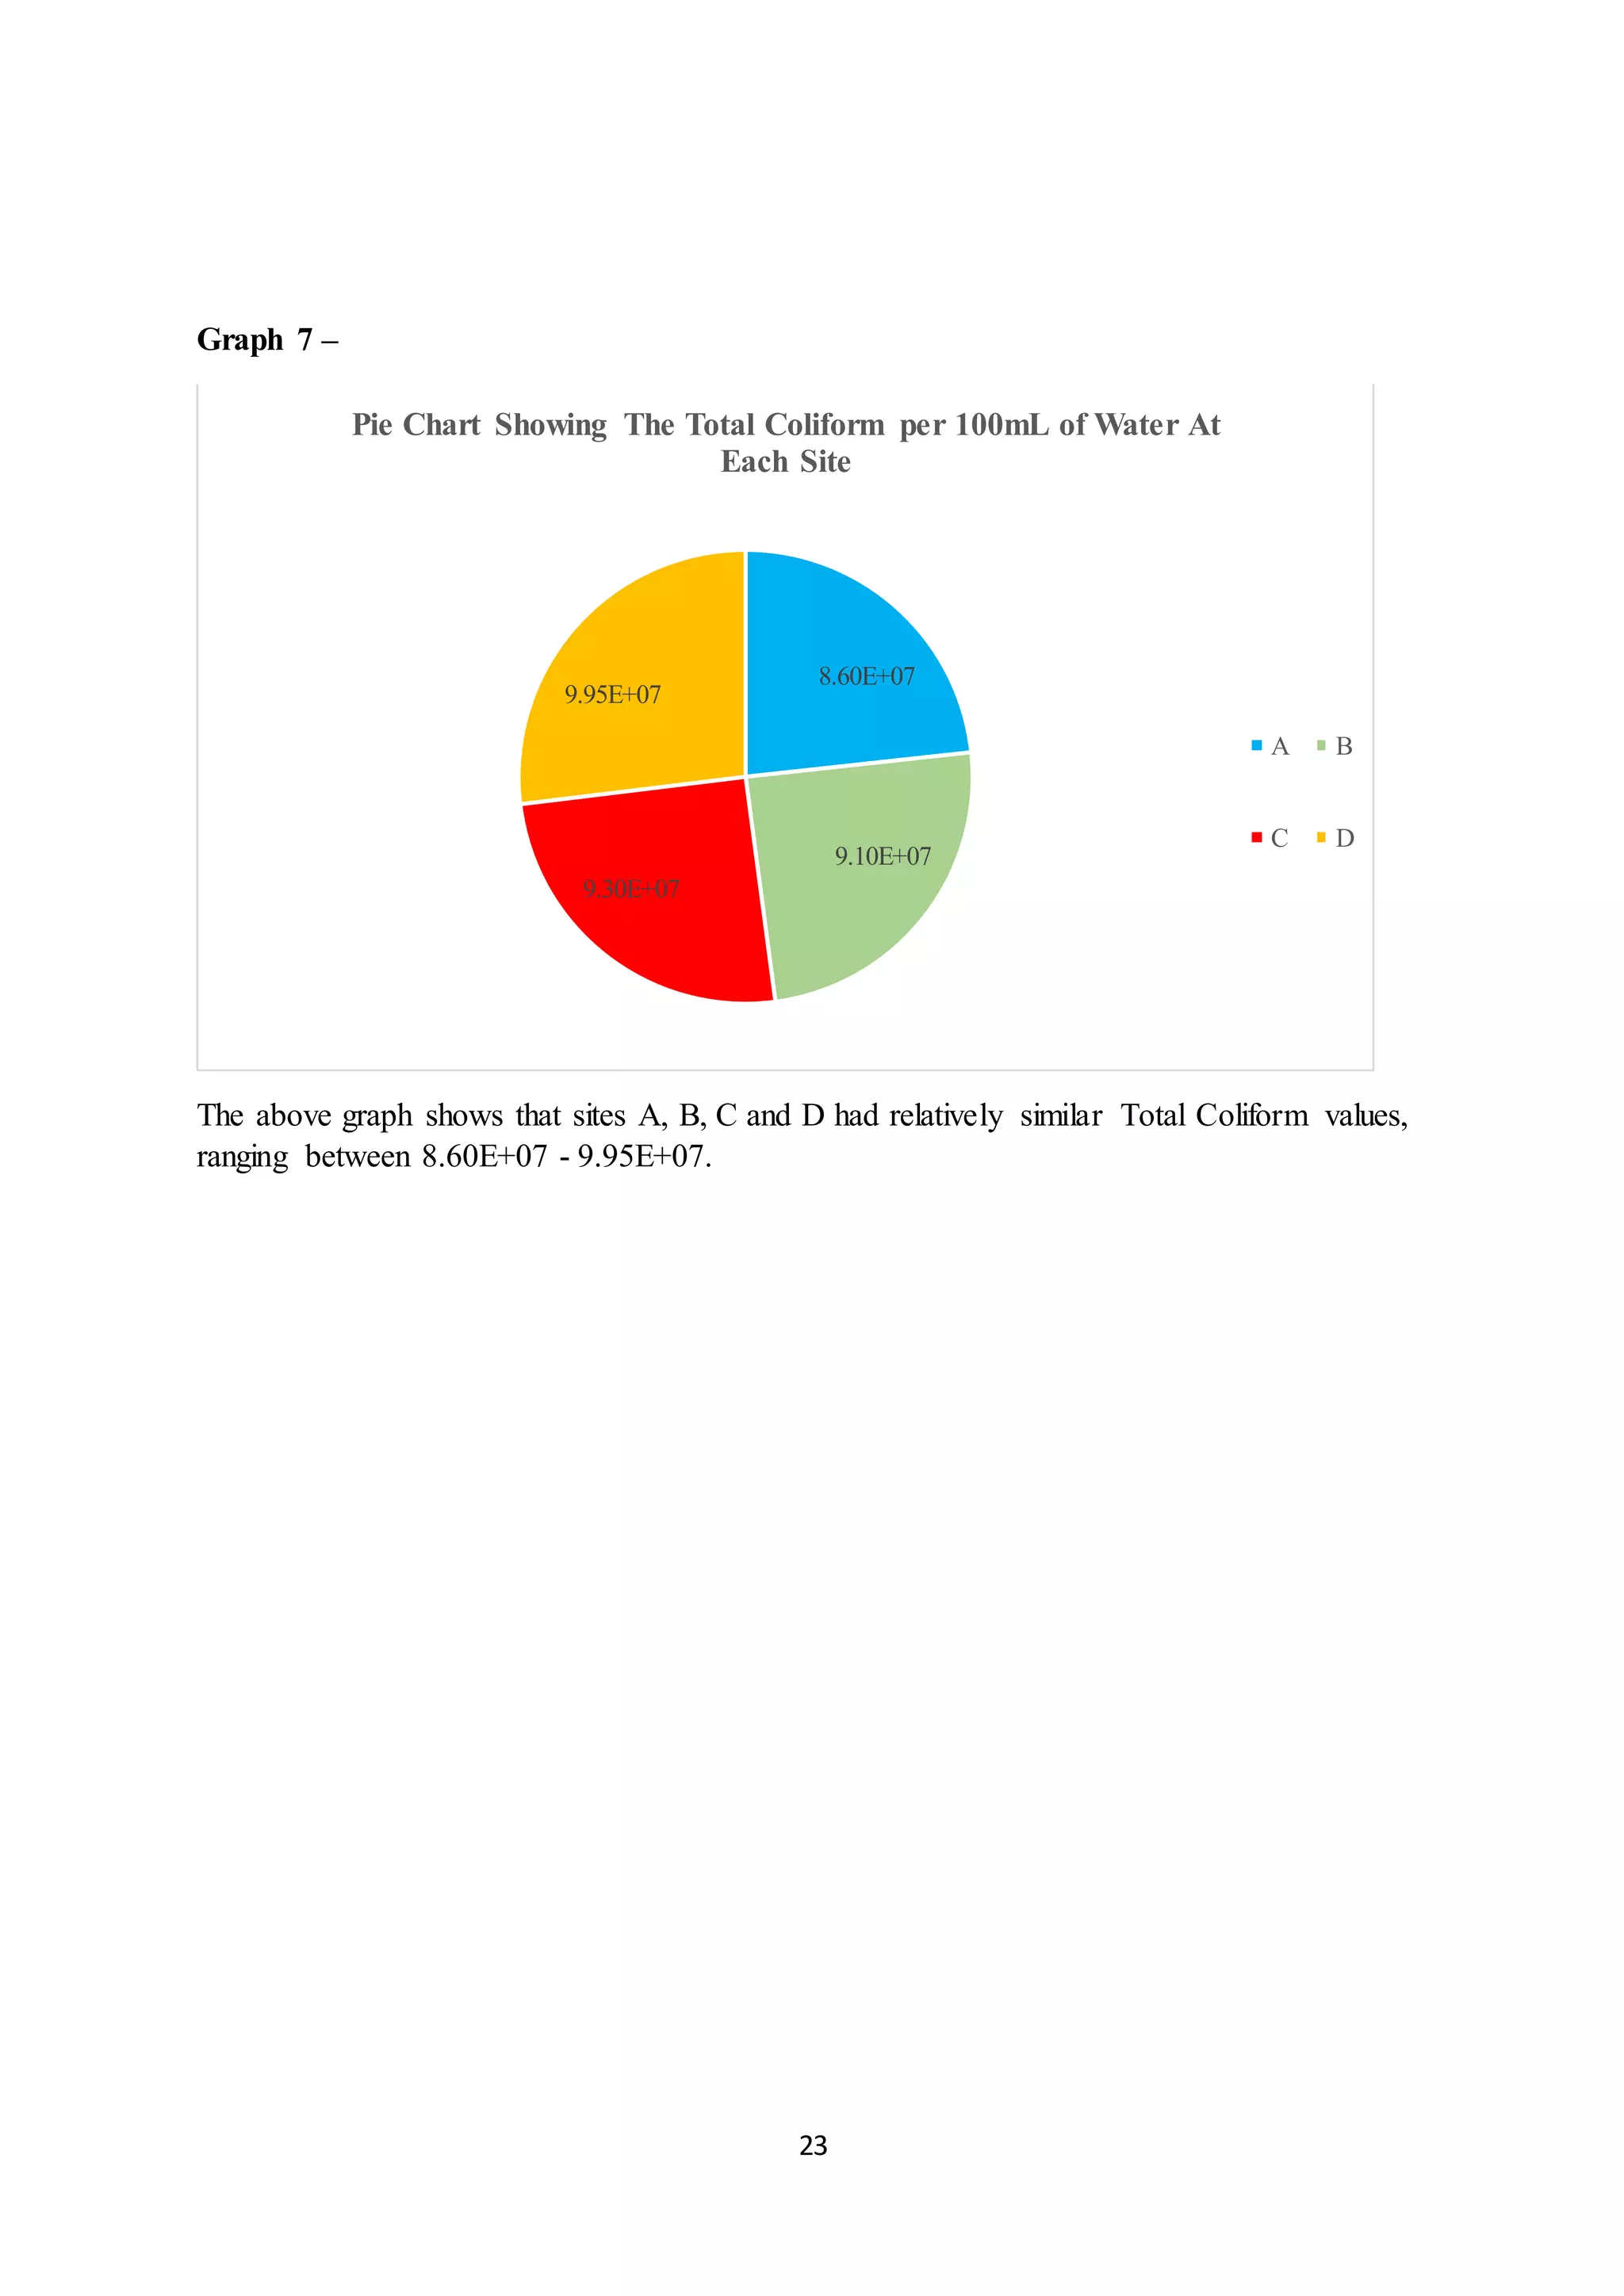
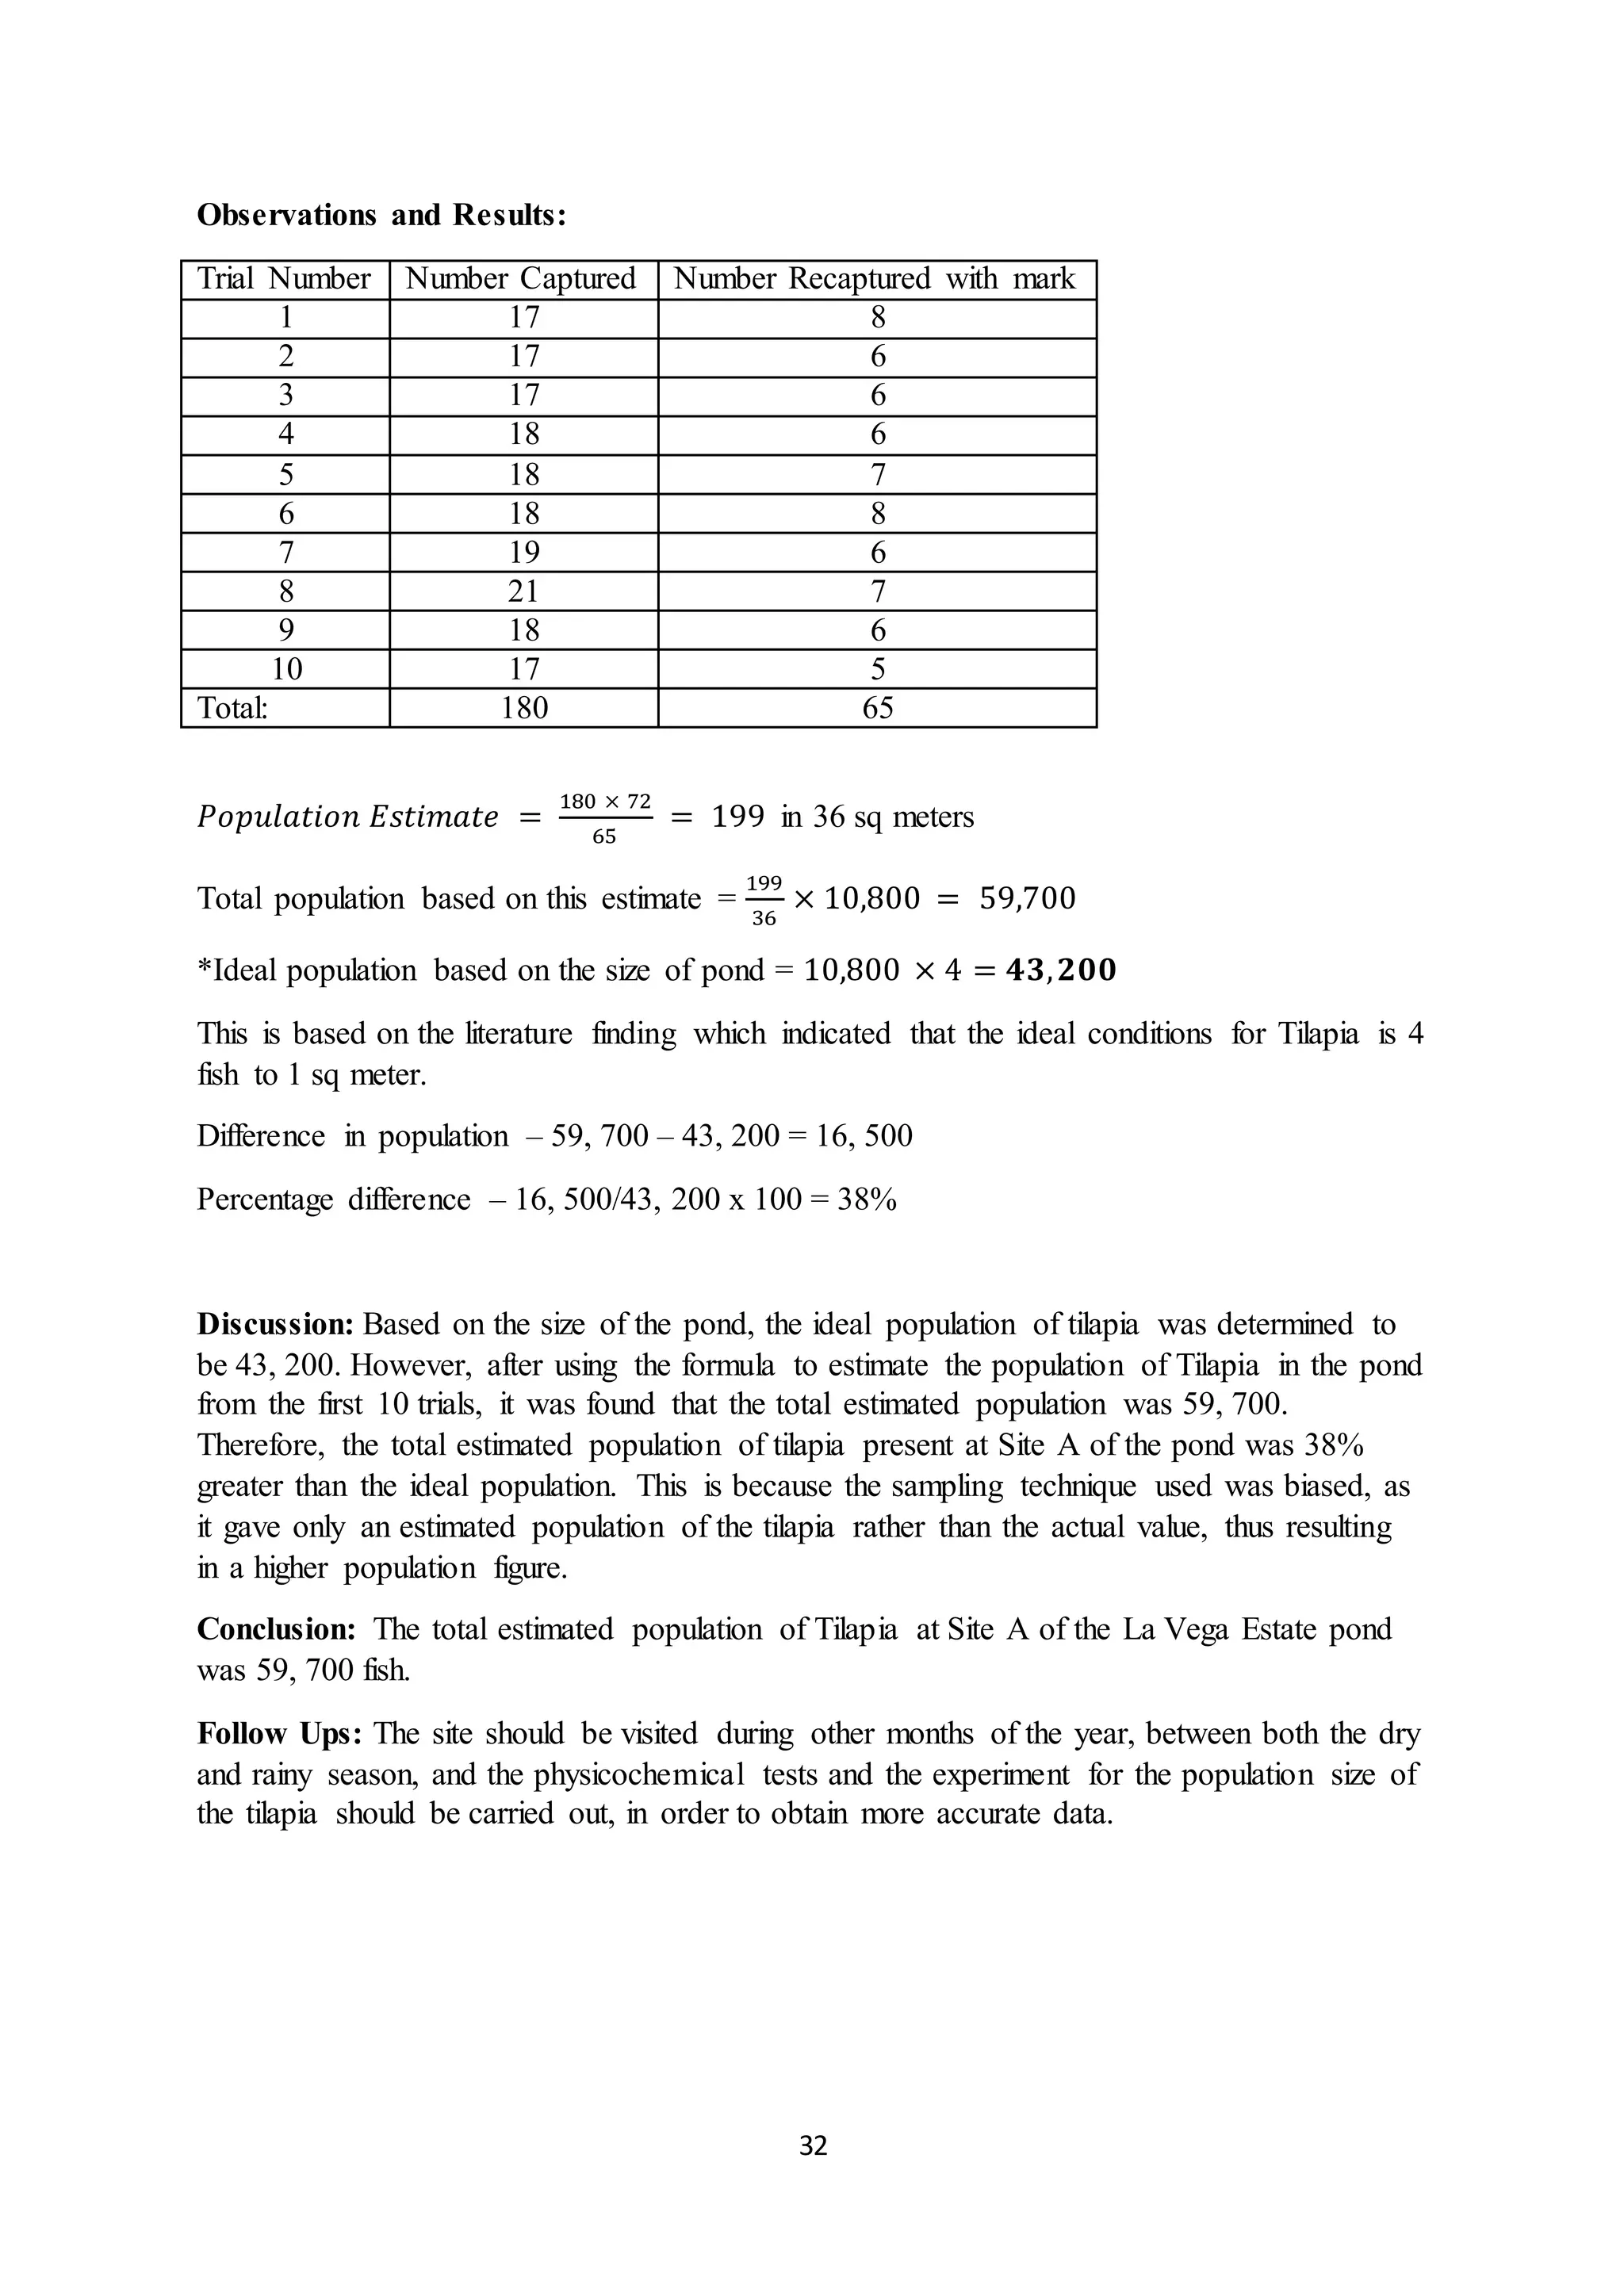
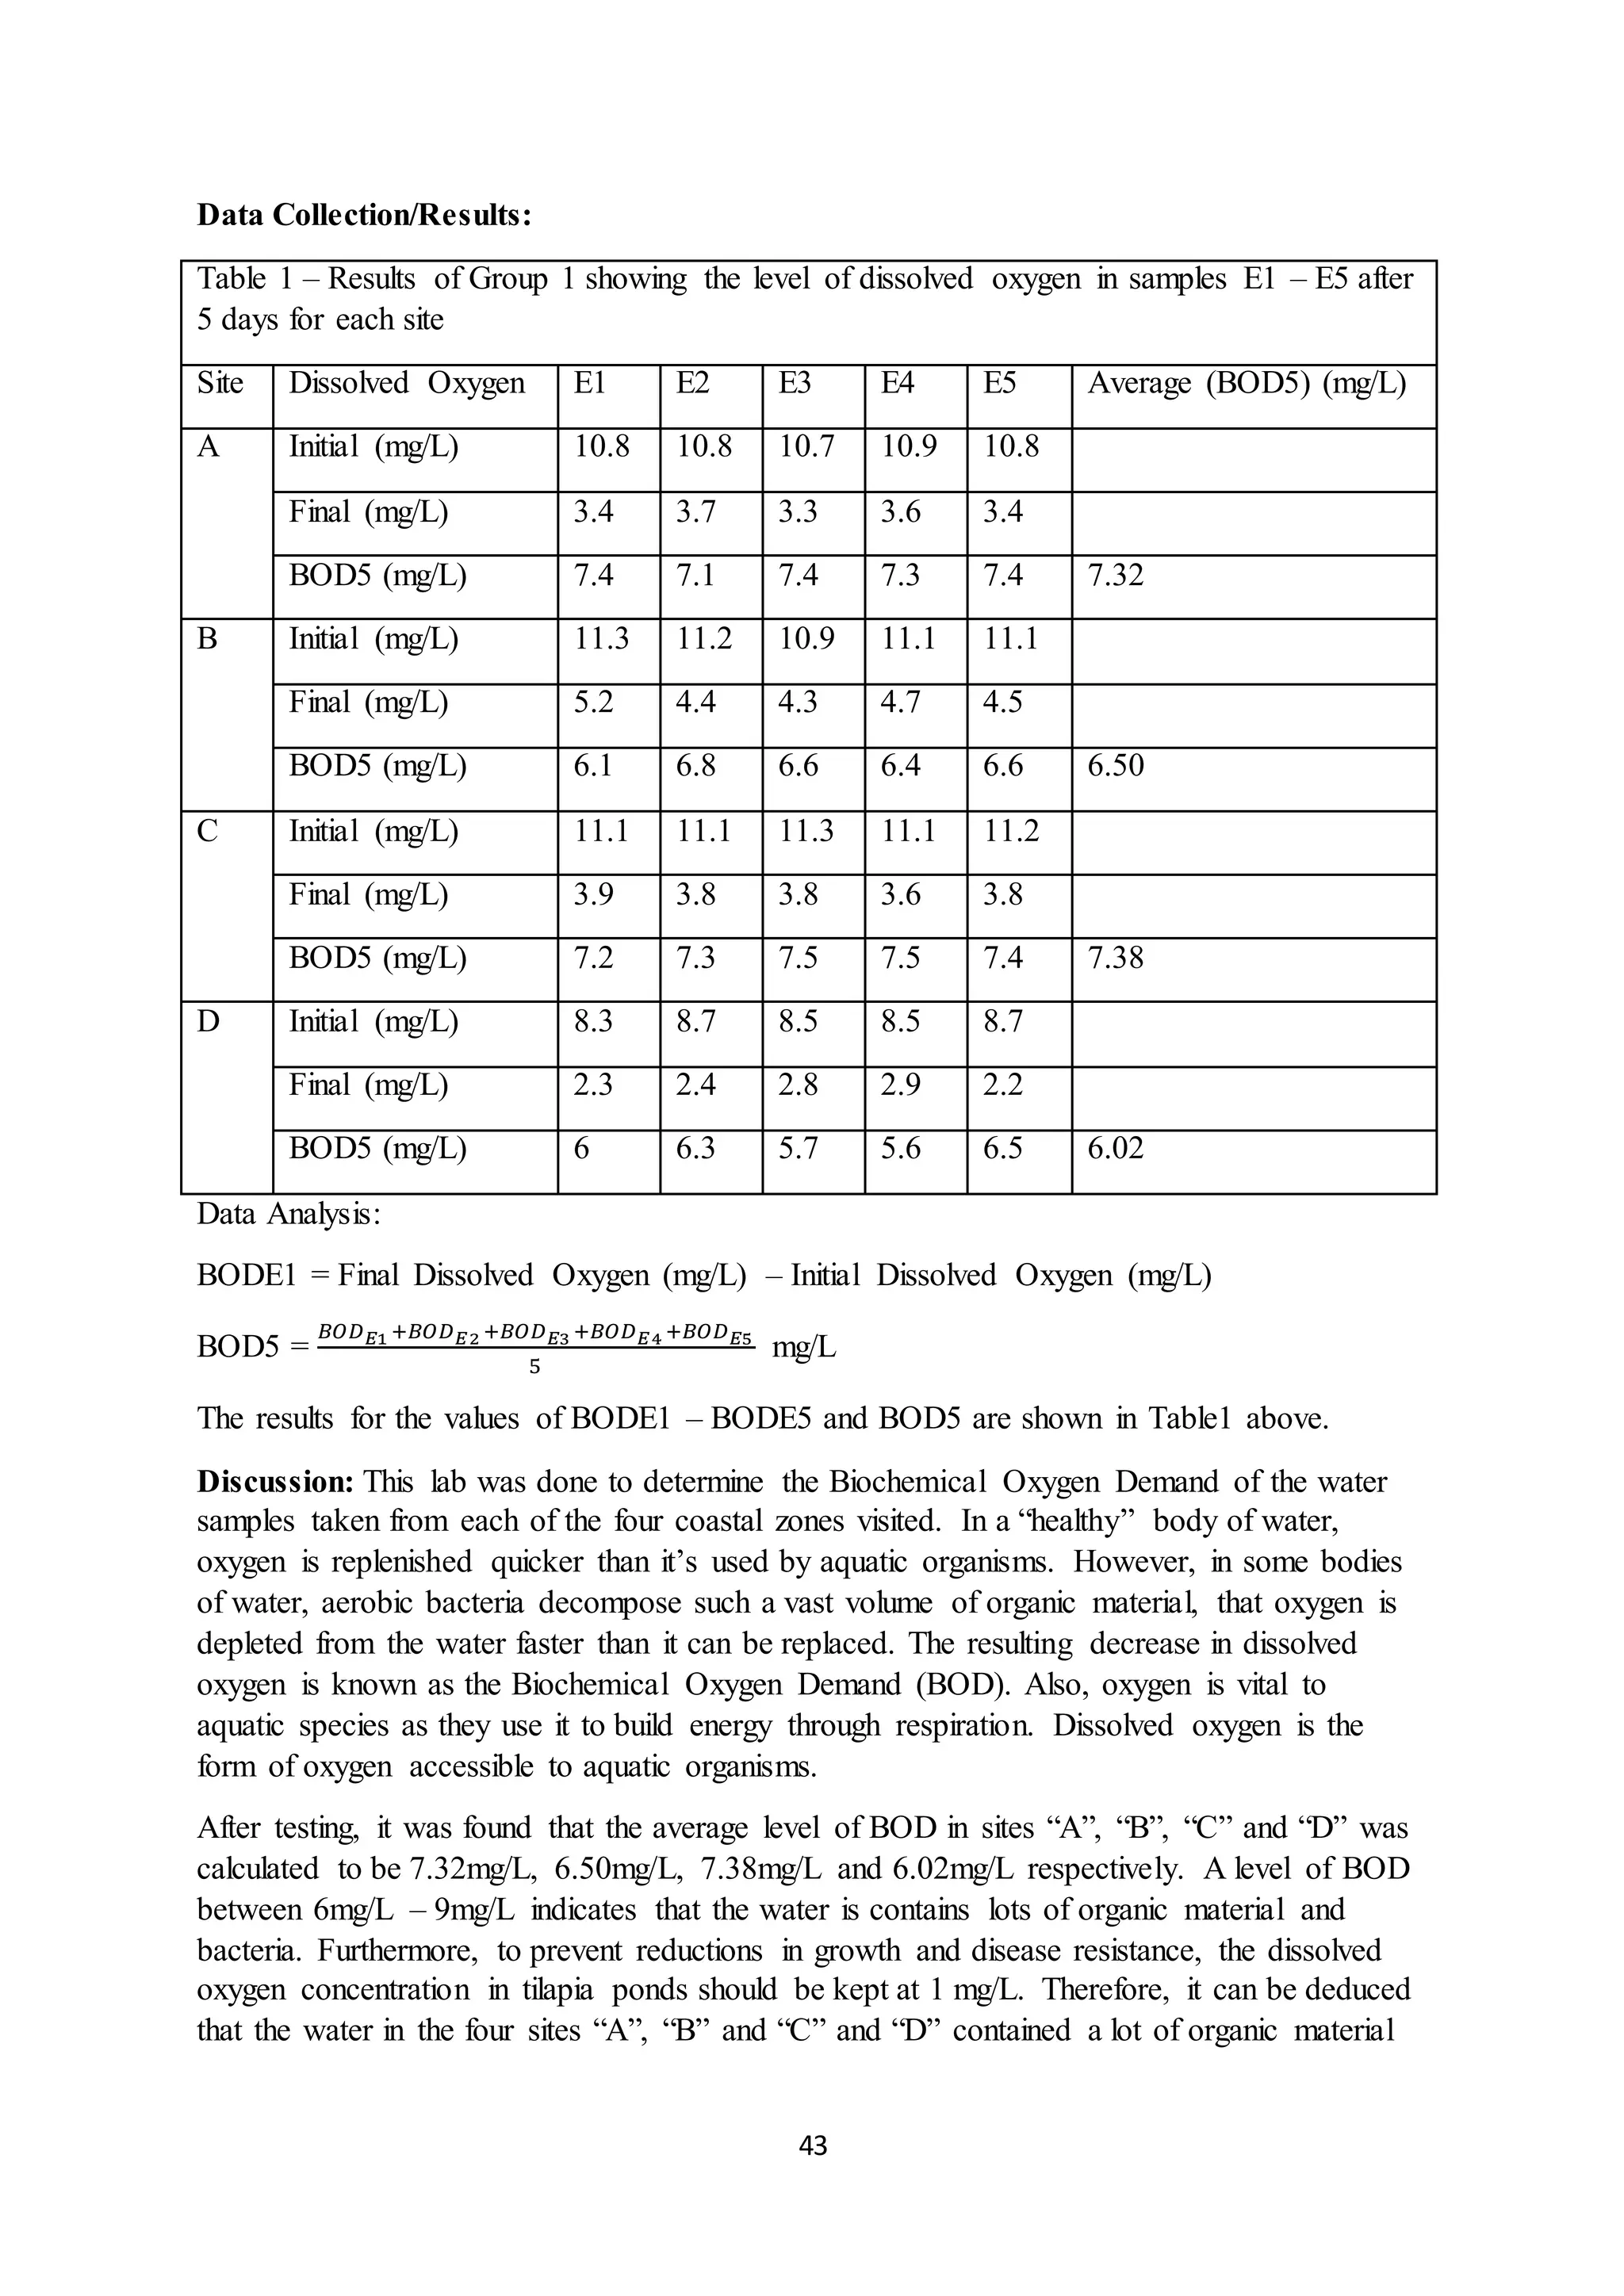
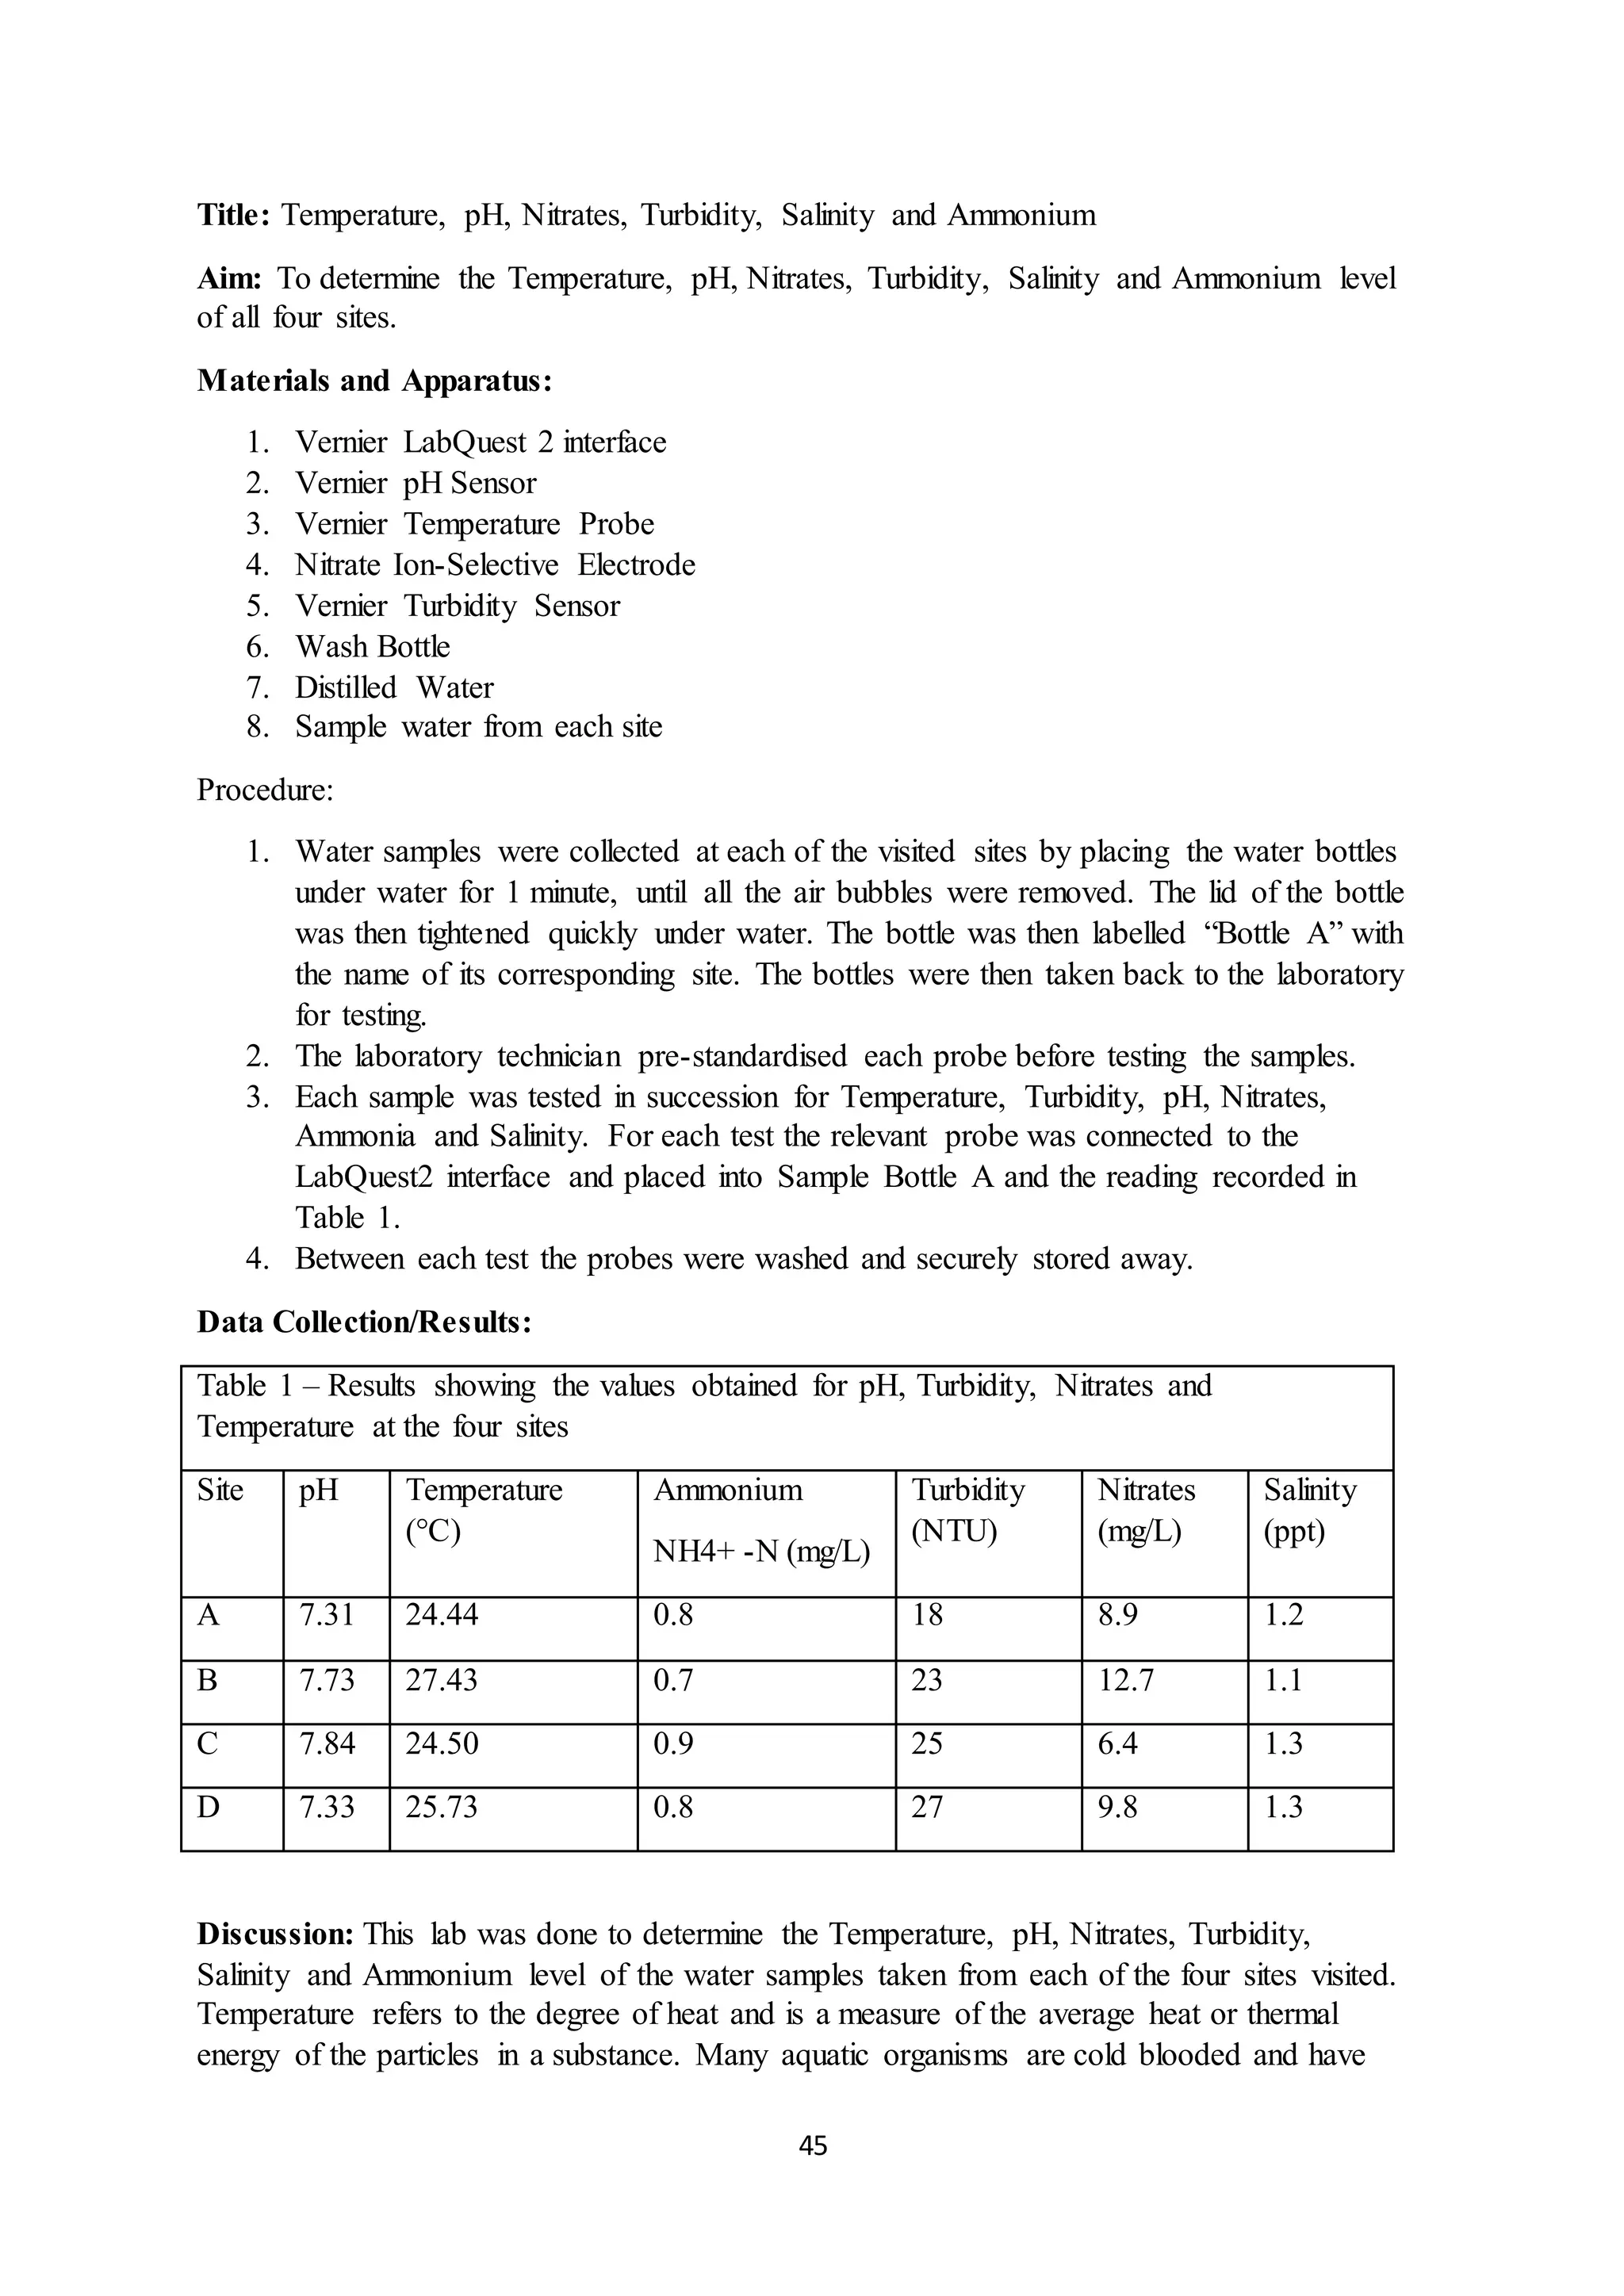
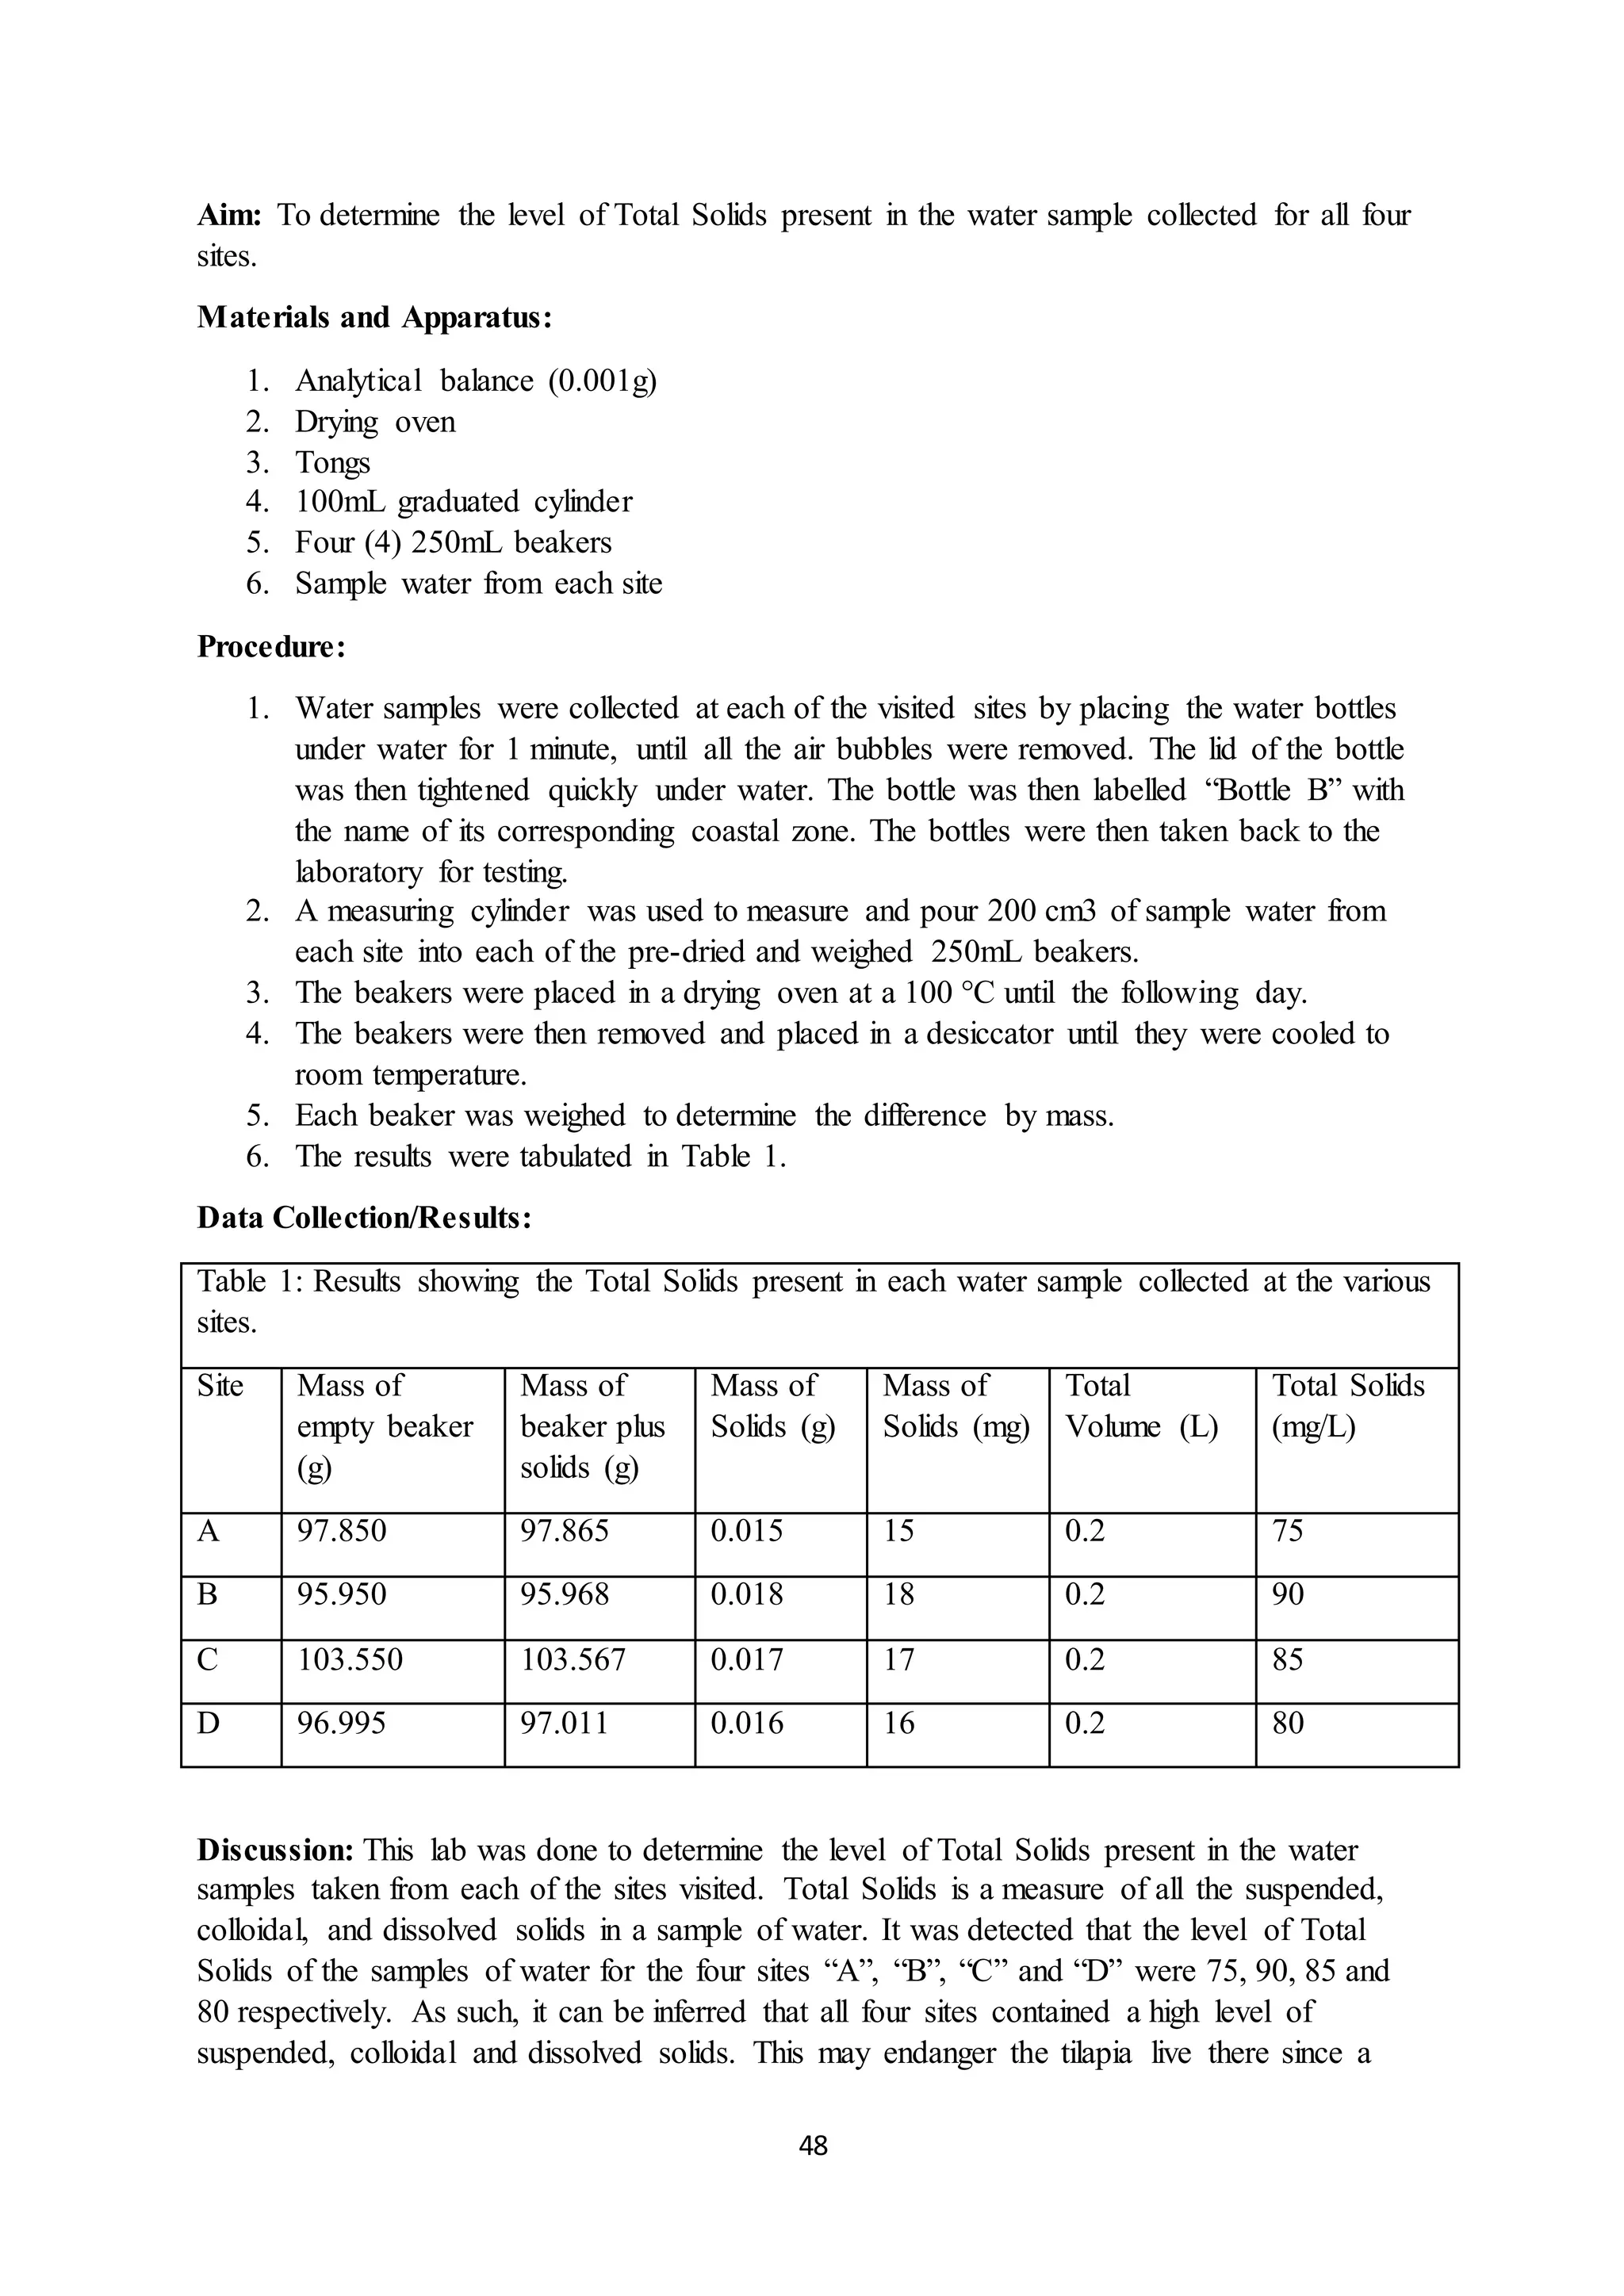
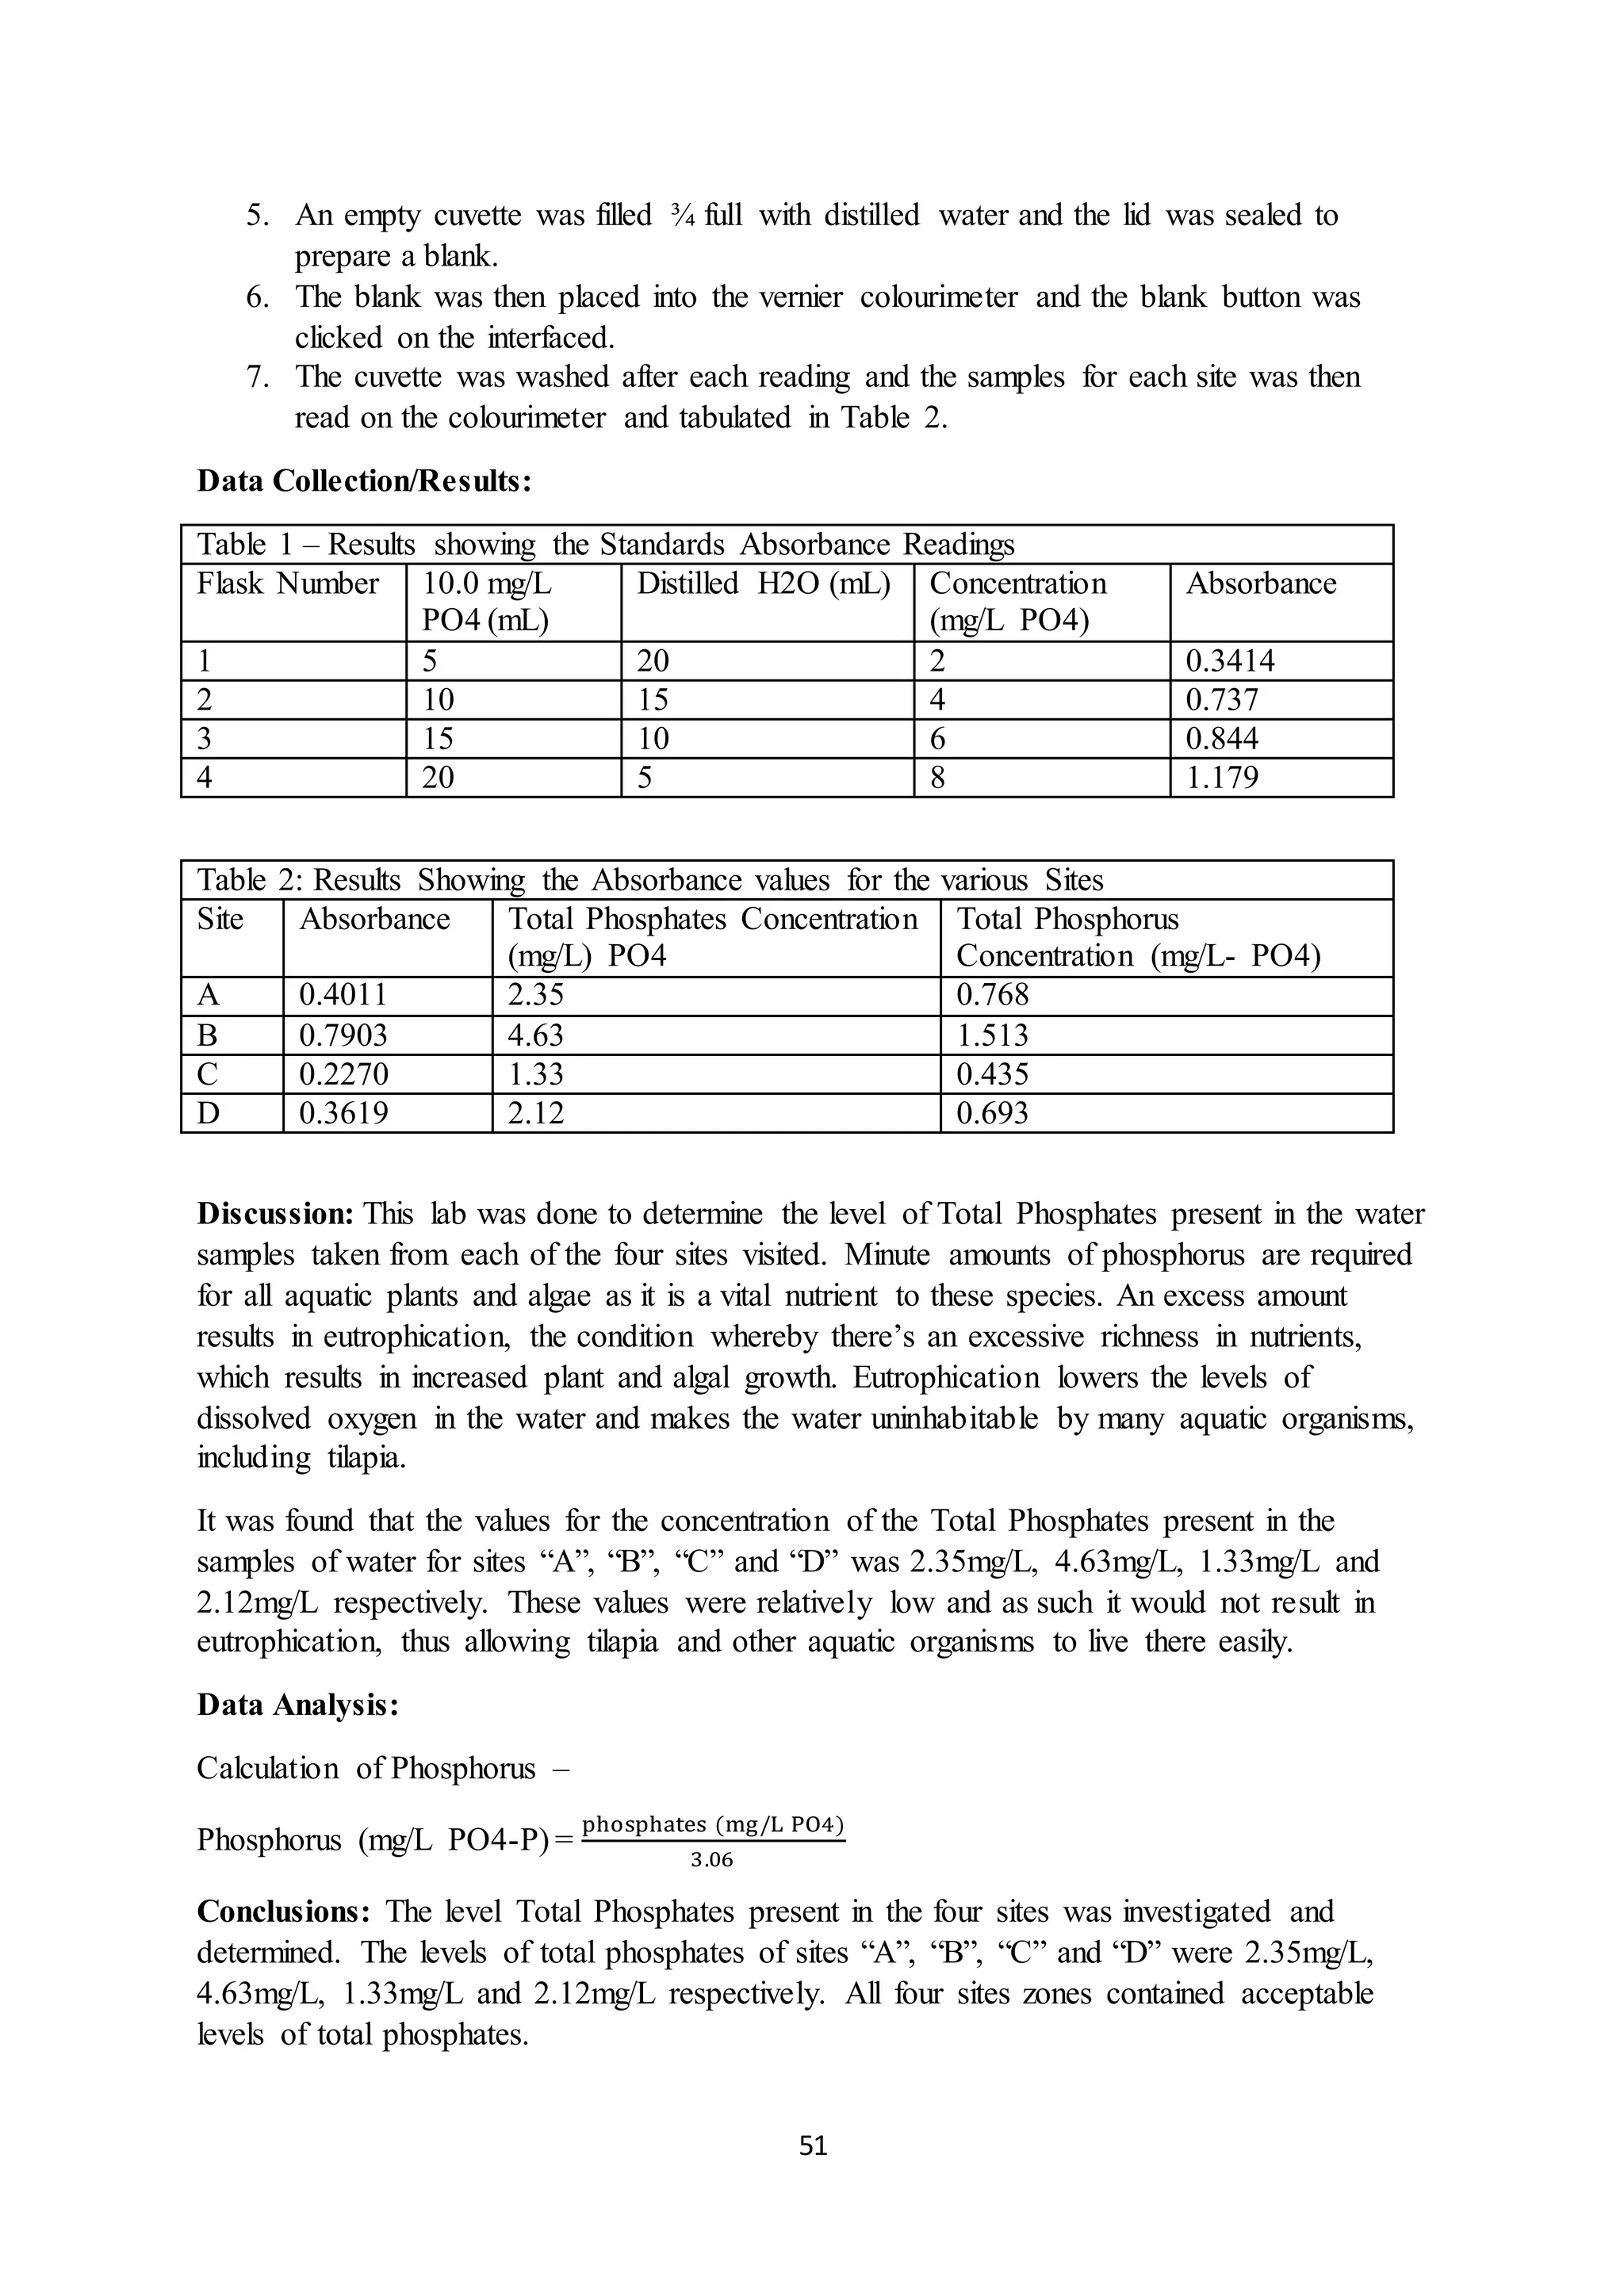
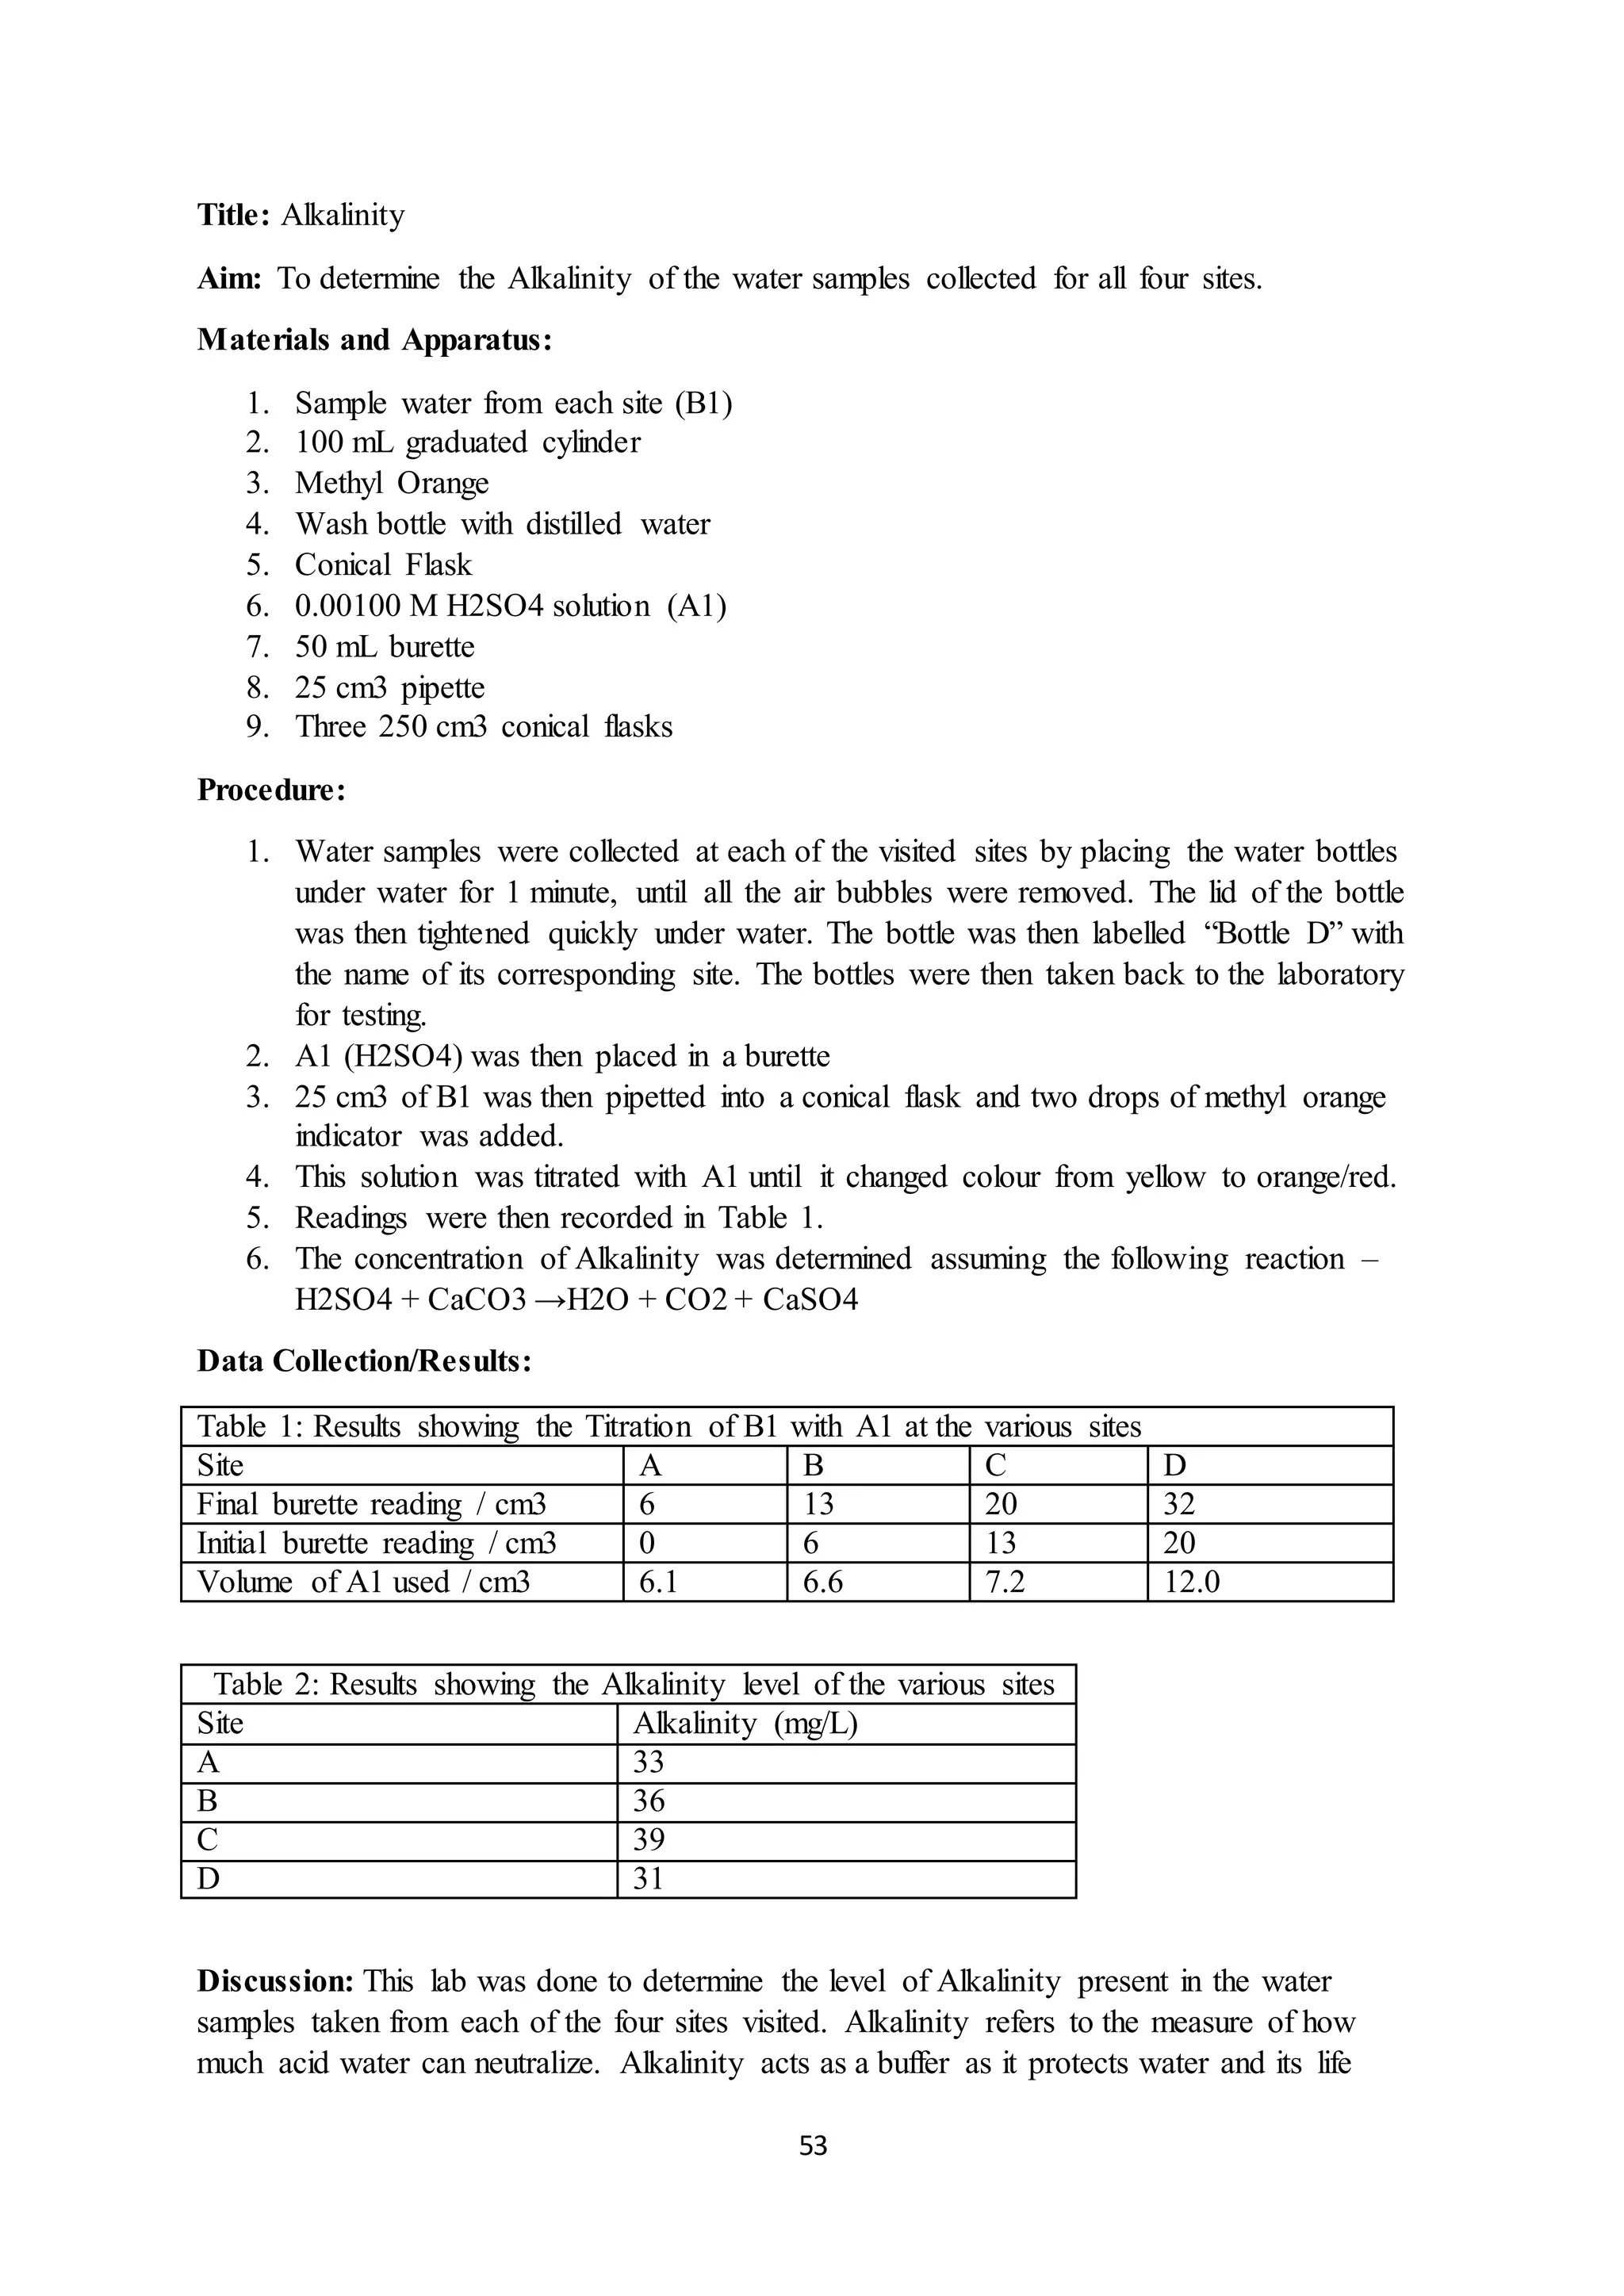
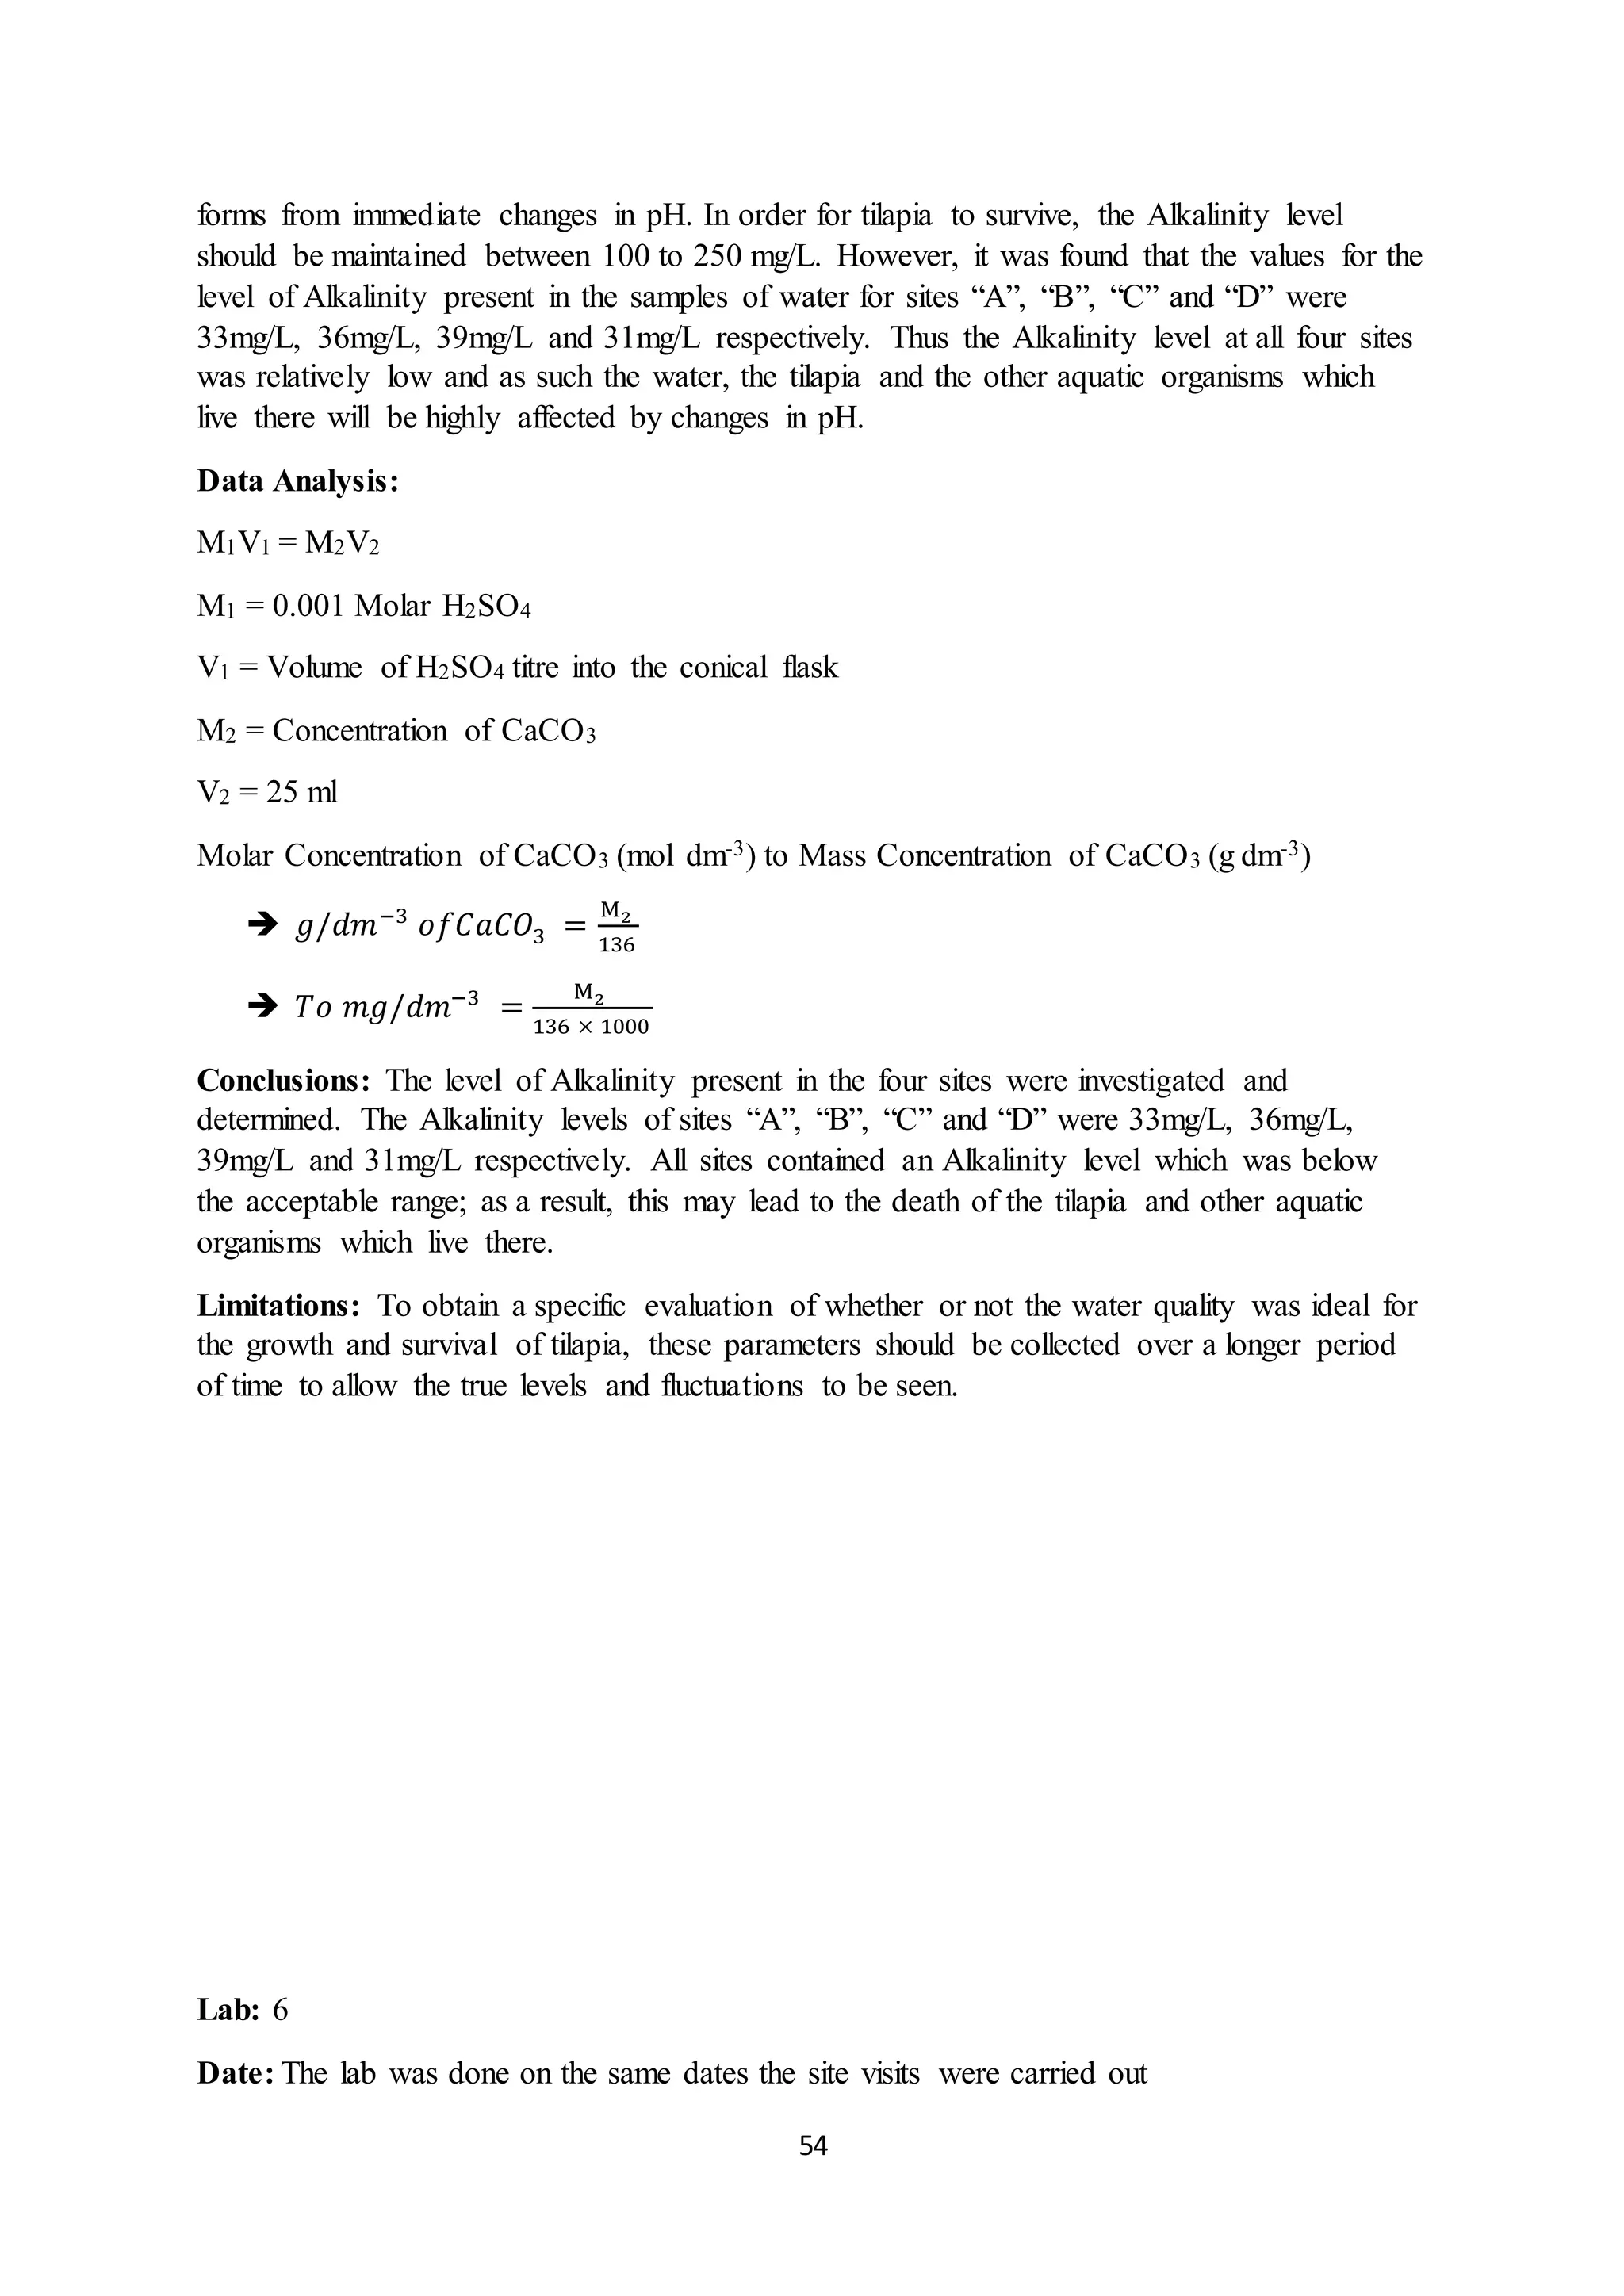
AN INVESTIGATION ON THE
REARING PRACTICES OF TILAPIA IN
THE LA VEGA ESTATE POND, GRAN
COUVA, TRINIDAD
NAME: SHARANA MOHAMMED
SUBJECT: ENVIRONMENTAL SCIENCE I.A. UNIT 2
SCHOOL: PRINCES TOWN WEST SECONDARY
YEAR: 2015 - 2016
Table of Contents
Acknowledgements ...................................................................................................................... 1
Introduction .................................................................................................................................2
Scope....................................................................................................................................... 2
Purpose....................................................................................................................................2
Literature Review......................................................................................................................... 4
Methodology.............................................................................................................................. 14
Activities and Data Collection ................................................................................................. 14
Laboratory Tests..................................................................................................................... 15
Presentation and Analysis............................................................................................................ 17
Laboratory Tests......................................................................................................................... 17
Discussions of Findings .............................................................................................................. 24
Conclusions ............................................................................................................................... 26
Recommendations ...................................................................................................................... 27
Bibliography .............................................................................................................................. 28
Appendices ................................................................................................................................ 29
Appendix 1 ................................................................................................................................ 29
Site Visits ........................................................................................................................... 29
Appendix 2............................................................................................................................. 41
Laboratory Entries............................................................................................................... 42
1
Acknowledgements
Completing this IA gave me a sense of fulfilment and I would like to thank the following
people for their contributions. Firstly, I would like to thank God for giving me wisdom and
the serenity needed in completing this project. My gratitude goes to my Environmental
Science teacher for his guidance and assistance in completing this project diligently. Sincere
thanks goes to my parents for supporting me and giving me much needed help when
necessary. Lastly, I pay gratitude to the authors of the various websites via the internet
services which allowed me to obtain vital information needed for this Internal Assessment.
2
Introduction
Tilapia is an African freshwater cichlid fish that is grown mainly in the wild. These fish are
attractive, easily bred, hardy and resistant to disease and, can live in a wide range of water
conditions. They can be stocked at high densities and feed on both prepared rations and
natural foods. Also, their flesh is firm and of excellent eating quality, as they contain
numerous health benefits, which include a rich source of nutrients, vitamins, and minerals,
including significant amounts of protein, omega-3 fatty acids, selenium, phosphorous,
potassium, vitamin B12, niacin, vitamin B6, and pantothenic acid. Due to these many
attributes, tilapia was commercialized as they make an excellent food source (Organic Facts,
2016).
In the Caribbean, there’s a wide variety of tilapia present. In the island of Trinidad, tilapia
production began in 1951, with the culture of the Mozambique tilapia, “Oreochromis
Mossambicus”. The Mozambique tilapia was crossed with other species to produce hybrids,
which include the “black tilapia”, “silver tilapia” and various red hybrids, known as the Red
Nile Tilapia (Ramnarine & Barrath, 2004). However, the Red Nile, was first introduced to
Trinidad from Jamaica in 1985, and is the most common hybrid of the Mozambique tilapia,
in Trinidad. It was found to be most suitable for aquaculture in our island and are bred
specifically for their bright red and orange hues. These red hybrids are stronger and faster
growing than their pure-line parents and due to their bright red colour, they are more
attractive and appealing to consumers than their wild caught (Gabbadon , de Souza, & Titus,
2008).
However, there are many issues faced with tilapia rearing. Firstly, in a pond, among other
species, tilapia are the invasive species, thus affecting the survivability of the other organisms
(Hailey, 2015). Additionally, farmed tilapia is less healthy than wild tilapia because reared
tilapia is fed an unnatural, unhealthy diet of cheap grains and soy pellets, rather than
plankton, plants and algae, and also contain less healthy fatty acids than their wild
counterparts. Furthermore, tilapia is at risk of parasitic diseases due to biological factors such
as age, stress, poor diet, high stocking densities and environmental factors such as salinity,
poor water quality, culture system, as report by Komar & Wendover (2007).
Scope
This study is focused on the rearing of tilapia in a selected pond in Trinidad. This is done to
ascertain the environmental findings of Komar & Wendover (2007) in order to highlight the
possible advantages and disadvantages of farmed tilapia as opposed to wild tilapia.
Purpose
Tilapia is commercialized in the island of Trinidad as it makes an excellent and economical
food source. Resulting from this commercialization are attributes such as income and
3
employment for the citizens of the country. However, reared tilapia is exposed to a different
environment than naturally occurring or wild tilapia. As such, the purpose of this study is to
recognize the differences between farmed and wild tilapia and to investigate the ecosystem
and pollution level resulting from farmed tilapia as opposed to its wild counterparts.
4
Literature Review
The two most prominent means of rearing tilapia are via tanks and ponds. Confinement tanks
allow tilapia to grow well at high densities, when good water quality is maintained, through
aeration and continuous water exchange, to renew dissolved oxygen (DO) supplies and
remove wastes. Whereas, pond culture is advantageous as it allows tilapia to utilize natural
foods. Pond culture may utilize extensive systems, where only organic or inorganic fertilizers
are used, or intensive systems, which makes use of high protein feed, aeration and water
exchange. Regardless, in both rearing methods, the optimum water temperature should be
maintained at 82-860F; at temperatures below 54°F, tilapia lose their resistance to disease and
are subject to infections by bacteria, fungi and parasites (Rakocy & McGinty, 1989).
Research Professor at the University of the West Indies, Indar Ramnarine, indicated that, in
Trinidad, most tilapia rearing projects use earthen ponds. However, there is a tank culture
operation in central Trinidad that utilizes injected oxygen in their system. He further stated
that, Caroni (1975) Limited and the Sugarcane Feeds Centre also use concrete and metal
tanks, but production from tank culture is limited, and, at the Bamboo Grove Fish Farm, there
are four octagonal concrete tanks with a solids removal system (Ramnarine & Barrath, 2004).
Tilapia feed can contribute to making the water toxic. Uneaten tilapia food results in
undissolved solids, that are suspended in the water or rests on the bottom, which toxifies the
water. These solids eventually dissolve in the water, forming dissolved solids. Dissolved
solids are partly made up of tilapia feed, that has been broken down into very fine particles,
that remain suspended in water and further contributes to the formation of more toxic
compounds, such as un-ionized ammonia. The ammonia is consumed by naturally occurring
bacteria, known as nitrosomonas, however, these bacteria give off even deadlier compounds,
called nitrites that oxidize to nitrates, which further affects the water quality. Furthermore,
resulting from the tilapia feed, are other dissolved contaminants, such as tannins and phenols,
which decolorizes the water and makes it smell bad, thereby further toxifying the water
(Lakeway Tilapia, 2016).
In the wild, tilapia consume a diet of algae and various plants, however, farmed tilapia is fed
an unnatural, unhealthy diet of GMO corn and soy pellets. When humans consume farmed
tilapia, this unnatural diet results in health issues, such as aggravation in the body like
asthma, joint inflammation and coronary disease. Another primary ingredient in the feed of
farmed tilapia is chicken feces as it’s a cheaper alternative to standard fish food. This results
in ten times the normal amount of carcinogenic, or cancer causing, agents as wild tilapia.
Another impact resulting from tilapia feed is that it produces eleven times the amount of a
lethal substance, dioxin, in the farmed tilapia fish than those in wild (Simple Organic Life,
2015). Additionally, tilapia is deemed healthy due to its richness in the omega-3 fatty acids.
However, these acids are greater in wild tilapia than farmed. Due to the farmed tilapia
consuming a diet of corn and soy rather than lake plants, they’re rich in omega-6 acids, which
studies have been proven to harm the heart and the brain (Eat This, Not That!, 2014).
Water quality comprises of physical, biological and chemical parameters that affect the
growth and welfare of cultured organisms. It affects the general condition of cultured
organisms as it determines the health and growth conditions of these organisms. Quality of
5
water is, therefore, an essential factor to be considered when planning for high aquaculture
production (Mallya, 2007). One of the five basic needs of tilapia is clean water. However, as
a result of tilapia rearing, due to factors such as leaching into ponds, the types of feed, and
improper waste disposal, is the predicament of the physicochemical characteristics of the
pond water being altered and affected. As such, water quality tests are done to quantitatively
determine the effects of tilapia rearing on water systems and the environment (eXtension,
2012).
These test were –
a) Biological Oxygen Demand
b) Temperature
c) pH
d) Turbidity
e) Total Solids
f) Total Phosphates
g) Nitrites
h) Alkalinity
i) Salinity
j) Ammonium ion
k) Coliform
6
Biological Oxygen Demand
Essential for respiration and decomposition, DO comes from atmospheric oxygen and
photosynthesis but because photosynthesis depends on the amount of light available to
aquatic plants, it takes time for the oxygen to fully dissolve and for correct levels to be
maintained. Tilapia is highly tolerant of low dissolved oxygen (DO) concentrations at
concentrations below 0.3 mg/L. However, the DO concentration in tilapia ponds should be
kept at 1 mg/L, to prevent reductions in growth and disease resistance. In a “healthy” body of
water, oxygen is replenished quicker than it’s used by aquatic organisms. However, in some
bodies of water, aerobic bacteria decompose such a vast volume of organic material, that
oxygen is depleted from the water faster than it can be replaced. The resulting decrease in
dissolved oxygen is known as the Biochemical Oxygen Demand (BOD).
Vital nutrients, for example nitrates and phosphates, which stimulate aquatic plant and algae
growth, are released via decomposition. If the load of decomposing organic material is
excessive, dissolved oxygen levels can be critically diminished. In a body of water with
substantial amounts of decaying organic material, the dissolved oxygen levels may decline by
90%, this would represent a high BOD. This can be widely impacted by pollution and
therefore needs to be monitored. Table 1 shows the effect of various levels of BOD in the
water.
Table 1 – The interpretation of BOD Levels
BOD Level
(mg/L)
Status
1-2 Clean water with little organic waste.
3-5 Moderately clean water with some organic waste.
6-9 Lots of organic material and bacteria.
10-20 Very poor water quality. Large amounts of organic material in the
water common to treated sewage.
20-100 Untreated sewage or high levels of effluents from industries or high
levels of erosion.
>100 Extreme conditions. Siltation and stationary water.
7
Temperature
Aquatic organisms are extremely fragile to the temperature of their environment. The growth
rate of tilapia is best between a temperature of 220C (72F) and 290C (84F). If the
temperature of the water isn’t at this optimum range, the tilapia won’t be able to survive and
reproduce and may eventually die. Therefore, the measure of the temperature of the water is
very important as an indication of water quality. Table 2 shows the cause and effect
relationship with changes in temperature.
Table 2 – The causes and effects of changes in water temperature
Changes in Water Temperature
Causes Effects
- Air Temperature - Solubility of dissolved oxygen
- Amount of shade - Rate of plant growth
- Soil erosion from increasing turbidity - Metabolic rate of organisms
- Thermal pollution from human activities - Resistance in organisms
8
pH
Aquatic organisms are extremely fragile to the pH of their environment. The growth rate of
tilapia is best between a pH of 7 – 9. If the pH of the water isn’t at this optimum range, the
tilapia won’t be able to survive and reproduce and may eventually die. Therefore, the
measure of the pH of the water is very important as an indication of water quality. The factors
that affect pH can be seen in Table 3.
Table 3 – Factors that affect pH levels
Factors Affecting pH Levels
- Acidic rainfall
- Algal blooms
- Level of hard-water minerals
- Releases from industrial processes
- Carbonic acid from respiration or decomposition
- Oxidation of sulphides in sediments
9
Turbidity
Turbidity is a measure of the transparency of water, and one of the main contributors to it in a
tilapia pond is phytoplankton. If phytoplankton are allowed to grow to very high density, a
high turbidity results. This is because an abundance of plankton discolours water and reduces
sunlight penetration. Water with high turbidity is cloudy, whereas water with low turbidity is
clear. A high turbidity is as a result of light reflecting off of particles in the water thus
resulting in the cloudiness. As such, the more particles in the water, the higher the turbidity.
Also, the rate of photosynthesis will decrease due to this because a high turbidity will
decrease the amount of sunlight that’s able to penetrate the water. When the water is cloudy,
sunlight will warm it more efficiently because the suspended particles in the water absorb the
sunlight, warming the surrounding water. This may lead to many issues linked to increased
temperature levels. Therefore, the Turbidity of a beach needs to be measured to guarantee it
doesn’t produce unwanted effects as shown in Table 4.
Table 4 – The sources and effects of turbidity in coastal waters
Change in Water Temperature
Source Effect
- Soil erosion – silt & clay - Reduces water clarity
- Urban runoff - Aesthetically displeasing
- Industrial waste – sewage treatment effluent
particulates
- Decreases photosynthetic rate
- Abundant bottom dwellers – stirring up sediments - Increases water temperature
- Organics – microorganisms & decaying plants &
animals
Total Solids
A measure of all the suspended, colloidal, and dissolved solids in the water is known as Total
solids, TS. This includes dissolved salts for example, sodium chloride, NaCl, and solid
particles such as silt and plankton. Total solids have the same impacts as Turbidity and are
described in Table 4.
10
Total Phosphates
Phosphorus is a vital nutrient for other species present in the tilapia ponds such as aquatic
plants and algae. However, only a minute amount is necessary, therefore, an excess can easily
occur. An excess amount is classified as a pollutant as it results in eutrophication, the
condition whereby there’s an excessive richness in nutrients, such as phosphorous, which
results in increased plant and algal growth. Eutrophication can lower the levels of dissolved
oxygen in the water and can make the water uninhabitable by the tilapia. Phosphorus is
frequently the limiting factor that controls the extent of eutrophication that occurs. Table 5
shows the sources and effects of phosphate levels in water.
Table 5 – The sources and effects of phosphate levels in water
Phosphate levels
Source Effect
- Human and animal
wastes
- High levels of – eutrophication, increased algal bloom,
increased BOD, decreased DO
- Industrial wastes - Low levels – limiting factor in plant and algal growth
- Agricultural runoff
- Human disturbance of
land
11
Nitrites
Nitrites are an essential source of nitrogen required by plants and animals to synthesize amino
acids and proteins. Nitrate levels below 10mg/L are not directly toxic to tilapia. However, it
becomes toxic when levels exceed 25 - 30 mg/L, and as a result may lead to death of the
tilapia. Nitrate pollution, caused by fertilizer runoff and concentration of livestock in feedlots,
has also become a major ecological issue in tilapia farms. Table 6 shows the sources of
nitrate ions in surface water.
Table 6 – Sources of Nitrate Ions
Sources of Nitrate Ions
- Agriculture runoff
- Urban runoff
- Animal feedlots and barnyards
- Municipal and industrial wastewater
- Automobile and industrial emissions
- Decomposition of plants and animals
Alkalinity
A measure of how much acid water can neutralize is known as the Alkalinity of water.
Alkalinity levels should be maintained at 100 to 250 mg/L, and it acts as a buffer, protecting
the water from immediate changes in pH. This ability to neutralize acid, is vital in ensuring
the survival of reared tilapia. Table 7 shows the effect of alkalinity to surface water.
Table 7 – The effects of alkalinity levels
Effects of Alkalinity Levels
- Buffers water against sudden changes in pH
- Protects aquatic organisms from sudden changes in pH
12
Salinity
Salinity is the measure of all the salts dissolved in water. All tilapia are tolerant to brackish
water. The tolerance of tilapia to salinity depends on the type of species, strains, size,
adaptation time and environmental factors. However, the ideal salinity for tilapia growth is up
to 15 ppt.
Ammonia
Ammonia, NH3, is a compound composed of nitrogen and hydrogen molecules. The levels of
ammonia have a strong impact on the water quality for tilapia, and levels which are two high
may result in the death of tilapia. Ammonia exists in two forms – unionized ammonia, NH3,
and ionized ammonia, NH4+. Unionized ammonia most toxic to tilapia, especially those
which are smaller in size. Both ammonia and ammonium are present in the water at all times,
and the percentage is influenced by temperature and pH. Warmer water, higher pH values and
low levels of dissolved oxygen concentrations favor unionized ammonia which is more toxic.
Table 8 – The consequences of ammonia levels
Ammonia level (mg/L NH3-N) Consequence
<0.6 Preferred ammonia level for tilapia
0.6 – 2.0 Lethal concentration for tilapia
1.0 Concentrations as low as 1.0 mg/L NH3 –N will
decease growth and performance in tilapia
>2.0 Tilapia start to die
Coliform
Both fresh and brackish water fishes can harbour human pathogenic bacteria, specifically the
coliform group. Faecal coliforms, e.g. “Escherichia coli” which originates from faeces of
warm blooded animals, in fish indicate the level of pollution of their environment because
coliforms are not the normal flora of bacteria in fish. Since these bacteria originate from the
wastes of animals or humans, high numbers of E. coli in a pond may come from septic
systems, runoff from barnyards, or from wildlife. The enteric bacilli include E. coli,
Klebsiella spp., Citrobacter spp., Enterobacter spp., Serratia spp., and Edwarsiella spp.
However, in Trinidad, bacterial density in rearing ponds has never been reported, therefore,
the present test was used to investigate the occurrence of coliforms reared in ponds so that it
could be used as a standard for further studies on fish quality.
The highlighted concern with this method of the rearing of tilapia is that, if it is not done
within the prescribed parameters of the pond size and fish density, it may result in the fish
becoming contaminated with a virus or human pathogenic bacteria. Araujo et al (1989) found
that there was a strong link between the presence of coliforms between 9 to 107 cfu/100 ml
13
and these human pathogens in fresh water with average presence of 102–109 cfu/100 ml.
Further, Madal et al (2009), found a strong correlation between the absorption of these
microbia into the tilapia fish posing a threat to health and safety of humans.
14
Methodology
Activities and Data Collection
For this study, various tilapia ponds were visited in Trinidad. The population size of the
tilapia in the pond was determined by using the ecological sampling method of “mark,
release, recapture” was utilized. Firstly, the tilapia was captured, after which, it was carefully
tagged. It was then released back into the pond and recaptured once more. The equation
𝑃𝑜𝑝𝑢𝑙𝑎𝑡𝑖𝑜𝑛 𝐸𝑠𝑡𝑖𝑚𝑎𝑡𝑒 ( 𝑁)
=
(Total Number Captured,Marked & Released (n1) ) x (Number Captured (n2))
𝑇𝑜𝑡𝑎𝑙 𝑁𝑢𝑚𝑏𝑒𝑟 𝐶𝑎𝑝𝑡𝑢𝑟𝑒𝑑 𝑤𝑖𝑡ℎ 𝑀𝑎𝑟𝑘 (𝑛3))
was used to calculate the overall population, whereby N was the total population, n1 was the
number of tilapia captured, marked and released, n2 was the total number captured on the
second occasion and n3 was the number of marked tilapia recaptured. Additionally, upon
capturing the tilapia, their size was measured, and their general colour was observed. Overall,
the aforementioned processes were done so that the findings could be compared to the data
from the Literature Review, in order for generalizations about the various aspects of tilapia to
be made.
Furthermore, water samples were collected from each site and water quality tests were done
on these samples. This is because, water plays an essential role in the sustainability of tilapia,
since they need clean water to survive and to produce a healthy fish. Various factors, such as
the type of feed, and pollution, would affect the physicochemical characteristics of the pond
water, thereby altering its natural balance. As such, water quality tests were done to
quantitatively determine the effects of tilapia rearing on water quality.
15
Laboratory Tests
Water quality tests will give information about the “health” of the pond water. By testing
water over a period of time, the alterations in the quality of the water can be seen. However,
due to the limitation of time with the borrowed equipment, reagents and time only one set of
tests could have been performed for each site visited. The parameters that were tested in this
project included temperature, pH, turbidity, nitrites, phosphates, BOD5, alkalinity, coliform,
ammonia and salinity. A qualitative visual assessment of the aquatic system was also carried
out.
A LabQuest2 water quality testing package, provided by the University of Trinidad and
Tobago, Agricultural and Food Technology Department, was used to test the water quality
parameters.
The LabQuest2 water quality testing kit included probes for testing water, temperature, pH,
turbidity, nitrates, phosphates, BOD and alkalinity.
The LabQuest2 is a portable, hand held device, to which various probes are used to determine
the properties of the sampled water. At each site, each group of the three groups collected
four (4) water samples using plastic bottles from the water of the beach. These bottles were
labelled A to D. In addition to the four water samples taken, another five (5) samples were
taken using glass bottles to test for BOD5, these bottles were labelled E1 to E5.
The water samples were collected by completely submerging the bottles into the water and
allowing water to fill up to the “mouth” of the bottle. After this, the lid was quickly fastened
on the bottle, while it was still under water. The bottles were then packaged and transported
to the laboratory. This method of sampling was done for all the sites visited. Each sample set
was then brought to the laboratory for testing using the LabQuest2 to obtain the following
readings of –
Biochemical Oxygen Demand – Bottles E1 to E5 which were stored in ice and wrapped in
foil were used for this. The dissolved oxygen levels present on the initial day and at the end
of the five day period were measured using the Dissolved Oxygen Sensor. The difference and
average was then determined as the BOD5. (Refer to Lab 1)
Temperature. – The Stainless Steel Temperature Probe was placed into bottle “A” and after
the temperature stabilized on the interface, the reading was recorded. (Refer to Lab 2)
pH – The pH Sensor Probe was placed into bottle “A” and swirled until a reading of the pH
was stabilised on the interface and the reading was recorded. (Refer to Lab 2)
Nitrites – The nitrate-ion concentration in the water sample from bottle “A”, in mg/L NO2,
was measured by placing the electrode from the Nitrite Ion-Selective Electrode into the
bottle. The reading was then recorded. (Refer to Lab 2)
Turbidity – The Turbidity in NTU was determined using the Turbidity Sensor. Water from
sample bottle “A” was poured into a cuvette and placed into the Turbidity Sensor. The
reading was then recorded. (Refer to Lab 2)
16
Salinity - The Salinity of the water samples was determined by placing a salinity sensor in
each water sample to determine the total dissolved salt content in each solution. (Refer to Lab
2)
Ammonia - After standardization, an ammonium ion select probe was placed in each water
sample to determine the ammonium ion concentration of each sample. (Refer to Lab 2)
Total Solids – A precise amount of water from Bottle “B” was measured and placed into a
clean, dried and weighed beaker. A drying oven was then used to evaporate the water and the
beaker was reweighed. The difference between the final and initial mass the total solids was
calculated. Calculations were also made to convert the mass to mg/L total solids. (Refer to
Lab 3)
Total Phosphates – A colorimeter was used to create a 4-point standard curve of phosphate
absorbance vs concentration, by using a set of four phosphate standards. The water sample
from bottle “C” was then poured into the cuvette and placed into the colorimeter to determine
its absorbance. The concentration of the total phosphates was deduced from the graph, using
the absorbance of the water sample. (Refer to Lab 4)
Alkalinity – Alkalinity of the water samples was determined by titrating 0.001M sulphuric
acid against the water sample in Bottle “D”, using a methyl orange indicator to determine the
end point of the reaction. At the end point of the reaction, the alkalinity was determined using
the stoichiometric ratio between sulphuric acid and calcium carbonate. (Refer to Lab 5)
Coliform - To determine the level of E-Coli present at each site, a plate count using agar was
done, after seven serial dilutions. (Refer to Lab 6)
17
Presentation and Analysis
Laboratory Tests
Graph 1 –
From the graph above it is observed that as the level of Total Solids increases, the level of
Biological Oxygen Demand and Turbidity also increases. Site B had the highest level of
Total Solids which was 90mg/L, whilst Site A had the lowest which was 75mg/L. The BOD
level at Site C was the highest, which was 7.38mg/L and Site D was the lowest, at 6.02mg/L.
Site D had the highest Turbidity level which was 27NTU, whereas Site A had the lowest
level, which was 18NTU.
0
10
20
30
40
50
60
70
80
90
100
A B C D
AverageBOD(mg/L),TotalSolids(mg/L),and
Turbidity(NTU)
Site
Graph Showing The BOD (mg/L), Total Solids (mg/L) and
Turbidity (NTU) LevelAt Each Site
BOD (mg/L)
Total Solids (mg/L)
Turbidity (NTU)
18
Graph 2 –
From the graph above it is observed that as the level of Salinity increases, the level of
Biological Oxygen Demand also increases. The Salinity level at Sites C and D are the highest
with a value of 1.3ppt, whilst Sites A and B had similar levels which were 1.2ppt and 1.1ppt
respectively. The BOD level at the four sites ranged between 6.02mg/L and 7.38mg/L.
0
1
2
3
4
5
6
7
8
A B C D
AverageBOD(mg/L)andSalinity(ppt)
Site
Graph Showing The BOD (mg/L) and Salinity (ppt) Level At Each
Site
BOD (mg/L)
Salinity (ppt)
19
Graph 3 –
The graph above indicates that there were fluctuations among the levels of Nitrates and
Phosphates present at the sites; site B had the highest level of Nitrates (12.7mg/L) and
Phosphates (4.63mg/L). The pH values of the four visited sites were fairly similar with values
ranging between 7.31 – 7.84.
0 2 4 6 8 10 12 14
A
B
C
D
Level of Total Phosphates (mg/L), Nitrates (mg/L), pH
Site
Grah Showing The Total Phosphates (mg/L), Nitrates (mg/L) and
pH Level At Each Site
Total Phoshates (mg/L)
Nitrates (mg/L)
pH
20
Graph 4 –
The above graph shows that when the Alkalinity level in water is high, the Nitrate level is
low. Site C had the highest Alkalinity level at 39mg/L, and therefore the lowest Nitrate level
at 6.4mg/L. In contrast, Site D had the lowest Alkalinity level, which was 31mg/L and a
Nitrate level of 9.8mg/L. The Ammonium level at all sites were similar ranging between
0.7mg/L – 0.9mg/L.
0
5
10
15
20
25
30
35
40
45
A B C D
LevelofAlkalinity(mg/L)andNitrates(mg/L)
Site
Graph Showing The Alkalinity (mg/L) And Nitrate (mg/L) Level
At Each Site
Nitrate (mg/L)
Alkalinity (mg/L)
Ammonium (mg/L)
21
Graph 5 –
From the graph above it is observed that as Temperature increases, the level of Biological
Oxygen Demand also increases. At each site, the temperature and BOD levels were fairly
similar, ranging between 24.440C – 27.430C and 6.02mg/L – 7.38mg/L respectively.
0
5
10
15
20
25
30
A B C D
LevelBOD(mg/L)andTemperature(0C)
Site
Graph Showing The Temperature (0C) And BOD (mg/L) LevelAt
Each Site
Temperature
BOD
22
Graph 6 –
The graph above shows that the Coliform value was 1.11E+08, which was higher than the
value of E. Coli which was 7.35E+08. The Total Count of both values was 1.85E+08.
1.85E+08
7.35E+07
1.11E+08
Donut Chart Showing The Average Colonies/100mL
Total Count
Coliscan - purple (E.coli)
Coliscan - red, pink & purple
(coliforms)
23
Graph 7 –
The above graph shows that sites A, B, C and D had relatively similar Total Coliform values,
ranging between 8.60E+07 - 9.95E+07.
8.60E+07
9.10E+07
9.30E+07
9.95E+07
Pie Chart Showing The Total Coliform per 100mL of Water At
Each Site
A B
C D
24
Discussions of Findings
The results of the tests indicated that each site had a moderate level of Biological Oxygen
Demand ranging between 6.02 – 7.38. Aquatic organisms obtain oxygen in the form of
dissolved oxygen. When aerobic bacteria decompose a vast volume of organic material such
that oxygen is depleted faster than it can be replaced, the resulting decrease in dissolved
oxygen is known as the Biological Oxygen Demand. From the information presented in the
Literature Review, it is noted that a BOD level ranging from 6 -9 indicates that the water
contained lots of organic material and bacteria. This is justified since, the level of BOD in
water would be affected by the level of Turbidity and Total Solids. Turbidity is a measure of
water’s lack of clarity and can thus be interrelated to the level of Total Solids, which consist
of solid particles which may have a dark appearance, since a high level of Total Solids
present would cause water to lose its clarity and thus results in a high Turbidity level.
Furthermore, the dark appearance of the large amounts of solid particles in water will attract
heat from the sun and cause the temperature of the water to increase. This therefore causes
water loses its ability to hold dissolved oxygen which therefore results in an increase in the
Biological Oxygen Demand.
Another factor which would result in an increase in the level of Biological Oxygen Demand
would be Salinity. From the Literature Review, Salinity is defined as “the measure of all the
salts dissolved in water”, and tilapia can survive at Salinity levels of up to 15 ppt. When
Salinity increases, there will be more salt particles being present in the water. These salts may
have a dark appearance when present in the water and would thus attract heat via sunlight. As
a result, there will be an increase in water temperature, thereby causing the water to lose its
ability to hold dissolved oxygen, which results in an increase in the Biological Oxygen
Demand. However, from the results obtained, it was deduced that the Salinity levels at each
site was 1.3 ppt and less, which according to the Literature Review, will allow for the
survival of the tilapia.
Temperature also has an effect on the Biological Oxygen Demand. As mentioned above,
when the temperature increases, water loses its ability to hold dissolved oxygen which
therefore results in an increase in the Biological Oxygen Demand. From the information
presented in the Literature Review, it is noted that the growth rate of tilapia is best between a
temperature of 220C and 290C. The results of the tests depicted that the temperature of the
sites ranged between 24.440C – 27.430C. Thus, it is confirmed that the water temperature at
each site is appropriate for the growth and reproduction of tilapia.
Furthermore, from the research done, it is noted that different forms of agricultural processes
take place at the La Vega estate. As such, Nitrate and Phosphate fertilizers may have been
utilized, which would have therefore entered the pond water. Nitrates, which are acidic in
nature, and Phosphates, which are basic in nature, would affect the pH of water. The pH of
each site ranged between 7.31 – 7.84. On the pH scale, a pH of 7 is neutral, below 7 is acidic
and above 7 is basic. As such, these pHs would be considered relatively neutral. Since the pH
of the sites was fairly neutral, it can be established that the existence of both Nitrates and
Phosphates in water kept the pH at a relative balance. Furthermore, from the data established
in the Literature Review, it is noted that the growth rate of tilapia is best between a pH of 7 –
25
9. Therefore, the pH of the water at each site would allow for the optimum growth of the
tilapia.
Additionally, the level of Nitrates present would be affected by the level of Alkalinity of the
water. This is because the Alkalinity of water is a measure of how much acid it can
neutralize. When the Alkalinity level is high, the Nitrate level would therefore be low as
water is able to neutralize nitrates which are acidic in nature. From the results obtained, it was
seen that each site had a high level of Alkalinity and nitrate levels which were lower than
12.7mg/L and less. From the Literature Review, it is noted that nitrate levels above 25mg/L
would be toxic to the tilapia. Therefore, these levels would not be toxic to the tilapia since the
high alkalinity of the water is able to keep the nitrate levels within a low range.
Apart from nitrates, the presence of ammonia in the pond will result in an overall increase in
the nitrogen supply to the tilapia and other aquatic organisms. According the Literature
Review, unionized ammonia – NH3, is toxic to tilapia however ionized ammonia – NH4+
(ammonium), isn’t toxic. From the results obtained, the ammonium concentrations were
0.9mg/L and less, which will not be toxic to the tilapia and allow them to survive
comfortably.
Lastly, there are toilet facilities near the pond, with the sewage water pipe running into the
pond. Due to this, there may be human related bacteria present in the pond. This is justified
from the results obtained as it showed that the average colonies per 100mL were high in
value, with the highest value being 7.35E+07, which was from the Coliscan – purple. In
addition to this, the Total Coliform per 100mL of water at each site was relatively high and
similar to each other, with values ranging between 8.60E+07 – 9.95E+07. As a result, the
Total Coliform in the pond was high. From the Literature Review, it was established by
“Araujo et al (1989)”, that there was a strong link between the presence of coliforms between
9 to 107 cfu/100 ml and human pathogens in fresh water with average presence of 102–109
cfu/100 ml. In addition to this, “Madal et al (2009)”, found a strong correlation between the
absorption of these microbia into the tilapia fish posing a threat to health and safety of
humans. As such, the results obtained would justify the information presented in the
Literature Review since the levels of Total Coliform at each site was relatively high.
Although the tilapia would be able to survive under these conditions and would not be
directly affected, if the tilapia is consumed by humans, it may result in health complications.
Additionally, the high levels of bacteria present would contribute to an increase in Total
Solids, Turbidity and BOD, which would cause harm to the fish, thereby inhibiting their
survival.
26
Conclusions
Within the limits of experimental errors, from the various observations made throughout this
Internal Assessment and tests carried out at all four sites, all sites, and therefore the entire
pond, provided the necessary conditions for the rearing of tilapia. However, certain
parameters such as Total Solids, BOD and Turbidity contained values which were higher than
the required ranges for the survival of tilapia. These increased values would therefore have an
effect on the growth and reproduction of tilapia in the pond.
27
Recommendations
- An alternative method to running the waste water pipe into the pond should be used.
- The restroom facilities should be located away from the pond.
- The quality of water of the pond, at all sites, should be monitored frequently so that
the tilapia and other aquatic organisms have an optimum environment for growth and
maintenance.
28
Bibliography
Eat This, Not That! (2014). How Tilapia is a More Unhealthy Food Than Bacon. Retrieved
from Eat This, Not That!: http://www.eatthis.com/tilapia-is-worse-than-bacon
eXtension. (2012, October 17). Water Quality in Aquaculture. Retrieved from eXtension:
http://articles.extension.org/pages/58707/water-quality-in-aquaculture
Gabbadon , P., de Souza, G., & Titus, A. (2008). A Manual for Commercial Tilapia
Production. Institute of Marine Affairs.
Komar, C., & Wendover, N. (2007, June 18). Parasitic Diseases Of Tilapia. Retrieved from
The Fish Site: http://www.thefishsite.com/articles/294/parasitic-diseases-of-tilapia/
Lakeway Tilapia . (2016). Tilapia farming guide - Understanding the five needs of tilapia.
Retrieved from Lakeway Tilapia: https://lakewaytilapia.com/How_To_Raise_Tilapia.php
Organic Facts. (2016). Health Benefits of Tilapia. Retrieved from Organic Facts:
https://www.organicfacts.net/health-benefits/animal-product/tilapia.html
Rakocy, J. E., & McGinty , A. S. (1989). Tank and Pond Culture of Tilapia. Southern
Regional Aquaculture Centre (SRAC) Publication.
Ramnarine, I. W., & Barrath, C. (2004). Tilapiia Culture In Trinidad and Tobago: Yet
Another Update.
Simple Organic Life. (2015, April 5). Here’s Why You Should Never Eat Tilapia Again.
Retrieved from Simple Organic Life: http://simpleorganiclife.org/never-eat-tilapia/
29
Appendices
Appendix 1
Site Visits
Site Visit: 1
Date: 20/01/2016
Location: La Vega Estate, Gran Couva
Map:
Map 1: Showing location of Site A in the La Vega Estate pond
Title: Environmental Survey of tilapia production in an earth pond.
Aim: To assess fish population, feeding practices its effects on the environment and water
quality and hence deduce the quality of the fish.
30
Objectives:
- To observe the overall practice of Tilapia rearing and identify areas of waste
production
- To assess tilapia population.
- To identify and record waste management strategies being employed.
- To assess water quality of the pond
Introduction: The Tilapia pond is located at the La Vega Estate, Gran Couva, which is in
Central Trinidad. The Estate is approximately 250 acres, however the pond itself is
approximately 2.67 acres or 10, 800 sq meters. The uses of the pond range from recreational
to the rearing of a range of fishes, predominantly Tilapia for the local market. Over the years,
tilapia became the dominant species in the pond, which is currently made up primarily of
Mozambique tilapia. For this investigation, the pond was divided into 4 sites.
Site A is located near the huts, with the nearby vegetation being mainly lawn grass, with
some ornamental trees such as palms and fruit trees (golden apple and jamon). The water at
this site of the pond was light brown in colour, however, the water near the bank was fairly
transparent.
Image 1: Showing the aerial view of the La Vega Estate pond
31
Image 2: Showing the longitudinal view of Site A in the La Vega Estate pond
Methodology/Activities: The “Mark and Recapture” method was used to estimate the
population of tilapia at Site A of the pond. The fishes were also observed for any form of
discolorations as indications of illness. Furthermore, water sample were taken and were
quality tests were done. The feeding practices and harvesting were also documented.
Mark and Recapture -
Day 1 –
For this method, feed pellets were used to attract the tilapia to a specific location and nets
were used to capture several tilapia alive at one time. Each tilapia was marked by tagging
them with a T-bar and they were then released back into the pond, unharmed. After two
hours, the fish were again caught and data was taken pertaining to how many tilapia were
captured with and without tags. The mathematical formula below was used to estimate the
population size of the tilapia. The total size of the pond was 10, 800 sq meters, however, the
sample area used was 36 sq meters.
32
Observations and Results:
Trial Number Number Captured Number Recaptured with mark
1 17 8
2 17 6
3 17 6
4 18 6
5 18 7
6 18 8
7 19 6
8 21 7
9 18 6
10 17 5
Total: 180 65
𝑃𝑜𝑝𝑢𝑙𝑎𝑡𝑖𝑜𝑛 𝐸𝑠𝑡𝑖𝑚𝑎𝑡𝑒 =
180 × 72
65
= 199 in 36 sq meters
Total population based on this estimate =
199
36
× 10,800 = 59,700
*Ideal population based on the size of pond = 10,800 × 4 = 𝟒𝟑, 𝟐𝟎𝟎
This is based on the literature finding which indicated that the ideal conditions for Tilapia is 4
fish to 1 sq meter.
Difference in population – 59, 700 – 43, 200 = 16, 500
Percentage difference – 16, 500/43, 200 x 100 = 38%
Discussion: Based on the size of the pond, the ideal population of tilapia was determined to
be 43, 200. However, after using the formula to estimate the population of Tilapia in the pond
from the first 10 trials, it was found that the total estimated population was 59, 700.
Therefore, the total estimated population of tilapia present at Site A of the pond was 38%
greater than the ideal population. This is because the sampling technique used was biased, as
it gave only an estimated population of the tilapia rather than the actual value, thus resulting
in a higher population figure.
Conclusion: The total estimated population of Tilapia at Site A of the La Vega Estate pond
was 59, 700 fish.
Follow Ups: The site should be visited during other months of the year, between both the dry
and rainy season, and the physicochemical tests and the experiment for the population size of
the tilapia should be carried out, in order to obtain more accurate data.
33
Site Visit: 2
Date: 27/01/2016
Location: La Vega Estate, Gran Couva
Map:
Map 1: Showing location of Site B in the La Vega Estate pond
Title: Environmental Survey of tilapia production in an earth pond.
Aim: To assess fish population, feeding practices its effects on the environment and water
quality and hence deduce the quality of the fish.
Objectives:
- To observe the overall practice of Tilapia rearing and identify areas of waste
production
- To assess tilapia population.
- To identify and record waste management strategies being employed.
- To assess water quality of the pond
Introduction: The Tilapia pond is located at the La Vega Estate, Gran Couva, which is in
Central Trinidad. The Estate is approximately 250 acres, however the pond itself is
approximately 2.67 acres or 10, 800 sq meters. The uses of the pond range from recreational
to the rearing of a range of fishes, predominantly Tilapia for the local market. Over the years,
tilapia became the dominant species in the pond, which is currently made up primarily of
Mozambique tilapia. For this investigation, the pond was divided into 4 sites.
34
Site B is located near the huts, with no major vegetation being present. At this site, the color
of the water in the pond was light brown. However, the pond water was mostly covered with
lilies, which limited the water clarity.
Methodology/Activities: The “Mark and Recapture” method was used to estimate the
population of tilapia at Site B of the pond. The fishes were also observed for any form of
discolorations as indications of illness. Furthermore, water sample were taken and were
quality tests were done. The feeding practices and harvesting were also documented.
Mark and Recapture -
Day 1 –
For this method, feed pellets were used to attract the tilapia to a specific location and nets
were used to capture several tilapia alive at one time. Each tilapia was marked by tagging
them with a T-bar and they were then released back into the pond, unharmed. After two
hours, the fish were again caught and data was taken pertaining to how many tilapia were
captured with and without tags. The mathematical formula below was used to estimate the
population size of the tilapia. The total size of the pond was 10, 800 sq meters, however, the
sample area used was 36 sq meters.
Observations and Results:
Trial Number Number Captured Number Recaptured with mark
11 21 5
12 20 5
13 21 8
14 20 8
15 21 5
16 20 8
17 19 5
18 18 5
19 20 5
20 20 7
Total: 200 61
𝑃𝑜𝑝𝑢𝑙𝑎𝑡𝑖𝑜𝑛 𝐸𝑠𝑡𝑖𝑚𝑎𝑡𝑒 =
200 × 72
61
= 236 in 36 sq meters
Total population based on this estimate =
236
36
× 10,800 = 70,800
*Ideal population based on the size of pond = 10,800 × 4 = 𝟒𝟑, 𝟐𝟎𝟎
This is based on the literature finding which indicated that the ideal conditions for Tilapia is 4
fish to 1 sq meter.
Difference in population – 70, 800 – 43, 200 = 27, 600
35
Percentage difference – 2, 600/43, 200 x 100 = 64%
Discussion: Based on the size of the pond, the ideal population of tilapia was determined to
be 43, 200. However, after using the formula to estimate the population of Tilapia in the pond
from the first 10 trials, it was found that the total estimated population was 70, 800.
Therefore, the total estimated population of tilapia present at Site B of the pond was 64%
greater than the ideal population. This is because the sampling technique used was biased, as
it gave only an estimated population of the tilapia rather than the actual value, thus resulting
in a higher population figure.
Conclusion: The total estimated population of Tilapia at Site B of the La Vega Estate pond
was 70, 800 fish.
Follow Ups: The site should be visited during other months of the year, between both the dry
and rainy season, and the physicochemical tests and the experiment for the population size of
the tilapia should be carried out, in order to obtain more accurate data.
Site Visit: 3
Date: 03/02/2016
Location: La Vega Estate, Gran Couva
Map:
36
Map 1: Showing location of Site C in the La Vega Estate pond
Image 1: Showing the longitudinal view of Site C in the La Vega Estate pond
Title: Environmental Survey of tilapia production in an earth pond.
Aim: To assess fish population, feeding practices its effects on the environment and water
quality and hence deduce the quality of the fish.
Objectives:
37
- To observe the overall practice of Tilapia rearing and identify areas of waste
production
- To assess tilapia population.
- To identify and record waste management strategies being employed.
- To assess water quality of the pond
Introduction: The Tilapia pond is located at the La Vega Estate, Gran Couva, which is in
Central Trinidad. The Estate is approximately 250 acres, however the pond itself is
approximately 2.67 acres or 10, 800 sq meters. The uses of the pond range from recreational
to the rearing of a range of fishes, predominantly Tilapia for the local market. Over the years,
tilapia became the dominant species in the pond, which is currently made up primarily of
Mozambique tilapia. For this investigation, the pond was divided into 4 sites.
Site C is located near the huts, with the nearby vegetation being mainly lawn grass. The water
at this site of the pond was brown in color and was relatively transparent.
Methodology/Activities: The “Mark and Recapture” method was used to estimate the
population of tilapia at Site A of the pond. The fishes were also observed for any form of
discolorations as indications of illness. Furthermore, water sample were taken and were
quality tests were done. The feeding practices and harvesting were also documented.
Mark and Recapture -
Day 1 –
For this method, feed pellets were used to attract the tilapia to a specific location and nets
were used to capture several tilapia alive at one time. Each tilapia was marked by tagging
them with a T-bar and they were then released back into the pond, unharmed. After two
hours, the fish were again caught and data was taken pertaining to how many tilapia were
captured with and without tags. The mathematical formula below was used to estimate the
population size of the tilapia. The total size of the pond was 10, 800 sq meters, however, the
sample area used was 36 sq meters.
Observations and Results:
Trial Number Number Captured Number Recaptured with mark
21 20 6
22 17 6
23 17 8
24 18 6
25 20 5
26 19 5
27 18 7
28 20 6
29 20 5
30 21 5
Total: 190 59
38
𝑃𝑜𝑝𝑢𝑙𝑎𝑡𝑖𝑜𝑛 𝐸𝑠𝑡𝑖𝑚𝑎𝑡𝑒 =
190 × 72
59
= 231 in 36 sq meters
Total population based on this estimate =
231
36
× 10,800 = 69,300
*Ideal population based on the size of pond = 10,800 × 4 = 𝟒𝟑, 𝟐𝟎𝟎
This is based on the literature finding which indicated that the ideal conditions for Tilapia is 4
fish to 1 sq meter.
Difference in population – 69, 300 – 43, 200 = 26, 100
Percentage difference – 26, 100/43, 200 x 100 = 60%
Discussion: Based on the size of the pond, the ideal population of tilapia was determined to
be 43, 200. However, after using the formula to estimate the population of Tilapia in the pond
from the first 10 trials, it was found that the total estimated population was 69, 300.
Therefore, the total estimated population of tilapia present at Site C of the pond was 60%
greater than the ideal population. This is because the sampling technique used was biased, as
it gave only an estimated population of the tilapia rather than the actual value, thus resulting
in a higher population figure.
Conclusion: The total estimated population of Tilapia at Site C of the La Vega Estate pond
was 69, 300 fish.
Follow Ups: The site should be visited during other months of the year, between both the dry
and rainy season, and the physicochemical tests and the experiment for the population size of
the tilapia should be carried out, in order to obtain more accurate data.
Site Visit: 4
Date: 10/02/2016
Location: La Vega Estate, Gran Couva
Map:
39
Map 1: Showing location of Site D in the La Vega Estate pond
Title: Environmental Survey of tilapia production in an earth pond.
Aim: To assess fish population, feeding practices its effects on the environment and water
quality and hence deduce the quality of the fish.
Objectives:
- To observe the overall practice of Tilapia rearing and identify areas of waste
production
- To assess tilapia population.
- To identify and record waste management strategies being employed.
- To assess water quality of the pond
Introduction: The Tilapia pond is located at the La Vega Estate, Gran Couva, which is in
Central Trinidad. The Estate is approximately 250 acres, however the pond itself is
approximately 2.67 acres or 10, 800 sq meters. The uses of the pond range from recreational
to the rearing of a range of fishes, predominantly Tilapia for the local market. Over the years,
tilapia became the dominant species in the pond, which is currently made up primarily of
Mozambique tilapia. For this investigation, the pond was divided into 4 sites.
Site D is located near the restroom areas. The nearby vegetation is mainly forested trees. The
water at this site of the pond was dark brown in color and was not transparent. The sewage
waste water pipe was seen entering the pond at this site.
Methodology/Activities: The “Mark and Recapture” method was used to estimate the
population of tilapia at Site A of the pond. The fishes were also observed for any form of
40
discolorations as indications of illness. Furthermore, water sample were taken and were
quality tests were done. The feeding practices and harvesting were also documented.
Mark and Recapture -
Day 1 –
For this method, feed pellets were used to attract the tilapia to a specific location and nets
were used to capture several tilapia alive at one time. Each tilapia was marked by tagging
them with a T-bar and they were then released back into the pond, unharmed. After two
hours, the fish were again caught and data was taken pertaining to how many tilapia were
captured with and without tags. The mathematical formula below was used to estimate the
population size of the tilapia. The total size of the pond was 10, 800 sq meters, however, the
sample area used was 36 sq meters.
Observations and Results:
Trial Number Number Captured Number Recaptured with mark
31 21 8
32 21 6
33 17 5
34 19 8
35 19 8
36 18 5
37 17 8
38 17 5
39 17 7
40 18 6
Total: 184 66
𝑃𝑜𝑝𝑢𝑙𝑎𝑡𝑖𝑜𝑛 𝐸𝑠𝑡𝑖𝑚𝑎𝑡𝑒 =
184 × 72
66
= 200 in 36 sq meters
Total population based on this estimate =
200
36
× 10,800 = 60,000
*Ideal population based on the size of pond = 10,800 × 4 = 𝟒𝟑, 𝟐𝟎𝟎
This is based on the literature finding which indicated that the ideal conditions for Tilapia is 4
fish to 1 sq meter.
Difference in population – 60, 000 – 43, 200 = 16, 800
Percentage difference – 16, 800/43, 200 x 100 = 39%
Discussion: Based on the size of the pond, the ideal population of tilapia was determined to
be 43, 200. However, after using the formula to estimate the population of Tilapia in the pond
from the first 10 trials, it was found that the total estimated population was 60, 000.
Therefore, the total estimated population of tilapia present at Site A of the pond was 39%
41
greater than the ideal population. This is because the sampling technique used was biased, as
it gave only an estimated population of the tilapia rather than the actual value, thus resulting
in a higher population figure.
Conclusion: The total estimated population of Tilapia at Site D of the La Vega Estate pond
was 60, 000 fish.
Follow Ups: The site should be visited during other months of the year, between both the dry
and rainy season, and the physicochemical tests and the experiment for the population size of
the tilapia should be carried out, in order to obtain more accurate data.
Appendix 2
42
Laboratory Entries
Lab: 1
Date: The lab was done on the same dates the site visits were carried out
Title: Biochemical Oxygen Demand
Aim: To determine the Biochemical Oxygen Demand (BOD5) of all four sites.
Materials and Apparatus:
1. Vernier LabQuest 2 interface
2. BOD Water Sample
3. Vernier Dissolved Oxygen Probe
4. 100% calibration bottle
5. D.O. Electrode Filling Solution
6. Wash bottle with distilled water
7. Sodium Sulfite Calibration Solution
8. Sample water from each site
9. Pipette
10. 250 mL beaker
Procedure:
Day 0
1. At each of the four sites visited, the group collected five water samples for the BOD
test.
2. Each of the glass BOD sample bottles were then placed approximately 10cm below
the water’s surface and kept there for 1 minute until all air bubbles were removed and
the bottle was completely filled. The BOD bottle lid was secured tightly, while still
submerged.
3. Each bottle was then wrapped in foil and labelled E1 to E5 and with the name of its
corresponding site. The bottles were stored in ice and returned to the laboratory for
testing.
4. At the laboratory, the bottles E1 to E5 were removed from the ice and the initial
dissolved oxygen reading was measured using the LabQuest2 Dissolved Oxygen
probe.
5. Sodium Sulphite solution was used to calibrate the LabQuest2 Probe. The probe was
washed with distilled water and the readings of the samples were then taken.
6. The results were recorded in Table1 as the “initial dissolved oxygen level”.
7. The BOD bottles were then placed in an incubator (dark closet) at around 27 °C for
five days.
Day 5
8. The BOD bottles were removed from the incubator at approximately the same time of
day they were placed into the incubator and the dissolved oxygen was measured
following step 5.
43
Data Collection/Results:
Table 1 – Results of Group 1 showing the level of dissolved oxygen in samples E1 – E5 after
5 days for each site
Site Dissolved Oxygen E1 E2 E3 E4 E5 Average (BOD5) (mg/L)
A Initial (mg/L) 10.8 10.8 10.7 10.9 10.8
Final (mg/L) 3.4 3.7 3.3 3.6 3.4
BOD5 (mg/L) 7.4 7.1 7.4 7.3 7.4 7.32
B Initial (mg/L) 11.3 11.2 10.9 11.1 11.1
Final (mg/L) 5.2 4.4 4.3 4.7 4.5
BOD5 (mg/L) 6.1 6.8 6.6 6.4 6.6 6.50
C Initial (mg/L) 11.1 11.1 11.3 11.1 11.2
Final (mg/L) 3.9 3.8 3.8 3.6 3.8
BOD5 (mg/L) 7.2 7.3 7.5 7.5 7.4 7.38
D Initial (mg/L) 8.3 8.7 8.5 8.5 8.7
Final (mg/L) 2.3 2.4 2.8 2.9 2.2
BOD5 (mg/L) 6 6.3 5.7 5.6 6.5 6.02
Data Analysis:
BODE1 = Final Dissolved Oxygen (mg/L) – Initial Dissolved Oxygen (mg/L)
BOD5 =
𝐵𝑂𝐷 𝐸1 +𝐵𝑂𝐷 𝐸2 +𝐵𝑂𝐷 𝐸3 +𝐵𝑂𝐷 𝐸4 +𝐵𝑂𝐷 𝐸5
5
mg/L
The results for the values of BODE1 – BODE5 and BOD5 are shown in Table1 above.
Discussion: This lab was done to determine the Biochemical Oxygen Demand of the water
samples taken from each of the four coastal zones visited. In a “healthy” body of water,
oxygen is replenished quicker than it’s used by aquatic organisms. However, in some bodies
of water, aerobic bacteria decompose such a vast volume of organic material, that oxygen is
depleted from the water faster than it can be replaced. The resulting decrease in dissolved
oxygen is known as the Biochemical Oxygen Demand (BOD). Also, oxygen is vital to
aquatic species as they use it to build energy through respiration. Dissolved oxygen is the
form of oxygen accessible to aquatic organisms.
After testing, it was found that the average level of BOD in sites “A”, “B”, “C” and “D” was
calculated to be 7.32mg/L, 6.50mg/L, 7.38mg/L and 6.02mg/L respectively. A level of BOD
between 6mg/L – 9mg/L indicates that the water is contains lots of organic material and
bacteria. Furthermore, to prevent reductions in growth and disease resistance, the dissolved
oxygen concentration in tilapia ponds should be kept at 1 mg/L. Therefore, it can be deduced
that the water in the four sites “A”, “B” and “C” and “D” contained a lot of organic material
44
and bacteria, and was not suitable for the optimum growth of tilapia and would thus reduce
their ability to resist diseases.
Conclusions: The BOD5 levels of the four visited sites were investigated and determined.
The BOD5 levels of the sites “A”, “B”, “C” and “D” were 7.32mg/L, 6.50mg/L, 7.38mg/L
and 6.02mg/L respectively. All four sites had unacceptable BOD levels for the optimum
growth of tilapia and maintaining their ability to resist diseases.
Limitations: The resources and time were limited for this experiment and thus a simple
method for the calculation of BOD5- was employed. As such, to obtain a precise measure of
BOD5 it should be conducted over a longer period of time period so that the changes can be
better observed, thus resulting in a clear cut representation of the various levels present in the
water.
Lab: 2
Date: The lab was done on the same dates the site visits were carried out
45
Title: Temperature, pH, Nitrates, Turbidity, Salinity and Ammonium
Aim: To determine the Temperature, pH, Nitrates, Turbidity, Salinity and Ammonium level
of all four sites.
Materials and Apparatus:
1. Vernier LabQuest 2 interface
2. Vernier pH Sensor
3. Vernier Temperature Probe
4. Nitrate Ion-Selective Electrode
5. Vernier Turbidity Sensor
6. Wash Bottle
7. Distilled Water
8. Sample water from each site
Procedure:
1. Water samples were collected at each of the visited sites by placing the water bottles
under water for 1 minute, until all the air bubbles were removed. The lid of the bottle
was then tightened quickly under water. The bottle was then labelled “Bottle A” with
the name of its corresponding site. The bottles were then taken back to the laboratory
for testing.
2. The laboratory technician pre-standardised each probe before testing the samples.
3. Each sample was tested in succession for Temperature, Turbidity, pH, Nitrates,
Ammonia and Salinity. For each test the relevant probe was connected to the
LabQuest2 interface and placed into Sample Bottle A and the reading recorded in
Table 1.
4. Between each test the probes were washed and securely stored away.
Data Collection/Results:
Table 1 – Results showing the values obtained for pH, Turbidity, Nitrates and
Temperature at the four sites
Site pH Temperature
(°C)
Ammonium
NH4+ -N (mg/L)
Turbidity
(NTU)
Nitrates
(mg/L)
Salinity
(ppt)
A 7.31 24.44 0.8 18 8.9 1.2
B 7.73 27.43 0.7 23 12.7 1.1
C 7.84 24.50 0.9 25 6.4 1.3
D 7.33 25.73 0.8 27 9.8 1.3
Discussion: This lab was done to determine the Temperature, pH, Nitrates, Turbidity,
Salinity and Ammonium level of the water samples taken from each of the four sites visited.
Temperature refers to the degree of heat and is a measure of the average heat or thermal
energy of the particles in a substance. Many aquatic organisms are cold blooded and have
46
their own specific optimum temperature. The growth rate of tilapia is best between a
temperature of 220C and 290C. It was determined that the temperatures of the samples of
water for sites “A”, “B”, “C” and “D” were 24.440C, 27.430C, 24.500C and 25.730C
respectively. These temperatures were within the range required for the standard living of
tilapia and as such the temperatures were not harmful to them.
Also, aquatic organisms are extremely sensitive to the pH of their environment. The growth
rate of tilapia is best between a pH of 7 – 9. If the pH of the water isn’t at this optimum range,
the tilapia won’t be able to survive and reproduce and may eventually die. The pH scale
ranges from 0 – 14 with a pH of 7 being neutral, a pH of less than 7 being acidic and a pH of
above 7 being basic. It was found that the pH of the samples of water for each site “A”, “B”,
“C” and “D” was 7.31, 7.73, 7.84 and 7.33. Thus, it can be inferred that the pH of the water
of the four sites visited was relatively neutral and was appropriate for the survival and
reproduction of tilapia.
Additionally, another parameter which was tested was turbidity. Turbidity refers to the
measure of water’s lack of clarity. Water with high turbidity is cloudy, whereas water with
low turbidity is clear. For aquatic life, turbidity levels should be less than 25 NTU. It was
detected that the values of Turbidity of the samples of water for the sites “A”, “B”, “C” and
“D” were 18, 23, 25 and 27 NTU respectively. With respect to sites “A”, “B” and “C”, the
turbidity was within the required range and as such the water was clear, allowing light to
enter which thus allowed for the growth and reproduction of tilapia. In contrast, the turbidity
of coastal zone “D” was slightly higher than acceptable. This therefore indicates that there
was a limitation in light penetration into the water, which may cause a decrease in the
dissolved oxygen levels and can suffocate the tilapia and other aquatic organisms which live
there, which may eventually result in death.
Furthermore, nitrates, NO3-, which are soluble in water, are an essential source of nitrogen
required by plants and animals to synthesize amino acids and proteins. The acceptable nitrate
level in water for tilapia growth is below 10 mg/L, however, toxicity only occurs at levels
above 25 mg/L. This is because, above this level, there is an increase in plant growth and
decay, promotion of bacterial decomposition and a decrease in oxygen levels in water, which
may kill the tilapia and other aquatic organisms which live there. It was found that the Nitrate
level of the samples of water for the sites “A”, “B”, “C” and “D” were 8.9mg/L, 12.7mg/L,
6.4mg/L and 9.8mg/L respectively. As such, the nitrate level of the water samples from sites
“A”, “C” and “D”, were within the appropriate range. Even though the nitrate level at site
“B” was slightly higher than the acceptable level, it wasn’t high enough to result in toxicity.
Therefore, the nitrate level at all sites would have allowed the tilapia to grow and reproduce
efficiently.
In addition, salinity was another tested parameter. Salinity is the measure of all the salts
dissolved in water, and the ideal salinity for tilapia growth is 15ppt and under. It was
determined that the level of salinity in the water in sites “A”, “B”, “C” and “D” was 1.2ppt,
1.1ppt, 1.3ppt and 1.3ppt respectively. As such, the salinity level of the water sample from
the four visited sites was within the acceptable range, thereby allowing for the optimum
growth of tilapia.
Lastly, ammonium, a compound made of nitrogen and hydrogen, occurs in two forms –
unionized (NH3) and ionized (NH4+). Unionized ammonia is toxic to tilapia and high levels
47
would eventually cause death. The concentration of unionized ammonia in water for the
efficient survival of tilapia should be below 0.6mg/L. However, ionized ammonia occurs in
the form of ammonium and isn’t toxic to tilapia. From the results obtained, it was deduced
that the ammonium level at sites “A”, “B”, “C” and “D” was 0.8mg/L, 0.7mg/L, 0.9mg/L and
0.8mg/L respectively. These values were low enough so that it would not have produced
unionized ammonia as aforementioned, and thus would not be toxic to the tilapia, therefore
allowing them to comfortably survive.
Conclusions: The Temperature, pH, Nitrates and Turbidity of the water from the four visited
sites were investigated and determined. Sites “A”, “B”, “C” and “D” were within the required
ranges for Temperature, which was 24.440C, 27.430C, 24.500C and 25.730C respectively,
pH, which was 7.31, 7.73, 7.84 and 7.33 respectively and Salinity, which was 1.2ppt, 1.1ppt,
1.3ppt and 1.3ppt respectively. The turbidity level of the four site was 18, 23, 25 and 27 NTU
respectively. Sites “A”, “B” and “C” had an acceptable level of turbidity whereas site “D”
had a value which was slightly higher than the acceptable level. The level of Nitrates found in
the four sites “A”, “B”, “C” and “D” was 8.9mg/L, 12.7mg/L, 6.4mg/L and 9.8mg/L
respectively. The nitrate level of sites “A”, “C” and “D” was within the acceptable range,
however, despite the level at site “B” being slightly over the acceptable range, it wasn’t high
enough to be toxic to the fish. Therefore, the nitrate level at all four sites would have been
appropriate for the survival of tilapia. The Ammonium level at sites “A”, “B”, “C” and “D”
was 0.8mg/L, 0.7mg/L, 0.9mg/L and 0.8mg/L respectively. These levels were low and would
not be toxic to the tilapia, thus allowing them to grow and reproduce efficiently.
Limitations: To obtain a specific evaluation of whether or not the water quality was ideal for
the growth and survival of tilapia, these parameters should be collected over a longer period
of time to allow the true levels and fluctuations to be seen.
Lab: 3
Date: The lab was done on the same dates the site visits were carried out
Title: Total Solids
48
Aim: To determine the level of Total Solids present in the water sample collected for all four
sites.
Materials and Apparatus:
1. Analytical balance (0.001g)
2. Drying oven
3. Tongs
4. 100mL graduated cylinder
5. Four (4) 250mL beakers
6. Sample water from each site
Procedure:
1. Water samples were collected at each of the visited sites by placing the water bottles
under water for 1 minute, until all the air bubbles were removed. The lid of the bottle
was then tightened quickly under water. The bottle was then labelled “Bottle B” with
the name of its corresponding coastal zone. The bottles were then taken back to the
laboratory for testing.
2. A measuring cylinder was used to measure and pour 200 cm3 of sample water from
each site into each of the pre-dried and weighed 250mL beakers.
3. The beakers were placed in a drying oven at a 100 °C until the following day.
4. The beakers were then removed and placed in a desiccator until they were cooled to
room temperature.
5. Each beaker was weighed to determine the difference by mass.
6. The results were tabulated in Table 1.
Data Collection/Results:
Table 1: Results showing the Total Solids present in each water sample collected at the various
sites.
Site Mass of
empty beaker
(g)
Mass of
beaker plus
solids (g)
Mass of
Solids (g)
Mass of
Solids (mg)
Total
Volume (L)
Total Solids
(mg/L)
A 97.850 97.865 0.015 15 0.2 75
B 95.950 95.968 0.018 18 0.2 90
C 103.550 103.567 0.017 17 0.2 85
D 96.995 97.011 0.016 16 0.2 80
Discussion: This lab was done to determine the level of Total Solids present in the water
samples taken from each of the sites visited. Total Solids is a measure of all the suspended,
colloidal, and dissolved solids in a sample of water. It was detected that the level of Total
Solids of the samples of water for the four sites “A”, “B”, “C” and “D” were 75, 90, 85 and
80 respectively. As such, it can be inferred that all four sites contained a high level of
suspended, colloidal and dissolved solids. This may endanger the tilapia live there since a
49
high level of Total Solids causes a decrease in the photosynthetic rate and also reduces water
clarity.
Conclusions: The levels Total Solids present in the four visited sites were investigated and
determined. The levels of total solids of sites “A”, “B”, “C” and “D” were 75, 90, 85 and 80
respectively. All sites contained high levels of total solids which would endanger the tilapia
and other aquatic organisms which live there.
Limitations: To obtain a specific evaluation of whether or not the water quality was ideal for
the growth and survival of tilapia, the level of Total Phosphates should have been tested for
over a longer period of time to allow the true levels and fluctuations to be seen.
Lab: 4
Date: The lab was done on the same dates the site visits were carried out
50
Title: Total Phosphates
Aim: To determine the level of Total Phosphates in the water sample collected for all four
sites.
Materials and Apparatus:
1. Sample water from each site
2. 0.1M HCl
3. LabQuest 2 Interface
4. 2.63 M H2SO4
5. Vernier Colourimeter
6. 10 mL graduated cylinder
7. Phosphate Standard (10.0 mg/L PO4)
8. 25 mL graduated cylinder
9. one cuvette
10. four 50 mL Erlenmeyer flasks
11. 5.0 M NaOH
12. Hot plate
13. PhosVer 3 Phosphate Powder Pillow
14. Distilled Water
15. Sulphate Powder Pillows
Procedure:
1. Water samples were collected at each of the visited sites by placing the water bottles
under water for 1 minute, until all the air bubbles were removed. The lid of the bottle
was then tightened quickly under water. The bottle was then labelled “Bottle C” with
the name of its corresponding site. The bottles were then taken back to the laboratory
for testing.
2. A 25mL graduated cylinder was used to measure and place 25 mL of sample water
from each site into each flask.
3. Water samples from each facility were mixed as follows –
a) One Sulphate powder pillow was added to each flask and swirled.
b) A 10mL graduated cylinder was used to measure and add 2.0 mL of 2.63M
H2SO4 to each flask swirled.
c) The samples were boiled for 30 minutes while adding small amounts of distilled
water to keep the volume near, but not above 25mL.
d) After 30 minutes, the flasks were removed from the hot plate and allowed to cool.
e) A 10mL graduated cylinder was used to add 2.0mL of 5.0 M NaOH to each flask
and swirled to neutralise the acid.
f) If a flask contained below 25 mL of liquid, the volume was made up to 25mL
using distilled water.
g) One PhosVer3 Phosphate Powder Pillow was added to each sample and
completely dissolved prior to reading on the colourimeter.
4. The phosphate standards and standard curve was already done for us by the
University of Trinidad and Tobago and stored on the LabQuest2 interface for use in
the determination of our sample readings. The data was tabulated in Table 1.
51
5. An empty cuvette was filled ¾ full with distilled water and the lid was sealed to
prepare a blank.
6. The blank was then placed into the vernier colourimeter and the blank button was
clicked on the interfaced.
7. The cuvette was washed after each reading and the samples for each site was then
read on the colourimeter and tabulated in Table 2.
Data Collection/Results:
Table 1 – Results showing the Standards Absorbance Readings
Flask Number 10.0 mg/L
PO4 (mL)
Distilled H2O (mL) Concentration
(mg/L PO4)
Absorbance
1 5 20 2 0.3414
2 10 15 4 0.737
3 15 10 6 0.844
4 20 5 8 1.179
Table 2: Results Showing the Absorbance values for the various Sites
Site Absorbance Total Phosphates Concentration
(mg/L) PO4
Total Phosphorus
Concentration (mg/L- PO4)
A 0.4011 2.35 0.768
B 0.7903 4.63 1.513
C 0.2270 1.33 0.435
D 0.3619 2.12 0.693
Discussion: This lab was done to determine the level of Total Phosphates present in the water
samples taken from each of the four sites visited. Minute amounts of phosphorus are required
for all aquatic plants and algae as it is a vital nutrient to these species. An excess amount
results in eutrophication, the condition whereby there’s an excessive richness in nutrients,
which results in increased plant and algal growth. Eutrophication lowers the levels of
dissolved oxygen in the water and makes the water uninhabitable by many aquatic organisms,
including tilapia.
It was found that the values for the concentration of the Total Phosphates present in the
samples of water for sites “A”, “B”, “C” and “D” was 2.35mg/L, 4.63mg/L, 1.33mg/L and
2.12mg/L respectively. These values were relatively low and as such it would not result in
eutrophication, thus allowing tilapia and other aquatic organisms to live there easily.
Data Analysis:
Calculation of Phosphorus –
Phosphorus (mg/L PO4-P) =
phosphates (mg/L PO4)
3.06
Conclusions: The level Total Phosphates present in the four sites was investigated and
determined. The levels of total phosphates of sites “A”, “B”, “C” and “D” were 2.35mg/L,
4.63mg/L, 1.33mg/L and 2.12mg/L respectively. All four sites zones contained acceptable
levels of total phosphates.
52
Limitations: To obtain a specific evaluation of whether or not the water quality was ideal for
the growth and survival of tilapia, the level of Alkalinity should have been tested for over a
longer period of time to allow the true levels and fluctuations to be seen.
Lab: 5
Date: The lab was done on the same dates the site visits were carried out
53
Title: Alkalinity
Aim: To determine the Alkalinity of the water samples collected for all four sites.
Materials and Apparatus:
1. Sample water from each site (B1)
2. 100 mL graduated cylinder
3. Methyl Orange
4. Wash bottle with distilled water
5. Conical Flask
6. 0.00100 M H2SO4 solution (A1)
7. 50 mL burette
8. 25 cm3 pipette
9. Three 250 cm3 conical flasks
Procedure:
1. Water samples were collected at each of the visited sites by placing the water bottles
under water for 1 minute, until all the air bubbles were removed. The lid of the bottle
was then tightened quickly under water. The bottle was then labelled “Bottle D” with
the name of its corresponding site. The bottles were then taken back to the laboratory
for testing.
2. A1 (H2SO4) was then placed in a burette
3. 25 cm3 of B1 was then pipetted into a conical flask and two drops of methyl orange
indicator was added.
4. This solution was titrated with A1 until it changed colour from yellow to orange/red.
5. Readings were then recorded in Table 1.
6. The concentration of Alkalinity was determined assuming the following reaction –
H2SO4 + CaCO3 →H2O + CO2 + CaSO4
Data Collection/Results:
Table 1: Results showing the Titration of B1 with A1 at the various sites
Site A B C D
Final burette reading / cm3 6 13 20 32
Initial burette reading / cm3 0 6 13 20
Volume of A1 used / cm3 6.1 6.6 7.2 12.0
Table 2: Results showing the Alkalinity level of the various sites
Site Alkalinity (mg/L)
A 33
B 36
C 39
D 31
Discussion: This lab was done to determine the level of Alkalinity present in the water
samples taken from each of the four sites visited. Alkalinity refers to the measure of how
much acid water can neutralize. Alkalinity acts as a buffer as it protects water and its life
54
forms from immediate changes in pH. In order for tilapia to survive, the Alkalinity level
should be maintained between 100 to 250 mg/L. However, it was found that the values for the
level of Alkalinity present in the samples of water for sites “A”, “B”, “C” and “D” were
33mg/L, 36mg/L, 39mg/L and 31mg/L respectively. Thus the Alkalinity level at all four sites
was relatively low and as such the water, the tilapia and the other aquatic organisms which
live there will be highly affected by changes in pH.
Data Analysis:
M1V1 = M2V2
M1 = 0.001 Molar H2SO4
V1 = Volume of H2SO4 titre into the conical flask
M2 = Concentration of CaCO3
V2 = 25 ml
Molar Concentration of CaCO3 (mol dm-3) to Mass Concentration of CaCO3 (g dm-3)
 𝑔/𝑑𝑚−3
𝑜𝑓𝐶𝑎𝐶𝑂3 =
M2
136
 𝑇𝑜 𝑚𝑔/𝑑𝑚−3
=
M2
136 × 1000
Conclusions: The level of Alkalinity present in the four sites were investigated and
determined. The Alkalinity levels of sites “A”, “B”, “C” and “D” were 33mg/L, 36mg/L,
39mg/L and 31mg/L respectively. All sites contained an Alkalinity level which was below
the acceptable range; as a result, this may lead to the death of the tilapia and other aquatic
organisms which live there.
Limitations: To obtain a specific evaluation of whether or not the water quality was ideal for
the growth and survival of tilapia, these parameters should be collected over a longer period
of time to allow the true levels and fluctuations to be seen.
Lab: 6
Date: The lab was done on the same dates the site visits were carried out
55
Title: Bacterial Concentration
Aim: To determine the amount of E. Coli present in the tilapia pond
Materials and Apparatus:
1. 2 sterile sample tubes
2. Autoclave
3. 2 bottles of Total Count (TC)
4. Bleach
5. 2 bottles of Coliscan Easygel
6. Waterproof marker
7. 4 pretreated petri dishes
8. Masking tape or parafilm
9. 2 sterile 3 mL pipettes
Procedure:
Day 1: Collection of Water Samples
1. A waterproof marker was used to label two sterile sample tubes with the site name,
date, and time of collection.
2. The sample water was collected using a sterile technique.
a) The top of the sterile sample tube was opened or the cover was gently peeled off of a
sterile pipette from the bulb end.
b) The sample tube was immersed or the pipette was tipped 5–8 cm below the surface to
collect the sample in the flowing portion of the pond. If a dropper was used, the top of
a sterile sample tube was gently opened and the sample was pipetted into the tube.
Note: it was ensured that the person collecting the sample was standing downstream
from the sample.
c) The cap was carefully placed back on the sample tube; touching the sample was
avoided.
3. Step 2 was repeated for the second sample.
4. Two bottles of Total Count (TC) Easygel® and two bottles of Coliscan Easygel®
were obtained.
5. Each bottle was labelled with the site name and date of sample.
6. Four pretreated sterile petri dishes were obtained and each petri dish was labelled
with the culture type, site name, date, and volume of sample.
7. Using sterile technique, the appropriate volume of water was transferred from the
sample tubes into the bottles of TC Easygel® and Coliscan Easygel®. Note: Proper
sample amount for inoculation depended on the level of contamination of the water
source. Recommended volumes were 0.1–0.5 mL for TC medium and 1.0–5.0 mL
for Coliscan medium.
8. Using sterile technique, the bottles were gently swirled to distribute the sample in
the medium.
9. Each bottle of medium was opened and poured into the correctly labeled petri
dishes. The lids were placed back on each of the petri dishes immediately.
10. The petri dish was gently swirled in a circular motion to evenly distribute the media
on the bottom of the dish.
56
11. The plates were allowed to sit undisturbed in order to allow the media to gel. This
took 45–60 min.
12. Steps 4–11 were repeated for the remaining samples.
13. Once the media was gelled, the petri dishes were stacked upside down and
incubated for 24 hours at 35°C. If no incubator was available, the dishes were
placed in a warm area in the room and covered with a towel. The dishes were
incubated at room temperature for 30–48 hours. Note: The petri dishes were
stacked upside down before they were incubated.
14. Day 2: Counting Colonies and Calculations
15. When the petri dishes were incubated for at least 24 hours, they were removed from
the incubator. The dishes were kept upside down so condensation that was formed
on the lid did not drip onto the culture. Note: If dishes were incubated at room
temperature, they were incubated for 30–48 hours. Plates were not counted past 48
hours.
16. While the plate was upside down, the colonies on the Total Count dish were
counted. Very small or “pin-point” colonies (smaller than a period) were not
counted. Note: It was easier to count a quarter or a half of the culture and then
multiply to get an estimated colony count.
17. The number of colonies on the Total Count dish was recorded in Table 1.
18. All the purple colonies on the Coliscan dish were counted. Any white or light blue
colonies were not counted. Again it was ensured that the plate was upside down
and pin-point colonies were not counted.
19. The number of purple colonies as E. coli colonies was recorded in Table 1.
20. All the red, pink, and purple colonies on the Coliscan dish were counted. Any white
or light blue colonies were not counted. It was ensured that the plate was upside
down and pin-point colonies were not counted.
21. The number of red, pink, and purple colonies as coliform colonies was recorded in
Table 1.
22. Steps 15–20 were repeated for the second sample collected.
Calculations:
1. The equation below was used to determine the concentration of bacteria per
100 mL for each sample collected. The values were recorded in Table 2.
2. Once the concentrations were calculated for each sample, the two values
were averaged together to determine the average concentration of bacteria
per 100mL. The average values were recorded in Table 2.
Data Collection/Results:
57
A dilution factor of 1:6 was made as 1:1 to 1:5 resulted in Too many to Count (TMC) for
each plate. Adjustments were made prior by the technician who advised a 1:8 dilution be
used.
Table 1: Results showing the Total Colonies of each site
Site Medium type Inoculation
volume
Total count Coliscan – red,
pink, & purple
(coliforms)
Coliscan –
purple (E. colt)
1
Count for
Sample 1
1 167 103 64
Count for
Sample 2
1 177 108 69
Average 172 105.5 66.5
2
Count for
Sample 1
1 180 107 73
Count for
Sample 2
1 184 112 72
Average 182 109.5 72.5
3
Count for
Sample 1
1 185 110 75
Count for
Sample 2
1 187 114 73
Average 186 112 74
4
Count for
Sample 1
1 197 113 84
Count for
Sample 2
1 201 123 78
Average 199 118 81
Table 2: Results showing the Colonies per 100 mL of Water
Medium type Site 1 Site 2 Site 3 Site 4 Average
(colonies/100
mL)
Total count 172 182 186 199 1.85E+08
Coliscan – purple (E.
coli)
66.5 72.5 74 81 7.35E+07
Coliscan – red, pink, &
purple (coliforms)
105.5 109.5 112 118 1.11E+08
Total Coliform /100 ml
per site
8.60E+07 9.10E+07 9.30E+07 9.95E+07
Discussion: This lab was done to determine the amount of E. Coli present in the water
samples taken from each of the four sites visited. E-coli is a form of faecal coliform which
originates from the faeces of humans or animals. It is an indication of the level of pollution in
a tilapia pond because coliforms are not the normal flora of bacteria in fish. Even though it
doesn’t not directly harm the tilapia, it can harm persons who consume the infected fish. It
58
was found that the total coliform per 100mL of sites “A”, “B”, “C” and “D” was 8.60E+07,
9.10E+07, 9.30E+07 and 9.95E+07 respectively. These values were similar and relatively
high, thus indicating that the pond in general was highly polluted. Even though the tilapia
may survive in the pond, if they are consumed by humans, it may result in infections and
illness.
Conclusions: The level of E-Coli, a form of Faecal Coliform, present in the four sites were
investigated and determined. The Faecal Coliform per 100mL levels of sites “A”, “B”, “C”
and “D” were 8.60E+07, 9.10E+07, 9.30E+07 and 9.95E+07 respectively. Tilapia may
survive with these levels, however if they are consumed by humans, it may result in health
issues to the persons.
Limitations: To obtain a specific evaluation of whether or not the water quality was ideal for
the growth and survival of tilapia, the level of E-Coli should have been tested for over a
longer period of time to allow the true levels and fluctuations to be seen.

CAPE Environmental Science IA Unit 2

  • 1.
    AN INVESTIGATION ONTHE REARING PRACTICES OF TILAPIA IN THE LA VEGA ESTATE POND, GRAN COUVA, TRINIDAD NAME: SHARANA MOHAMMED SUBJECT: ENVIRONMENTAL SCIENCE I.A. UNIT 2 SCHOOL: PRINCES TOWN WEST SECONDARY YEAR: 2015 - 2016
  • 2.
    Table of Contents Acknowledgements...................................................................................................................... 1 Introduction .................................................................................................................................2 Scope....................................................................................................................................... 2 Purpose....................................................................................................................................2 Literature Review......................................................................................................................... 4 Methodology.............................................................................................................................. 14 Activities and Data Collection ................................................................................................. 14 Laboratory Tests..................................................................................................................... 15 Presentation and Analysis............................................................................................................ 17 Laboratory Tests......................................................................................................................... 17 Discussions of Findings .............................................................................................................. 24 Conclusions ............................................................................................................................... 26 Recommendations ...................................................................................................................... 27 Bibliography .............................................................................................................................. 28 Appendices ................................................................................................................................ 29 Appendix 1 ................................................................................................................................ 29 Site Visits ........................................................................................................................... 29 Appendix 2............................................................................................................................. 41 Laboratory Entries............................................................................................................... 42
  • 3.
    1 Acknowledgements Completing this IAgave me a sense of fulfilment and I would like to thank the following people for their contributions. Firstly, I would like to thank God for giving me wisdom and the serenity needed in completing this project. My gratitude goes to my Environmental Science teacher for his guidance and assistance in completing this project diligently. Sincere thanks goes to my parents for supporting me and giving me much needed help when necessary. Lastly, I pay gratitude to the authors of the various websites via the internet services which allowed me to obtain vital information needed for this Internal Assessment.
  • 4.
    2 Introduction Tilapia is anAfrican freshwater cichlid fish that is grown mainly in the wild. These fish are attractive, easily bred, hardy and resistant to disease and, can live in a wide range of water conditions. They can be stocked at high densities and feed on both prepared rations and natural foods. Also, their flesh is firm and of excellent eating quality, as they contain numerous health benefits, which include a rich source of nutrients, vitamins, and minerals, including significant amounts of protein, omega-3 fatty acids, selenium, phosphorous, potassium, vitamin B12, niacin, vitamin B6, and pantothenic acid. Due to these many attributes, tilapia was commercialized as they make an excellent food source (Organic Facts, 2016). In the Caribbean, there’s a wide variety of tilapia present. In the island of Trinidad, tilapia production began in 1951, with the culture of the Mozambique tilapia, “Oreochromis Mossambicus”. The Mozambique tilapia was crossed with other species to produce hybrids, which include the “black tilapia”, “silver tilapia” and various red hybrids, known as the Red Nile Tilapia (Ramnarine & Barrath, 2004). However, the Red Nile, was first introduced to Trinidad from Jamaica in 1985, and is the most common hybrid of the Mozambique tilapia, in Trinidad. It was found to be most suitable for aquaculture in our island and are bred specifically for their bright red and orange hues. These red hybrids are stronger and faster growing than their pure-line parents and due to their bright red colour, they are more attractive and appealing to consumers than their wild caught (Gabbadon , de Souza, & Titus, 2008). However, there are many issues faced with tilapia rearing. Firstly, in a pond, among other species, tilapia are the invasive species, thus affecting the survivability of the other organisms (Hailey, 2015). Additionally, farmed tilapia is less healthy than wild tilapia because reared tilapia is fed an unnatural, unhealthy diet of cheap grains and soy pellets, rather than plankton, plants and algae, and also contain less healthy fatty acids than their wild counterparts. Furthermore, tilapia is at risk of parasitic diseases due to biological factors such as age, stress, poor diet, high stocking densities and environmental factors such as salinity, poor water quality, culture system, as report by Komar & Wendover (2007). Scope This study is focused on the rearing of tilapia in a selected pond in Trinidad. This is done to ascertain the environmental findings of Komar & Wendover (2007) in order to highlight the possible advantages and disadvantages of farmed tilapia as opposed to wild tilapia. Purpose Tilapia is commercialized in the island of Trinidad as it makes an excellent and economical food source. Resulting from this commercialization are attributes such as income and
  • 5.
    3 employment for thecitizens of the country. However, reared tilapia is exposed to a different environment than naturally occurring or wild tilapia. As such, the purpose of this study is to recognize the differences between farmed and wild tilapia and to investigate the ecosystem and pollution level resulting from farmed tilapia as opposed to its wild counterparts.
  • 6.
    4 Literature Review The twomost prominent means of rearing tilapia are via tanks and ponds. Confinement tanks allow tilapia to grow well at high densities, when good water quality is maintained, through aeration and continuous water exchange, to renew dissolved oxygen (DO) supplies and remove wastes. Whereas, pond culture is advantageous as it allows tilapia to utilize natural foods. Pond culture may utilize extensive systems, where only organic or inorganic fertilizers are used, or intensive systems, which makes use of high protein feed, aeration and water exchange. Regardless, in both rearing methods, the optimum water temperature should be maintained at 82-860F; at temperatures below 54°F, tilapia lose their resistance to disease and are subject to infections by bacteria, fungi and parasites (Rakocy & McGinty, 1989). Research Professor at the University of the West Indies, Indar Ramnarine, indicated that, in Trinidad, most tilapia rearing projects use earthen ponds. However, there is a tank culture operation in central Trinidad that utilizes injected oxygen in their system. He further stated that, Caroni (1975) Limited and the Sugarcane Feeds Centre also use concrete and metal tanks, but production from tank culture is limited, and, at the Bamboo Grove Fish Farm, there are four octagonal concrete tanks with a solids removal system (Ramnarine & Barrath, 2004). Tilapia feed can contribute to making the water toxic. Uneaten tilapia food results in undissolved solids, that are suspended in the water or rests on the bottom, which toxifies the water. These solids eventually dissolve in the water, forming dissolved solids. Dissolved solids are partly made up of tilapia feed, that has been broken down into very fine particles, that remain suspended in water and further contributes to the formation of more toxic compounds, such as un-ionized ammonia. The ammonia is consumed by naturally occurring bacteria, known as nitrosomonas, however, these bacteria give off even deadlier compounds, called nitrites that oxidize to nitrates, which further affects the water quality. Furthermore, resulting from the tilapia feed, are other dissolved contaminants, such as tannins and phenols, which decolorizes the water and makes it smell bad, thereby further toxifying the water (Lakeway Tilapia, 2016). In the wild, tilapia consume a diet of algae and various plants, however, farmed tilapia is fed an unnatural, unhealthy diet of GMO corn and soy pellets. When humans consume farmed tilapia, this unnatural diet results in health issues, such as aggravation in the body like asthma, joint inflammation and coronary disease. Another primary ingredient in the feed of farmed tilapia is chicken feces as it’s a cheaper alternative to standard fish food. This results in ten times the normal amount of carcinogenic, or cancer causing, agents as wild tilapia. Another impact resulting from tilapia feed is that it produces eleven times the amount of a lethal substance, dioxin, in the farmed tilapia fish than those in wild (Simple Organic Life, 2015). Additionally, tilapia is deemed healthy due to its richness in the omega-3 fatty acids. However, these acids are greater in wild tilapia than farmed. Due to the farmed tilapia consuming a diet of corn and soy rather than lake plants, they’re rich in omega-6 acids, which studies have been proven to harm the heart and the brain (Eat This, Not That!, 2014). Water quality comprises of physical, biological and chemical parameters that affect the growth and welfare of cultured organisms. It affects the general condition of cultured organisms as it determines the health and growth conditions of these organisms. Quality of
  • 7.
    5 water is, therefore,an essential factor to be considered when planning for high aquaculture production (Mallya, 2007). One of the five basic needs of tilapia is clean water. However, as a result of tilapia rearing, due to factors such as leaching into ponds, the types of feed, and improper waste disposal, is the predicament of the physicochemical characteristics of the pond water being altered and affected. As such, water quality tests are done to quantitatively determine the effects of tilapia rearing on water systems and the environment (eXtension, 2012). These test were – a) Biological Oxygen Demand b) Temperature c) pH d) Turbidity e) Total Solids f) Total Phosphates g) Nitrites h) Alkalinity i) Salinity j) Ammonium ion k) Coliform
  • 8.
    6 Biological Oxygen Demand Essentialfor respiration and decomposition, DO comes from atmospheric oxygen and photosynthesis but because photosynthesis depends on the amount of light available to aquatic plants, it takes time for the oxygen to fully dissolve and for correct levels to be maintained. Tilapia is highly tolerant of low dissolved oxygen (DO) concentrations at concentrations below 0.3 mg/L. However, the DO concentration in tilapia ponds should be kept at 1 mg/L, to prevent reductions in growth and disease resistance. In a “healthy” body of water, oxygen is replenished quicker than it’s used by aquatic organisms. However, in some bodies of water, aerobic bacteria decompose such a vast volume of organic material, that oxygen is depleted from the water faster than it can be replaced. The resulting decrease in dissolved oxygen is known as the Biochemical Oxygen Demand (BOD). Vital nutrients, for example nitrates and phosphates, which stimulate aquatic plant and algae growth, are released via decomposition. If the load of decomposing organic material is excessive, dissolved oxygen levels can be critically diminished. In a body of water with substantial amounts of decaying organic material, the dissolved oxygen levels may decline by 90%, this would represent a high BOD. This can be widely impacted by pollution and therefore needs to be monitored. Table 1 shows the effect of various levels of BOD in the water. Table 1 – The interpretation of BOD Levels BOD Level (mg/L) Status 1-2 Clean water with little organic waste. 3-5 Moderately clean water with some organic waste. 6-9 Lots of organic material and bacteria. 10-20 Very poor water quality. Large amounts of organic material in the water common to treated sewage. 20-100 Untreated sewage or high levels of effluents from industries or high levels of erosion. >100 Extreme conditions. Siltation and stationary water.
  • 9.
    7 Temperature Aquatic organisms areextremely fragile to the temperature of their environment. The growth rate of tilapia is best between a temperature of 220C (72F) and 290C (84F). If the temperature of the water isn’t at this optimum range, the tilapia won’t be able to survive and reproduce and may eventually die. Therefore, the measure of the temperature of the water is very important as an indication of water quality. Table 2 shows the cause and effect relationship with changes in temperature. Table 2 – The causes and effects of changes in water temperature Changes in Water Temperature Causes Effects - Air Temperature - Solubility of dissolved oxygen - Amount of shade - Rate of plant growth - Soil erosion from increasing turbidity - Metabolic rate of organisms - Thermal pollution from human activities - Resistance in organisms
  • 10.
    8 pH Aquatic organisms areextremely fragile to the pH of their environment. The growth rate of tilapia is best between a pH of 7 – 9. If the pH of the water isn’t at this optimum range, the tilapia won’t be able to survive and reproduce and may eventually die. Therefore, the measure of the pH of the water is very important as an indication of water quality. The factors that affect pH can be seen in Table 3. Table 3 – Factors that affect pH levels Factors Affecting pH Levels - Acidic rainfall - Algal blooms - Level of hard-water minerals - Releases from industrial processes - Carbonic acid from respiration or decomposition - Oxidation of sulphides in sediments
  • 11.
    9 Turbidity Turbidity is ameasure of the transparency of water, and one of the main contributors to it in a tilapia pond is phytoplankton. If phytoplankton are allowed to grow to very high density, a high turbidity results. This is because an abundance of plankton discolours water and reduces sunlight penetration. Water with high turbidity is cloudy, whereas water with low turbidity is clear. A high turbidity is as a result of light reflecting off of particles in the water thus resulting in the cloudiness. As such, the more particles in the water, the higher the turbidity. Also, the rate of photosynthesis will decrease due to this because a high turbidity will decrease the amount of sunlight that’s able to penetrate the water. When the water is cloudy, sunlight will warm it more efficiently because the suspended particles in the water absorb the sunlight, warming the surrounding water. This may lead to many issues linked to increased temperature levels. Therefore, the Turbidity of a beach needs to be measured to guarantee it doesn’t produce unwanted effects as shown in Table 4. Table 4 – The sources and effects of turbidity in coastal waters Change in Water Temperature Source Effect - Soil erosion – silt & clay - Reduces water clarity - Urban runoff - Aesthetically displeasing - Industrial waste – sewage treatment effluent particulates - Decreases photosynthetic rate - Abundant bottom dwellers – stirring up sediments - Increases water temperature - Organics – microorganisms & decaying plants & animals Total Solids A measure of all the suspended, colloidal, and dissolved solids in the water is known as Total solids, TS. This includes dissolved salts for example, sodium chloride, NaCl, and solid particles such as silt and plankton. Total solids have the same impacts as Turbidity and are described in Table 4.
  • 12.
    10 Total Phosphates Phosphorus isa vital nutrient for other species present in the tilapia ponds such as aquatic plants and algae. However, only a minute amount is necessary, therefore, an excess can easily occur. An excess amount is classified as a pollutant as it results in eutrophication, the condition whereby there’s an excessive richness in nutrients, such as phosphorous, which results in increased plant and algal growth. Eutrophication can lower the levels of dissolved oxygen in the water and can make the water uninhabitable by the tilapia. Phosphorus is frequently the limiting factor that controls the extent of eutrophication that occurs. Table 5 shows the sources and effects of phosphate levels in water. Table 5 – The sources and effects of phosphate levels in water Phosphate levels Source Effect - Human and animal wastes - High levels of – eutrophication, increased algal bloom, increased BOD, decreased DO - Industrial wastes - Low levels – limiting factor in plant and algal growth - Agricultural runoff - Human disturbance of land
  • 13.
    11 Nitrites Nitrites are anessential source of nitrogen required by plants and animals to synthesize amino acids and proteins. Nitrate levels below 10mg/L are not directly toxic to tilapia. However, it becomes toxic when levels exceed 25 - 30 mg/L, and as a result may lead to death of the tilapia. Nitrate pollution, caused by fertilizer runoff and concentration of livestock in feedlots, has also become a major ecological issue in tilapia farms. Table 6 shows the sources of nitrate ions in surface water. Table 6 – Sources of Nitrate Ions Sources of Nitrate Ions - Agriculture runoff - Urban runoff - Animal feedlots and barnyards - Municipal and industrial wastewater - Automobile and industrial emissions - Decomposition of plants and animals Alkalinity A measure of how much acid water can neutralize is known as the Alkalinity of water. Alkalinity levels should be maintained at 100 to 250 mg/L, and it acts as a buffer, protecting the water from immediate changes in pH. This ability to neutralize acid, is vital in ensuring the survival of reared tilapia. Table 7 shows the effect of alkalinity to surface water. Table 7 – The effects of alkalinity levels Effects of Alkalinity Levels - Buffers water against sudden changes in pH - Protects aquatic organisms from sudden changes in pH
  • 14.
    12 Salinity Salinity is themeasure of all the salts dissolved in water. All tilapia are tolerant to brackish water. The tolerance of tilapia to salinity depends on the type of species, strains, size, adaptation time and environmental factors. However, the ideal salinity for tilapia growth is up to 15 ppt. Ammonia Ammonia, NH3, is a compound composed of nitrogen and hydrogen molecules. The levels of ammonia have a strong impact on the water quality for tilapia, and levels which are two high may result in the death of tilapia. Ammonia exists in two forms – unionized ammonia, NH3, and ionized ammonia, NH4+. Unionized ammonia most toxic to tilapia, especially those which are smaller in size. Both ammonia and ammonium are present in the water at all times, and the percentage is influenced by temperature and pH. Warmer water, higher pH values and low levels of dissolved oxygen concentrations favor unionized ammonia which is more toxic. Table 8 – The consequences of ammonia levels Ammonia level (mg/L NH3-N) Consequence <0.6 Preferred ammonia level for tilapia 0.6 – 2.0 Lethal concentration for tilapia 1.0 Concentrations as low as 1.0 mg/L NH3 –N will decease growth and performance in tilapia >2.0 Tilapia start to die Coliform Both fresh and brackish water fishes can harbour human pathogenic bacteria, specifically the coliform group. Faecal coliforms, e.g. “Escherichia coli” which originates from faeces of warm blooded animals, in fish indicate the level of pollution of their environment because coliforms are not the normal flora of bacteria in fish. Since these bacteria originate from the wastes of animals or humans, high numbers of E. coli in a pond may come from septic systems, runoff from barnyards, or from wildlife. The enteric bacilli include E. coli, Klebsiella spp., Citrobacter spp., Enterobacter spp., Serratia spp., and Edwarsiella spp. However, in Trinidad, bacterial density in rearing ponds has never been reported, therefore, the present test was used to investigate the occurrence of coliforms reared in ponds so that it could be used as a standard for further studies on fish quality. The highlighted concern with this method of the rearing of tilapia is that, if it is not done within the prescribed parameters of the pond size and fish density, it may result in the fish becoming contaminated with a virus or human pathogenic bacteria. Araujo et al (1989) found that there was a strong link between the presence of coliforms between 9 to 107 cfu/100 ml
  • 15.
    13 and these humanpathogens in fresh water with average presence of 102–109 cfu/100 ml. Further, Madal et al (2009), found a strong correlation between the absorption of these microbia into the tilapia fish posing a threat to health and safety of humans.
  • 16.
    14 Methodology Activities and DataCollection For this study, various tilapia ponds were visited in Trinidad. The population size of the tilapia in the pond was determined by using the ecological sampling method of “mark, release, recapture” was utilized. Firstly, the tilapia was captured, after which, it was carefully tagged. It was then released back into the pond and recaptured once more. The equation 𝑃𝑜𝑝𝑢𝑙𝑎𝑡𝑖𝑜𝑛 𝐸𝑠𝑡𝑖𝑚𝑎𝑡𝑒 ( 𝑁) = (Total Number Captured,Marked & Released (n1) ) x (Number Captured (n2)) 𝑇𝑜𝑡𝑎𝑙 𝑁𝑢𝑚𝑏𝑒𝑟 𝐶𝑎𝑝𝑡𝑢𝑟𝑒𝑑 𝑤𝑖𝑡ℎ 𝑀𝑎𝑟𝑘 (𝑛3)) was used to calculate the overall population, whereby N was the total population, n1 was the number of tilapia captured, marked and released, n2 was the total number captured on the second occasion and n3 was the number of marked tilapia recaptured. Additionally, upon capturing the tilapia, their size was measured, and their general colour was observed. Overall, the aforementioned processes were done so that the findings could be compared to the data from the Literature Review, in order for generalizations about the various aspects of tilapia to be made. Furthermore, water samples were collected from each site and water quality tests were done on these samples. This is because, water plays an essential role in the sustainability of tilapia, since they need clean water to survive and to produce a healthy fish. Various factors, such as the type of feed, and pollution, would affect the physicochemical characteristics of the pond water, thereby altering its natural balance. As such, water quality tests were done to quantitatively determine the effects of tilapia rearing on water quality.
  • 17.
    15 Laboratory Tests Water qualitytests will give information about the “health” of the pond water. By testing water over a period of time, the alterations in the quality of the water can be seen. However, due to the limitation of time with the borrowed equipment, reagents and time only one set of tests could have been performed for each site visited. The parameters that were tested in this project included temperature, pH, turbidity, nitrites, phosphates, BOD5, alkalinity, coliform, ammonia and salinity. A qualitative visual assessment of the aquatic system was also carried out. A LabQuest2 water quality testing package, provided by the University of Trinidad and Tobago, Agricultural and Food Technology Department, was used to test the water quality parameters. The LabQuest2 water quality testing kit included probes for testing water, temperature, pH, turbidity, nitrates, phosphates, BOD and alkalinity. The LabQuest2 is a portable, hand held device, to which various probes are used to determine the properties of the sampled water. At each site, each group of the three groups collected four (4) water samples using plastic bottles from the water of the beach. These bottles were labelled A to D. In addition to the four water samples taken, another five (5) samples were taken using glass bottles to test for BOD5, these bottles were labelled E1 to E5. The water samples were collected by completely submerging the bottles into the water and allowing water to fill up to the “mouth” of the bottle. After this, the lid was quickly fastened on the bottle, while it was still under water. The bottles were then packaged and transported to the laboratory. This method of sampling was done for all the sites visited. Each sample set was then brought to the laboratory for testing using the LabQuest2 to obtain the following readings of – Biochemical Oxygen Demand – Bottles E1 to E5 which were stored in ice and wrapped in foil were used for this. The dissolved oxygen levels present on the initial day and at the end of the five day period were measured using the Dissolved Oxygen Sensor. The difference and average was then determined as the BOD5. (Refer to Lab 1) Temperature. – The Stainless Steel Temperature Probe was placed into bottle “A” and after the temperature stabilized on the interface, the reading was recorded. (Refer to Lab 2) pH – The pH Sensor Probe was placed into bottle “A” and swirled until a reading of the pH was stabilised on the interface and the reading was recorded. (Refer to Lab 2) Nitrites – The nitrate-ion concentration in the water sample from bottle “A”, in mg/L NO2, was measured by placing the electrode from the Nitrite Ion-Selective Electrode into the bottle. The reading was then recorded. (Refer to Lab 2) Turbidity – The Turbidity in NTU was determined using the Turbidity Sensor. Water from sample bottle “A” was poured into a cuvette and placed into the Turbidity Sensor. The reading was then recorded. (Refer to Lab 2)
  • 18.
    16 Salinity - TheSalinity of the water samples was determined by placing a salinity sensor in each water sample to determine the total dissolved salt content in each solution. (Refer to Lab 2) Ammonia - After standardization, an ammonium ion select probe was placed in each water sample to determine the ammonium ion concentration of each sample. (Refer to Lab 2) Total Solids – A precise amount of water from Bottle “B” was measured and placed into a clean, dried and weighed beaker. A drying oven was then used to evaporate the water and the beaker was reweighed. The difference between the final and initial mass the total solids was calculated. Calculations were also made to convert the mass to mg/L total solids. (Refer to Lab 3) Total Phosphates – A colorimeter was used to create a 4-point standard curve of phosphate absorbance vs concentration, by using a set of four phosphate standards. The water sample from bottle “C” was then poured into the cuvette and placed into the colorimeter to determine its absorbance. The concentration of the total phosphates was deduced from the graph, using the absorbance of the water sample. (Refer to Lab 4) Alkalinity – Alkalinity of the water samples was determined by titrating 0.001M sulphuric acid against the water sample in Bottle “D”, using a methyl orange indicator to determine the end point of the reaction. At the end point of the reaction, the alkalinity was determined using the stoichiometric ratio between sulphuric acid and calcium carbonate. (Refer to Lab 5) Coliform - To determine the level of E-Coli present at each site, a plate count using agar was done, after seven serial dilutions. (Refer to Lab 6)
  • 19.
    17 Presentation and Analysis LaboratoryTests Graph 1 – From the graph above it is observed that as the level of Total Solids increases, the level of Biological Oxygen Demand and Turbidity also increases. Site B had the highest level of Total Solids which was 90mg/L, whilst Site A had the lowest which was 75mg/L. The BOD level at Site C was the highest, which was 7.38mg/L and Site D was the lowest, at 6.02mg/L. Site D had the highest Turbidity level which was 27NTU, whereas Site A had the lowest level, which was 18NTU. 0 10 20 30 40 50 60 70 80 90 100 A B C D AverageBOD(mg/L),TotalSolids(mg/L),and Turbidity(NTU) Site Graph Showing The BOD (mg/L), Total Solids (mg/L) and Turbidity (NTU) LevelAt Each Site BOD (mg/L) Total Solids (mg/L) Turbidity (NTU)
  • 20.
    18 Graph 2 – Fromthe graph above it is observed that as the level of Salinity increases, the level of Biological Oxygen Demand also increases. The Salinity level at Sites C and D are the highest with a value of 1.3ppt, whilst Sites A and B had similar levels which were 1.2ppt and 1.1ppt respectively. The BOD level at the four sites ranged between 6.02mg/L and 7.38mg/L. 0 1 2 3 4 5 6 7 8 A B C D AverageBOD(mg/L)andSalinity(ppt) Site Graph Showing The BOD (mg/L) and Salinity (ppt) Level At Each Site BOD (mg/L) Salinity (ppt)
  • 21.
    19 Graph 3 – Thegraph above indicates that there were fluctuations among the levels of Nitrates and Phosphates present at the sites; site B had the highest level of Nitrates (12.7mg/L) and Phosphates (4.63mg/L). The pH values of the four visited sites were fairly similar with values ranging between 7.31 – 7.84. 0 2 4 6 8 10 12 14 A B C D Level of Total Phosphates (mg/L), Nitrates (mg/L), pH Site Grah Showing The Total Phosphates (mg/L), Nitrates (mg/L) and pH Level At Each Site Total Phoshates (mg/L) Nitrates (mg/L) pH
  • 22.
    20 Graph 4 – Theabove graph shows that when the Alkalinity level in water is high, the Nitrate level is low. Site C had the highest Alkalinity level at 39mg/L, and therefore the lowest Nitrate level at 6.4mg/L. In contrast, Site D had the lowest Alkalinity level, which was 31mg/L and a Nitrate level of 9.8mg/L. The Ammonium level at all sites were similar ranging between 0.7mg/L – 0.9mg/L. 0 5 10 15 20 25 30 35 40 45 A B C D LevelofAlkalinity(mg/L)andNitrates(mg/L) Site Graph Showing The Alkalinity (mg/L) And Nitrate (mg/L) Level At Each Site Nitrate (mg/L) Alkalinity (mg/L) Ammonium (mg/L)
  • 23.
    21 Graph 5 – Fromthe graph above it is observed that as Temperature increases, the level of Biological Oxygen Demand also increases. At each site, the temperature and BOD levels were fairly similar, ranging between 24.440C – 27.430C and 6.02mg/L – 7.38mg/L respectively. 0 5 10 15 20 25 30 A B C D LevelBOD(mg/L)andTemperature(0C) Site Graph Showing The Temperature (0C) And BOD (mg/L) LevelAt Each Site Temperature BOD
  • 24.
    22 Graph 6 – Thegraph above shows that the Coliform value was 1.11E+08, which was higher than the value of E. Coli which was 7.35E+08. The Total Count of both values was 1.85E+08. 1.85E+08 7.35E+07 1.11E+08 Donut Chart Showing The Average Colonies/100mL Total Count Coliscan - purple (E.coli) Coliscan - red, pink & purple (coliforms)
  • 25.
    23 Graph 7 – Theabove graph shows that sites A, B, C and D had relatively similar Total Coliform values, ranging between 8.60E+07 - 9.95E+07. 8.60E+07 9.10E+07 9.30E+07 9.95E+07 Pie Chart Showing The Total Coliform per 100mL of Water At Each Site A B C D
  • 26.
    24 Discussions of Findings Theresults of the tests indicated that each site had a moderate level of Biological Oxygen Demand ranging between 6.02 – 7.38. Aquatic organisms obtain oxygen in the form of dissolved oxygen. When aerobic bacteria decompose a vast volume of organic material such that oxygen is depleted faster than it can be replaced, the resulting decrease in dissolved oxygen is known as the Biological Oxygen Demand. From the information presented in the Literature Review, it is noted that a BOD level ranging from 6 -9 indicates that the water contained lots of organic material and bacteria. This is justified since, the level of BOD in water would be affected by the level of Turbidity and Total Solids. Turbidity is a measure of water’s lack of clarity and can thus be interrelated to the level of Total Solids, which consist of solid particles which may have a dark appearance, since a high level of Total Solids present would cause water to lose its clarity and thus results in a high Turbidity level. Furthermore, the dark appearance of the large amounts of solid particles in water will attract heat from the sun and cause the temperature of the water to increase. This therefore causes water loses its ability to hold dissolved oxygen which therefore results in an increase in the Biological Oxygen Demand. Another factor which would result in an increase in the level of Biological Oxygen Demand would be Salinity. From the Literature Review, Salinity is defined as “the measure of all the salts dissolved in water”, and tilapia can survive at Salinity levels of up to 15 ppt. When Salinity increases, there will be more salt particles being present in the water. These salts may have a dark appearance when present in the water and would thus attract heat via sunlight. As a result, there will be an increase in water temperature, thereby causing the water to lose its ability to hold dissolved oxygen, which results in an increase in the Biological Oxygen Demand. However, from the results obtained, it was deduced that the Salinity levels at each site was 1.3 ppt and less, which according to the Literature Review, will allow for the survival of the tilapia. Temperature also has an effect on the Biological Oxygen Demand. As mentioned above, when the temperature increases, water loses its ability to hold dissolved oxygen which therefore results in an increase in the Biological Oxygen Demand. From the information presented in the Literature Review, it is noted that the growth rate of tilapia is best between a temperature of 220C and 290C. The results of the tests depicted that the temperature of the sites ranged between 24.440C – 27.430C. Thus, it is confirmed that the water temperature at each site is appropriate for the growth and reproduction of tilapia. Furthermore, from the research done, it is noted that different forms of agricultural processes take place at the La Vega estate. As such, Nitrate and Phosphate fertilizers may have been utilized, which would have therefore entered the pond water. Nitrates, which are acidic in nature, and Phosphates, which are basic in nature, would affect the pH of water. The pH of each site ranged between 7.31 – 7.84. On the pH scale, a pH of 7 is neutral, below 7 is acidic and above 7 is basic. As such, these pHs would be considered relatively neutral. Since the pH of the sites was fairly neutral, it can be established that the existence of both Nitrates and Phosphates in water kept the pH at a relative balance. Furthermore, from the data established in the Literature Review, it is noted that the growth rate of tilapia is best between a pH of 7 –
  • 27.
    25 9. Therefore, thepH of the water at each site would allow for the optimum growth of the tilapia. Additionally, the level of Nitrates present would be affected by the level of Alkalinity of the water. This is because the Alkalinity of water is a measure of how much acid it can neutralize. When the Alkalinity level is high, the Nitrate level would therefore be low as water is able to neutralize nitrates which are acidic in nature. From the results obtained, it was seen that each site had a high level of Alkalinity and nitrate levels which were lower than 12.7mg/L and less. From the Literature Review, it is noted that nitrate levels above 25mg/L would be toxic to the tilapia. Therefore, these levels would not be toxic to the tilapia since the high alkalinity of the water is able to keep the nitrate levels within a low range. Apart from nitrates, the presence of ammonia in the pond will result in an overall increase in the nitrogen supply to the tilapia and other aquatic organisms. According the Literature Review, unionized ammonia – NH3, is toxic to tilapia however ionized ammonia – NH4+ (ammonium), isn’t toxic. From the results obtained, the ammonium concentrations were 0.9mg/L and less, which will not be toxic to the tilapia and allow them to survive comfortably. Lastly, there are toilet facilities near the pond, with the sewage water pipe running into the pond. Due to this, there may be human related bacteria present in the pond. This is justified from the results obtained as it showed that the average colonies per 100mL were high in value, with the highest value being 7.35E+07, which was from the Coliscan – purple. In addition to this, the Total Coliform per 100mL of water at each site was relatively high and similar to each other, with values ranging between 8.60E+07 – 9.95E+07. As a result, the Total Coliform in the pond was high. From the Literature Review, it was established by “Araujo et al (1989)”, that there was a strong link between the presence of coliforms between 9 to 107 cfu/100 ml and human pathogens in fresh water with average presence of 102–109 cfu/100 ml. In addition to this, “Madal et al (2009)”, found a strong correlation between the absorption of these microbia into the tilapia fish posing a threat to health and safety of humans. As such, the results obtained would justify the information presented in the Literature Review since the levels of Total Coliform at each site was relatively high. Although the tilapia would be able to survive under these conditions and would not be directly affected, if the tilapia is consumed by humans, it may result in health complications. Additionally, the high levels of bacteria present would contribute to an increase in Total Solids, Turbidity and BOD, which would cause harm to the fish, thereby inhibiting their survival.
  • 28.
    26 Conclusions Within the limitsof experimental errors, from the various observations made throughout this Internal Assessment and tests carried out at all four sites, all sites, and therefore the entire pond, provided the necessary conditions for the rearing of tilapia. However, certain parameters such as Total Solids, BOD and Turbidity contained values which were higher than the required ranges for the survival of tilapia. These increased values would therefore have an effect on the growth and reproduction of tilapia in the pond.
  • 29.
    27 Recommendations - An alternativemethod to running the waste water pipe into the pond should be used. - The restroom facilities should be located away from the pond. - The quality of water of the pond, at all sites, should be monitored frequently so that the tilapia and other aquatic organisms have an optimum environment for growth and maintenance.
  • 30.
    28 Bibliography Eat This, NotThat! (2014). How Tilapia is a More Unhealthy Food Than Bacon. Retrieved from Eat This, Not That!: http://www.eatthis.com/tilapia-is-worse-than-bacon eXtension. (2012, October 17). Water Quality in Aquaculture. Retrieved from eXtension: http://articles.extension.org/pages/58707/water-quality-in-aquaculture Gabbadon , P., de Souza, G., & Titus, A. (2008). A Manual for Commercial Tilapia Production. Institute of Marine Affairs. Komar, C., & Wendover, N. (2007, June 18). Parasitic Diseases Of Tilapia. Retrieved from The Fish Site: http://www.thefishsite.com/articles/294/parasitic-diseases-of-tilapia/ Lakeway Tilapia . (2016). Tilapia farming guide - Understanding the five needs of tilapia. Retrieved from Lakeway Tilapia: https://lakewaytilapia.com/How_To_Raise_Tilapia.php Organic Facts. (2016). Health Benefits of Tilapia. Retrieved from Organic Facts: https://www.organicfacts.net/health-benefits/animal-product/tilapia.html Rakocy, J. E., & McGinty , A. S. (1989). Tank and Pond Culture of Tilapia. Southern Regional Aquaculture Centre (SRAC) Publication. Ramnarine, I. W., & Barrath, C. (2004). Tilapiia Culture In Trinidad and Tobago: Yet Another Update. Simple Organic Life. (2015, April 5). Here’s Why You Should Never Eat Tilapia Again. Retrieved from Simple Organic Life: http://simpleorganiclife.org/never-eat-tilapia/
  • 31.
    29 Appendices Appendix 1 Site Visits SiteVisit: 1 Date: 20/01/2016 Location: La Vega Estate, Gran Couva Map: Map 1: Showing location of Site A in the La Vega Estate pond Title: Environmental Survey of tilapia production in an earth pond. Aim: To assess fish population, feeding practices its effects on the environment and water quality and hence deduce the quality of the fish.
  • 32.
    30 Objectives: - To observethe overall practice of Tilapia rearing and identify areas of waste production - To assess tilapia population. - To identify and record waste management strategies being employed. - To assess water quality of the pond Introduction: The Tilapia pond is located at the La Vega Estate, Gran Couva, which is in Central Trinidad. The Estate is approximately 250 acres, however the pond itself is approximately 2.67 acres or 10, 800 sq meters. The uses of the pond range from recreational to the rearing of a range of fishes, predominantly Tilapia for the local market. Over the years, tilapia became the dominant species in the pond, which is currently made up primarily of Mozambique tilapia. For this investigation, the pond was divided into 4 sites. Site A is located near the huts, with the nearby vegetation being mainly lawn grass, with some ornamental trees such as palms and fruit trees (golden apple and jamon). The water at this site of the pond was light brown in colour, however, the water near the bank was fairly transparent. Image 1: Showing the aerial view of the La Vega Estate pond
  • 33.
    31 Image 2: Showingthe longitudinal view of Site A in the La Vega Estate pond Methodology/Activities: The “Mark and Recapture” method was used to estimate the population of tilapia at Site A of the pond. The fishes were also observed for any form of discolorations as indications of illness. Furthermore, water sample were taken and were quality tests were done. The feeding practices and harvesting were also documented. Mark and Recapture - Day 1 – For this method, feed pellets were used to attract the tilapia to a specific location and nets were used to capture several tilapia alive at one time. Each tilapia was marked by tagging them with a T-bar and they were then released back into the pond, unharmed. After two hours, the fish were again caught and data was taken pertaining to how many tilapia were captured with and without tags. The mathematical formula below was used to estimate the population size of the tilapia. The total size of the pond was 10, 800 sq meters, however, the sample area used was 36 sq meters.
  • 34.
    32 Observations and Results: TrialNumber Number Captured Number Recaptured with mark 1 17 8 2 17 6 3 17 6 4 18 6 5 18 7 6 18 8 7 19 6 8 21 7 9 18 6 10 17 5 Total: 180 65 𝑃𝑜𝑝𝑢𝑙𝑎𝑡𝑖𝑜𝑛 𝐸𝑠𝑡𝑖𝑚𝑎𝑡𝑒 = 180 × 72 65 = 199 in 36 sq meters Total population based on this estimate = 199 36 × 10,800 = 59,700 *Ideal population based on the size of pond = 10,800 × 4 = 𝟒𝟑, 𝟐𝟎𝟎 This is based on the literature finding which indicated that the ideal conditions for Tilapia is 4 fish to 1 sq meter. Difference in population – 59, 700 – 43, 200 = 16, 500 Percentage difference – 16, 500/43, 200 x 100 = 38% Discussion: Based on the size of the pond, the ideal population of tilapia was determined to be 43, 200. However, after using the formula to estimate the population of Tilapia in the pond from the first 10 trials, it was found that the total estimated population was 59, 700. Therefore, the total estimated population of tilapia present at Site A of the pond was 38% greater than the ideal population. This is because the sampling technique used was biased, as it gave only an estimated population of the tilapia rather than the actual value, thus resulting in a higher population figure. Conclusion: The total estimated population of Tilapia at Site A of the La Vega Estate pond was 59, 700 fish. Follow Ups: The site should be visited during other months of the year, between both the dry and rainy season, and the physicochemical tests and the experiment for the population size of the tilapia should be carried out, in order to obtain more accurate data.
  • 35.
    33 Site Visit: 2 Date:27/01/2016 Location: La Vega Estate, Gran Couva Map: Map 1: Showing location of Site B in the La Vega Estate pond Title: Environmental Survey of tilapia production in an earth pond. Aim: To assess fish population, feeding practices its effects on the environment and water quality and hence deduce the quality of the fish. Objectives: - To observe the overall practice of Tilapia rearing and identify areas of waste production - To assess tilapia population. - To identify and record waste management strategies being employed. - To assess water quality of the pond Introduction: The Tilapia pond is located at the La Vega Estate, Gran Couva, which is in Central Trinidad. The Estate is approximately 250 acres, however the pond itself is approximately 2.67 acres or 10, 800 sq meters. The uses of the pond range from recreational to the rearing of a range of fishes, predominantly Tilapia for the local market. Over the years, tilapia became the dominant species in the pond, which is currently made up primarily of Mozambique tilapia. For this investigation, the pond was divided into 4 sites.
  • 36.
    34 Site B islocated near the huts, with no major vegetation being present. At this site, the color of the water in the pond was light brown. However, the pond water was mostly covered with lilies, which limited the water clarity. Methodology/Activities: The “Mark and Recapture” method was used to estimate the population of tilapia at Site B of the pond. The fishes were also observed for any form of discolorations as indications of illness. Furthermore, water sample were taken and were quality tests were done. The feeding practices and harvesting were also documented. Mark and Recapture - Day 1 – For this method, feed pellets were used to attract the tilapia to a specific location and nets were used to capture several tilapia alive at one time. Each tilapia was marked by tagging them with a T-bar and they were then released back into the pond, unharmed. After two hours, the fish were again caught and data was taken pertaining to how many tilapia were captured with and without tags. The mathematical formula below was used to estimate the population size of the tilapia. The total size of the pond was 10, 800 sq meters, however, the sample area used was 36 sq meters. Observations and Results: Trial Number Number Captured Number Recaptured with mark 11 21 5 12 20 5 13 21 8 14 20 8 15 21 5 16 20 8 17 19 5 18 18 5 19 20 5 20 20 7 Total: 200 61 𝑃𝑜𝑝𝑢𝑙𝑎𝑡𝑖𝑜𝑛 𝐸𝑠𝑡𝑖𝑚𝑎𝑡𝑒 = 200 × 72 61 = 236 in 36 sq meters Total population based on this estimate = 236 36 × 10,800 = 70,800 *Ideal population based on the size of pond = 10,800 × 4 = 𝟒𝟑, 𝟐𝟎𝟎 This is based on the literature finding which indicated that the ideal conditions for Tilapia is 4 fish to 1 sq meter. Difference in population – 70, 800 – 43, 200 = 27, 600
  • 37.
    35 Percentage difference –2, 600/43, 200 x 100 = 64% Discussion: Based on the size of the pond, the ideal population of tilapia was determined to be 43, 200. However, after using the formula to estimate the population of Tilapia in the pond from the first 10 trials, it was found that the total estimated population was 70, 800. Therefore, the total estimated population of tilapia present at Site B of the pond was 64% greater than the ideal population. This is because the sampling technique used was biased, as it gave only an estimated population of the tilapia rather than the actual value, thus resulting in a higher population figure. Conclusion: The total estimated population of Tilapia at Site B of the La Vega Estate pond was 70, 800 fish. Follow Ups: The site should be visited during other months of the year, between both the dry and rainy season, and the physicochemical tests and the experiment for the population size of the tilapia should be carried out, in order to obtain more accurate data. Site Visit: 3 Date: 03/02/2016 Location: La Vega Estate, Gran Couva Map:
  • 38.
    36 Map 1: Showinglocation of Site C in the La Vega Estate pond Image 1: Showing the longitudinal view of Site C in the La Vega Estate pond Title: Environmental Survey of tilapia production in an earth pond. Aim: To assess fish population, feeding practices its effects on the environment and water quality and hence deduce the quality of the fish. Objectives:
  • 39.
    37 - To observethe overall practice of Tilapia rearing and identify areas of waste production - To assess tilapia population. - To identify and record waste management strategies being employed. - To assess water quality of the pond Introduction: The Tilapia pond is located at the La Vega Estate, Gran Couva, which is in Central Trinidad. The Estate is approximately 250 acres, however the pond itself is approximately 2.67 acres or 10, 800 sq meters. The uses of the pond range from recreational to the rearing of a range of fishes, predominantly Tilapia for the local market. Over the years, tilapia became the dominant species in the pond, which is currently made up primarily of Mozambique tilapia. For this investigation, the pond was divided into 4 sites. Site C is located near the huts, with the nearby vegetation being mainly lawn grass. The water at this site of the pond was brown in color and was relatively transparent. Methodology/Activities: The “Mark and Recapture” method was used to estimate the population of tilapia at Site A of the pond. The fishes were also observed for any form of discolorations as indications of illness. Furthermore, water sample were taken and were quality tests were done. The feeding practices and harvesting were also documented. Mark and Recapture - Day 1 – For this method, feed pellets were used to attract the tilapia to a specific location and nets were used to capture several tilapia alive at one time. Each tilapia was marked by tagging them with a T-bar and they were then released back into the pond, unharmed. After two hours, the fish were again caught and data was taken pertaining to how many tilapia were captured with and without tags. The mathematical formula below was used to estimate the population size of the tilapia. The total size of the pond was 10, 800 sq meters, however, the sample area used was 36 sq meters. Observations and Results: Trial Number Number Captured Number Recaptured with mark 21 20 6 22 17 6 23 17 8 24 18 6 25 20 5 26 19 5 27 18 7 28 20 6 29 20 5 30 21 5 Total: 190 59
  • 40.
    38 𝑃𝑜𝑝𝑢𝑙𝑎𝑡𝑖𝑜𝑛 𝐸𝑠𝑡𝑖𝑚𝑎𝑡𝑒 = 190× 72 59 = 231 in 36 sq meters Total population based on this estimate = 231 36 × 10,800 = 69,300 *Ideal population based on the size of pond = 10,800 × 4 = 𝟒𝟑, 𝟐𝟎𝟎 This is based on the literature finding which indicated that the ideal conditions for Tilapia is 4 fish to 1 sq meter. Difference in population – 69, 300 – 43, 200 = 26, 100 Percentage difference – 26, 100/43, 200 x 100 = 60% Discussion: Based on the size of the pond, the ideal population of tilapia was determined to be 43, 200. However, after using the formula to estimate the population of Tilapia in the pond from the first 10 trials, it was found that the total estimated population was 69, 300. Therefore, the total estimated population of tilapia present at Site C of the pond was 60% greater than the ideal population. This is because the sampling technique used was biased, as it gave only an estimated population of the tilapia rather than the actual value, thus resulting in a higher population figure. Conclusion: The total estimated population of Tilapia at Site C of the La Vega Estate pond was 69, 300 fish. Follow Ups: The site should be visited during other months of the year, between both the dry and rainy season, and the physicochemical tests and the experiment for the population size of the tilapia should be carried out, in order to obtain more accurate data. Site Visit: 4 Date: 10/02/2016 Location: La Vega Estate, Gran Couva Map:
  • 41.
    39 Map 1: Showinglocation of Site D in the La Vega Estate pond Title: Environmental Survey of tilapia production in an earth pond. Aim: To assess fish population, feeding practices its effects on the environment and water quality and hence deduce the quality of the fish. Objectives: - To observe the overall practice of Tilapia rearing and identify areas of waste production - To assess tilapia population. - To identify and record waste management strategies being employed. - To assess water quality of the pond Introduction: The Tilapia pond is located at the La Vega Estate, Gran Couva, which is in Central Trinidad. The Estate is approximately 250 acres, however the pond itself is approximately 2.67 acres or 10, 800 sq meters. The uses of the pond range from recreational to the rearing of a range of fishes, predominantly Tilapia for the local market. Over the years, tilapia became the dominant species in the pond, which is currently made up primarily of Mozambique tilapia. For this investigation, the pond was divided into 4 sites. Site D is located near the restroom areas. The nearby vegetation is mainly forested trees. The water at this site of the pond was dark brown in color and was not transparent. The sewage waste water pipe was seen entering the pond at this site. Methodology/Activities: The “Mark and Recapture” method was used to estimate the population of tilapia at Site A of the pond. The fishes were also observed for any form of
  • 42.
    40 discolorations as indicationsof illness. Furthermore, water sample were taken and were quality tests were done. The feeding practices and harvesting were also documented. Mark and Recapture - Day 1 – For this method, feed pellets were used to attract the tilapia to a specific location and nets were used to capture several tilapia alive at one time. Each tilapia was marked by tagging them with a T-bar and they were then released back into the pond, unharmed. After two hours, the fish were again caught and data was taken pertaining to how many tilapia were captured with and without tags. The mathematical formula below was used to estimate the population size of the tilapia. The total size of the pond was 10, 800 sq meters, however, the sample area used was 36 sq meters. Observations and Results: Trial Number Number Captured Number Recaptured with mark 31 21 8 32 21 6 33 17 5 34 19 8 35 19 8 36 18 5 37 17 8 38 17 5 39 17 7 40 18 6 Total: 184 66 𝑃𝑜𝑝𝑢𝑙𝑎𝑡𝑖𝑜𝑛 𝐸𝑠𝑡𝑖𝑚𝑎𝑡𝑒 = 184 × 72 66 = 200 in 36 sq meters Total population based on this estimate = 200 36 × 10,800 = 60,000 *Ideal population based on the size of pond = 10,800 × 4 = 𝟒𝟑, 𝟐𝟎𝟎 This is based on the literature finding which indicated that the ideal conditions for Tilapia is 4 fish to 1 sq meter. Difference in population – 60, 000 – 43, 200 = 16, 800 Percentage difference – 16, 800/43, 200 x 100 = 39% Discussion: Based on the size of the pond, the ideal population of tilapia was determined to be 43, 200. However, after using the formula to estimate the population of Tilapia in the pond from the first 10 trials, it was found that the total estimated population was 60, 000. Therefore, the total estimated population of tilapia present at Site A of the pond was 39%
  • 43.
    41 greater than theideal population. This is because the sampling technique used was biased, as it gave only an estimated population of the tilapia rather than the actual value, thus resulting in a higher population figure. Conclusion: The total estimated population of Tilapia at Site D of the La Vega Estate pond was 60, 000 fish. Follow Ups: The site should be visited during other months of the year, between both the dry and rainy season, and the physicochemical tests and the experiment for the population size of the tilapia should be carried out, in order to obtain more accurate data. Appendix 2
  • 44.
    42 Laboratory Entries Lab: 1 Date:The lab was done on the same dates the site visits were carried out Title: Biochemical Oxygen Demand Aim: To determine the Biochemical Oxygen Demand (BOD5) of all four sites. Materials and Apparatus: 1. Vernier LabQuest 2 interface 2. BOD Water Sample 3. Vernier Dissolved Oxygen Probe 4. 100% calibration bottle 5. D.O. Electrode Filling Solution 6. Wash bottle with distilled water 7. Sodium Sulfite Calibration Solution 8. Sample water from each site 9. Pipette 10. 250 mL beaker Procedure: Day 0 1. At each of the four sites visited, the group collected five water samples for the BOD test. 2. Each of the glass BOD sample bottles were then placed approximately 10cm below the water’s surface and kept there for 1 minute until all air bubbles were removed and the bottle was completely filled. The BOD bottle lid was secured tightly, while still submerged. 3. Each bottle was then wrapped in foil and labelled E1 to E5 and with the name of its corresponding site. The bottles were stored in ice and returned to the laboratory for testing. 4. At the laboratory, the bottles E1 to E5 were removed from the ice and the initial dissolved oxygen reading was measured using the LabQuest2 Dissolved Oxygen probe. 5. Sodium Sulphite solution was used to calibrate the LabQuest2 Probe. The probe was washed with distilled water and the readings of the samples were then taken. 6. The results were recorded in Table1 as the “initial dissolved oxygen level”. 7. The BOD bottles were then placed in an incubator (dark closet) at around 27 °C for five days. Day 5 8. The BOD bottles were removed from the incubator at approximately the same time of day they were placed into the incubator and the dissolved oxygen was measured following step 5.
  • 45.
    43 Data Collection/Results: Table 1– Results of Group 1 showing the level of dissolved oxygen in samples E1 – E5 after 5 days for each site Site Dissolved Oxygen E1 E2 E3 E4 E5 Average (BOD5) (mg/L) A Initial (mg/L) 10.8 10.8 10.7 10.9 10.8 Final (mg/L) 3.4 3.7 3.3 3.6 3.4 BOD5 (mg/L) 7.4 7.1 7.4 7.3 7.4 7.32 B Initial (mg/L) 11.3 11.2 10.9 11.1 11.1 Final (mg/L) 5.2 4.4 4.3 4.7 4.5 BOD5 (mg/L) 6.1 6.8 6.6 6.4 6.6 6.50 C Initial (mg/L) 11.1 11.1 11.3 11.1 11.2 Final (mg/L) 3.9 3.8 3.8 3.6 3.8 BOD5 (mg/L) 7.2 7.3 7.5 7.5 7.4 7.38 D Initial (mg/L) 8.3 8.7 8.5 8.5 8.7 Final (mg/L) 2.3 2.4 2.8 2.9 2.2 BOD5 (mg/L) 6 6.3 5.7 5.6 6.5 6.02 Data Analysis: BODE1 = Final Dissolved Oxygen (mg/L) – Initial Dissolved Oxygen (mg/L) BOD5 = 𝐵𝑂𝐷 𝐸1 +𝐵𝑂𝐷 𝐸2 +𝐵𝑂𝐷 𝐸3 +𝐵𝑂𝐷 𝐸4 +𝐵𝑂𝐷 𝐸5 5 mg/L The results for the values of BODE1 – BODE5 and BOD5 are shown in Table1 above. Discussion: This lab was done to determine the Biochemical Oxygen Demand of the water samples taken from each of the four coastal zones visited. In a “healthy” body of water, oxygen is replenished quicker than it’s used by aquatic organisms. However, in some bodies of water, aerobic bacteria decompose such a vast volume of organic material, that oxygen is depleted from the water faster than it can be replaced. The resulting decrease in dissolved oxygen is known as the Biochemical Oxygen Demand (BOD). Also, oxygen is vital to aquatic species as they use it to build energy through respiration. Dissolved oxygen is the form of oxygen accessible to aquatic organisms. After testing, it was found that the average level of BOD in sites “A”, “B”, “C” and “D” was calculated to be 7.32mg/L, 6.50mg/L, 7.38mg/L and 6.02mg/L respectively. A level of BOD between 6mg/L – 9mg/L indicates that the water is contains lots of organic material and bacteria. Furthermore, to prevent reductions in growth and disease resistance, the dissolved oxygen concentration in tilapia ponds should be kept at 1 mg/L. Therefore, it can be deduced that the water in the four sites “A”, “B” and “C” and “D” contained a lot of organic material
  • 46.
    44 and bacteria, andwas not suitable for the optimum growth of tilapia and would thus reduce their ability to resist diseases. Conclusions: The BOD5 levels of the four visited sites were investigated and determined. The BOD5 levels of the sites “A”, “B”, “C” and “D” were 7.32mg/L, 6.50mg/L, 7.38mg/L and 6.02mg/L respectively. All four sites had unacceptable BOD levels for the optimum growth of tilapia and maintaining their ability to resist diseases. Limitations: The resources and time were limited for this experiment and thus a simple method for the calculation of BOD5- was employed. As such, to obtain a precise measure of BOD5 it should be conducted over a longer period of time period so that the changes can be better observed, thus resulting in a clear cut representation of the various levels present in the water. Lab: 2 Date: The lab was done on the same dates the site visits were carried out
  • 47.
    45 Title: Temperature, pH,Nitrates, Turbidity, Salinity and Ammonium Aim: To determine the Temperature, pH, Nitrates, Turbidity, Salinity and Ammonium level of all four sites. Materials and Apparatus: 1. Vernier LabQuest 2 interface 2. Vernier pH Sensor 3. Vernier Temperature Probe 4. Nitrate Ion-Selective Electrode 5. Vernier Turbidity Sensor 6. Wash Bottle 7. Distilled Water 8. Sample water from each site Procedure: 1. Water samples were collected at each of the visited sites by placing the water bottles under water for 1 minute, until all the air bubbles were removed. The lid of the bottle was then tightened quickly under water. The bottle was then labelled “Bottle A” with the name of its corresponding site. The bottles were then taken back to the laboratory for testing. 2. The laboratory technician pre-standardised each probe before testing the samples. 3. Each sample was tested in succession for Temperature, Turbidity, pH, Nitrates, Ammonia and Salinity. For each test the relevant probe was connected to the LabQuest2 interface and placed into Sample Bottle A and the reading recorded in Table 1. 4. Between each test the probes were washed and securely stored away. Data Collection/Results: Table 1 – Results showing the values obtained for pH, Turbidity, Nitrates and Temperature at the four sites Site pH Temperature (°C) Ammonium NH4+ -N (mg/L) Turbidity (NTU) Nitrates (mg/L) Salinity (ppt) A 7.31 24.44 0.8 18 8.9 1.2 B 7.73 27.43 0.7 23 12.7 1.1 C 7.84 24.50 0.9 25 6.4 1.3 D 7.33 25.73 0.8 27 9.8 1.3 Discussion: This lab was done to determine the Temperature, pH, Nitrates, Turbidity, Salinity and Ammonium level of the water samples taken from each of the four sites visited. Temperature refers to the degree of heat and is a measure of the average heat or thermal energy of the particles in a substance. Many aquatic organisms are cold blooded and have
  • 48.
    46 their own specificoptimum temperature. The growth rate of tilapia is best between a temperature of 220C and 290C. It was determined that the temperatures of the samples of water for sites “A”, “B”, “C” and “D” were 24.440C, 27.430C, 24.500C and 25.730C respectively. These temperatures were within the range required for the standard living of tilapia and as such the temperatures were not harmful to them. Also, aquatic organisms are extremely sensitive to the pH of their environment. The growth rate of tilapia is best between a pH of 7 – 9. If the pH of the water isn’t at this optimum range, the tilapia won’t be able to survive and reproduce and may eventually die. The pH scale ranges from 0 – 14 with a pH of 7 being neutral, a pH of less than 7 being acidic and a pH of above 7 being basic. It was found that the pH of the samples of water for each site “A”, “B”, “C” and “D” was 7.31, 7.73, 7.84 and 7.33. Thus, it can be inferred that the pH of the water of the four sites visited was relatively neutral and was appropriate for the survival and reproduction of tilapia. Additionally, another parameter which was tested was turbidity. Turbidity refers to the measure of water’s lack of clarity. Water with high turbidity is cloudy, whereas water with low turbidity is clear. For aquatic life, turbidity levels should be less than 25 NTU. It was detected that the values of Turbidity of the samples of water for the sites “A”, “B”, “C” and “D” were 18, 23, 25 and 27 NTU respectively. With respect to sites “A”, “B” and “C”, the turbidity was within the required range and as such the water was clear, allowing light to enter which thus allowed for the growth and reproduction of tilapia. In contrast, the turbidity of coastal zone “D” was slightly higher than acceptable. This therefore indicates that there was a limitation in light penetration into the water, which may cause a decrease in the dissolved oxygen levels and can suffocate the tilapia and other aquatic organisms which live there, which may eventually result in death. Furthermore, nitrates, NO3-, which are soluble in water, are an essential source of nitrogen required by plants and animals to synthesize amino acids and proteins. The acceptable nitrate level in water for tilapia growth is below 10 mg/L, however, toxicity only occurs at levels above 25 mg/L. This is because, above this level, there is an increase in plant growth and decay, promotion of bacterial decomposition and a decrease in oxygen levels in water, which may kill the tilapia and other aquatic organisms which live there. It was found that the Nitrate level of the samples of water for the sites “A”, “B”, “C” and “D” were 8.9mg/L, 12.7mg/L, 6.4mg/L and 9.8mg/L respectively. As such, the nitrate level of the water samples from sites “A”, “C” and “D”, were within the appropriate range. Even though the nitrate level at site “B” was slightly higher than the acceptable level, it wasn’t high enough to result in toxicity. Therefore, the nitrate level at all sites would have allowed the tilapia to grow and reproduce efficiently. In addition, salinity was another tested parameter. Salinity is the measure of all the salts dissolved in water, and the ideal salinity for tilapia growth is 15ppt and under. It was determined that the level of salinity in the water in sites “A”, “B”, “C” and “D” was 1.2ppt, 1.1ppt, 1.3ppt and 1.3ppt respectively. As such, the salinity level of the water sample from the four visited sites was within the acceptable range, thereby allowing for the optimum growth of tilapia. Lastly, ammonium, a compound made of nitrogen and hydrogen, occurs in two forms – unionized (NH3) and ionized (NH4+). Unionized ammonia is toxic to tilapia and high levels
  • 49.
    47 would eventually causedeath. The concentration of unionized ammonia in water for the efficient survival of tilapia should be below 0.6mg/L. However, ionized ammonia occurs in the form of ammonium and isn’t toxic to tilapia. From the results obtained, it was deduced that the ammonium level at sites “A”, “B”, “C” and “D” was 0.8mg/L, 0.7mg/L, 0.9mg/L and 0.8mg/L respectively. These values were low enough so that it would not have produced unionized ammonia as aforementioned, and thus would not be toxic to the tilapia, therefore allowing them to comfortably survive. Conclusions: The Temperature, pH, Nitrates and Turbidity of the water from the four visited sites were investigated and determined. Sites “A”, “B”, “C” and “D” were within the required ranges for Temperature, which was 24.440C, 27.430C, 24.500C and 25.730C respectively, pH, which was 7.31, 7.73, 7.84 and 7.33 respectively and Salinity, which was 1.2ppt, 1.1ppt, 1.3ppt and 1.3ppt respectively. The turbidity level of the four site was 18, 23, 25 and 27 NTU respectively. Sites “A”, “B” and “C” had an acceptable level of turbidity whereas site “D” had a value which was slightly higher than the acceptable level. The level of Nitrates found in the four sites “A”, “B”, “C” and “D” was 8.9mg/L, 12.7mg/L, 6.4mg/L and 9.8mg/L respectively. The nitrate level of sites “A”, “C” and “D” was within the acceptable range, however, despite the level at site “B” being slightly over the acceptable range, it wasn’t high enough to be toxic to the fish. Therefore, the nitrate level at all four sites would have been appropriate for the survival of tilapia. The Ammonium level at sites “A”, “B”, “C” and “D” was 0.8mg/L, 0.7mg/L, 0.9mg/L and 0.8mg/L respectively. These levels were low and would not be toxic to the tilapia, thus allowing them to grow and reproduce efficiently. Limitations: To obtain a specific evaluation of whether or not the water quality was ideal for the growth and survival of tilapia, these parameters should be collected over a longer period of time to allow the true levels and fluctuations to be seen. Lab: 3 Date: The lab was done on the same dates the site visits were carried out Title: Total Solids
  • 50.
    48 Aim: To determinethe level of Total Solids present in the water sample collected for all four sites. Materials and Apparatus: 1. Analytical balance (0.001g) 2. Drying oven 3. Tongs 4. 100mL graduated cylinder 5. Four (4) 250mL beakers 6. Sample water from each site Procedure: 1. Water samples were collected at each of the visited sites by placing the water bottles under water for 1 minute, until all the air bubbles were removed. The lid of the bottle was then tightened quickly under water. The bottle was then labelled “Bottle B” with the name of its corresponding coastal zone. The bottles were then taken back to the laboratory for testing. 2. A measuring cylinder was used to measure and pour 200 cm3 of sample water from each site into each of the pre-dried and weighed 250mL beakers. 3. The beakers were placed in a drying oven at a 100 °C until the following day. 4. The beakers were then removed and placed in a desiccator until they were cooled to room temperature. 5. Each beaker was weighed to determine the difference by mass. 6. The results were tabulated in Table 1. Data Collection/Results: Table 1: Results showing the Total Solids present in each water sample collected at the various sites. Site Mass of empty beaker (g) Mass of beaker plus solids (g) Mass of Solids (g) Mass of Solids (mg) Total Volume (L) Total Solids (mg/L) A 97.850 97.865 0.015 15 0.2 75 B 95.950 95.968 0.018 18 0.2 90 C 103.550 103.567 0.017 17 0.2 85 D 96.995 97.011 0.016 16 0.2 80 Discussion: This lab was done to determine the level of Total Solids present in the water samples taken from each of the sites visited. Total Solids is a measure of all the suspended, colloidal, and dissolved solids in a sample of water. It was detected that the level of Total Solids of the samples of water for the four sites “A”, “B”, “C” and “D” were 75, 90, 85 and 80 respectively. As such, it can be inferred that all four sites contained a high level of suspended, colloidal and dissolved solids. This may endanger the tilapia live there since a
  • 51.
    49 high level ofTotal Solids causes a decrease in the photosynthetic rate and also reduces water clarity. Conclusions: The levels Total Solids present in the four visited sites were investigated and determined. The levels of total solids of sites “A”, “B”, “C” and “D” were 75, 90, 85 and 80 respectively. All sites contained high levels of total solids which would endanger the tilapia and other aquatic organisms which live there. Limitations: To obtain a specific evaluation of whether or not the water quality was ideal for the growth and survival of tilapia, the level of Total Phosphates should have been tested for over a longer period of time to allow the true levels and fluctuations to be seen. Lab: 4 Date: The lab was done on the same dates the site visits were carried out
  • 52.
    50 Title: Total Phosphates Aim:To determine the level of Total Phosphates in the water sample collected for all four sites. Materials and Apparatus: 1. Sample water from each site 2. 0.1M HCl 3. LabQuest 2 Interface 4. 2.63 M H2SO4 5. Vernier Colourimeter 6. 10 mL graduated cylinder 7. Phosphate Standard (10.0 mg/L PO4) 8. 25 mL graduated cylinder 9. one cuvette 10. four 50 mL Erlenmeyer flasks 11. 5.0 M NaOH 12. Hot plate 13. PhosVer 3 Phosphate Powder Pillow 14. Distilled Water 15. Sulphate Powder Pillows Procedure: 1. Water samples were collected at each of the visited sites by placing the water bottles under water for 1 minute, until all the air bubbles were removed. The lid of the bottle was then tightened quickly under water. The bottle was then labelled “Bottle C” with the name of its corresponding site. The bottles were then taken back to the laboratory for testing. 2. A 25mL graduated cylinder was used to measure and place 25 mL of sample water from each site into each flask. 3. Water samples from each facility were mixed as follows – a) One Sulphate powder pillow was added to each flask and swirled. b) A 10mL graduated cylinder was used to measure and add 2.0 mL of 2.63M H2SO4 to each flask swirled. c) The samples were boiled for 30 minutes while adding small amounts of distilled water to keep the volume near, but not above 25mL. d) After 30 minutes, the flasks were removed from the hot plate and allowed to cool. e) A 10mL graduated cylinder was used to add 2.0mL of 5.0 M NaOH to each flask and swirled to neutralise the acid. f) If a flask contained below 25 mL of liquid, the volume was made up to 25mL using distilled water. g) One PhosVer3 Phosphate Powder Pillow was added to each sample and completely dissolved prior to reading on the colourimeter. 4. The phosphate standards and standard curve was already done for us by the University of Trinidad and Tobago and stored on the LabQuest2 interface for use in the determination of our sample readings. The data was tabulated in Table 1.
  • 53.
    51 5. An emptycuvette was filled ¾ full with distilled water and the lid was sealed to prepare a blank. 6. The blank was then placed into the vernier colourimeter and the blank button was clicked on the interfaced. 7. The cuvette was washed after each reading and the samples for each site was then read on the colourimeter and tabulated in Table 2. Data Collection/Results: Table 1 – Results showing the Standards Absorbance Readings Flask Number 10.0 mg/L PO4 (mL) Distilled H2O (mL) Concentration (mg/L PO4) Absorbance 1 5 20 2 0.3414 2 10 15 4 0.737 3 15 10 6 0.844 4 20 5 8 1.179 Table 2: Results Showing the Absorbance values for the various Sites Site Absorbance Total Phosphates Concentration (mg/L) PO4 Total Phosphorus Concentration (mg/L- PO4) A 0.4011 2.35 0.768 B 0.7903 4.63 1.513 C 0.2270 1.33 0.435 D 0.3619 2.12 0.693 Discussion: This lab was done to determine the level of Total Phosphates present in the water samples taken from each of the four sites visited. Minute amounts of phosphorus are required for all aquatic plants and algae as it is a vital nutrient to these species. An excess amount results in eutrophication, the condition whereby there’s an excessive richness in nutrients, which results in increased plant and algal growth. Eutrophication lowers the levels of dissolved oxygen in the water and makes the water uninhabitable by many aquatic organisms, including tilapia. It was found that the values for the concentration of the Total Phosphates present in the samples of water for sites “A”, “B”, “C” and “D” was 2.35mg/L, 4.63mg/L, 1.33mg/L and 2.12mg/L respectively. These values were relatively low and as such it would not result in eutrophication, thus allowing tilapia and other aquatic organisms to live there easily. Data Analysis: Calculation of Phosphorus – Phosphorus (mg/L PO4-P) = phosphates (mg/L PO4) 3.06 Conclusions: The level Total Phosphates present in the four sites was investigated and determined. The levels of total phosphates of sites “A”, “B”, “C” and “D” were 2.35mg/L, 4.63mg/L, 1.33mg/L and 2.12mg/L respectively. All four sites zones contained acceptable levels of total phosphates.
  • 54.
    52 Limitations: To obtaina specific evaluation of whether or not the water quality was ideal for the growth and survival of tilapia, the level of Alkalinity should have been tested for over a longer period of time to allow the true levels and fluctuations to be seen. Lab: 5 Date: The lab was done on the same dates the site visits were carried out
  • 55.
    53 Title: Alkalinity Aim: Todetermine the Alkalinity of the water samples collected for all four sites. Materials and Apparatus: 1. Sample water from each site (B1) 2. 100 mL graduated cylinder 3. Methyl Orange 4. Wash bottle with distilled water 5. Conical Flask 6. 0.00100 M H2SO4 solution (A1) 7. 50 mL burette 8. 25 cm3 pipette 9. Three 250 cm3 conical flasks Procedure: 1. Water samples were collected at each of the visited sites by placing the water bottles under water for 1 minute, until all the air bubbles were removed. The lid of the bottle was then tightened quickly under water. The bottle was then labelled “Bottle D” with the name of its corresponding site. The bottles were then taken back to the laboratory for testing. 2. A1 (H2SO4) was then placed in a burette 3. 25 cm3 of B1 was then pipetted into a conical flask and two drops of methyl orange indicator was added. 4. This solution was titrated with A1 until it changed colour from yellow to orange/red. 5. Readings were then recorded in Table 1. 6. The concentration of Alkalinity was determined assuming the following reaction – H2SO4 + CaCO3 →H2O + CO2 + CaSO4 Data Collection/Results: Table 1: Results showing the Titration of B1 with A1 at the various sites Site A B C D Final burette reading / cm3 6 13 20 32 Initial burette reading / cm3 0 6 13 20 Volume of A1 used / cm3 6.1 6.6 7.2 12.0 Table 2: Results showing the Alkalinity level of the various sites Site Alkalinity (mg/L) A 33 B 36 C 39 D 31 Discussion: This lab was done to determine the level of Alkalinity present in the water samples taken from each of the four sites visited. Alkalinity refers to the measure of how much acid water can neutralize. Alkalinity acts as a buffer as it protects water and its life
  • 56.
    54 forms from immediatechanges in pH. In order for tilapia to survive, the Alkalinity level should be maintained between 100 to 250 mg/L. However, it was found that the values for the level of Alkalinity present in the samples of water for sites “A”, “B”, “C” and “D” were 33mg/L, 36mg/L, 39mg/L and 31mg/L respectively. Thus the Alkalinity level at all four sites was relatively low and as such the water, the tilapia and the other aquatic organisms which live there will be highly affected by changes in pH. Data Analysis: M1V1 = M2V2 M1 = 0.001 Molar H2SO4 V1 = Volume of H2SO4 titre into the conical flask M2 = Concentration of CaCO3 V2 = 25 ml Molar Concentration of CaCO3 (mol dm-3) to Mass Concentration of CaCO3 (g dm-3)  𝑔/𝑑𝑚−3 𝑜𝑓𝐶𝑎𝐶𝑂3 = M2 136  𝑇𝑜 𝑚𝑔/𝑑𝑚−3 = M2 136 × 1000 Conclusions: The level of Alkalinity present in the four sites were investigated and determined. The Alkalinity levels of sites “A”, “B”, “C” and “D” were 33mg/L, 36mg/L, 39mg/L and 31mg/L respectively. All sites contained an Alkalinity level which was below the acceptable range; as a result, this may lead to the death of the tilapia and other aquatic organisms which live there. Limitations: To obtain a specific evaluation of whether or not the water quality was ideal for the growth and survival of tilapia, these parameters should be collected over a longer period of time to allow the true levels and fluctuations to be seen. Lab: 6 Date: The lab was done on the same dates the site visits were carried out
  • 57.
    55 Title: Bacterial Concentration Aim:To determine the amount of E. Coli present in the tilapia pond Materials and Apparatus: 1. 2 sterile sample tubes 2. Autoclave 3. 2 bottles of Total Count (TC) 4. Bleach 5. 2 bottles of Coliscan Easygel 6. Waterproof marker 7. 4 pretreated petri dishes 8. Masking tape or parafilm 9. 2 sterile 3 mL pipettes Procedure: Day 1: Collection of Water Samples 1. A waterproof marker was used to label two sterile sample tubes with the site name, date, and time of collection. 2. The sample water was collected using a sterile technique. a) The top of the sterile sample tube was opened or the cover was gently peeled off of a sterile pipette from the bulb end. b) The sample tube was immersed or the pipette was tipped 5–8 cm below the surface to collect the sample in the flowing portion of the pond. If a dropper was used, the top of a sterile sample tube was gently opened and the sample was pipetted into the tube. Note: it was ensured that the person collecting the sample was standing downstream from the sample. c) The cap was carefully placed back on the sample tube; touching the sample was avoided. 3. Step 2 was repeated for the second sample. 4. Two bottles of Total Count (TC) Easygel® and two bottles of Coliscan Easygel® were obtained. 5. Each bottle was labelled with the site name and date of sample. 6. Four pretreated sterile petri dishes were obtained and each petri dish was labelled with the culture type, site name, date, and volume of sample. 7. Using sterile technique, the appropriate volume of water was transferred from the sample tubes into the bottles of TC Easygel® and Coliscan Easygel®. Note: Proper sample amount for inoculation depended on the level of contamination of the water source. Recommended volumes were 0.1–0.5 mL for TC medium and 1.0–5.0 mL for Coliscan medium. 8. Using sterile technique, the bottles were gently swirled to distribute the sample in the medium. 9. Each bottle of medium was opened and poured into the correctly labeled petri dishes. The lids were placed back on each of the petri dishes immediately. 10. The petri dish was gently swirled in a circular motion to evenly distribute the media on the bottom of the dish.
  • 58.
    56 11. The plateswere allowed to sit undisturbed in order to allow the media to gel. This took 45–60 min. 12. Steps 4–11 were repeated for the remaining samples. 13. Once the media was gelled, the petri dishes were stacked upside down and incubated for 24 hours at 35°C. If no incubator was available, the dishes were placed in a warm area in the room and covered with a towel. The dishes were incubated at room temperature for 30–48 hours. Note: The petri dishes were stacked upside down before they were incubated. 14. Day 2: Counting Colonies and Calculations 15. When the petri dishes were incubated for at least 24 hours, they were removed from the incubator. The dishes were kept upside down so condensation that was formed on the lid did not drip onto the culture. Note: If dishes were incubated at room temperature, they were incubated for 30–48 hours. Plates were not counted past 48 hours. 16. While the plate was upside down, the colonies on the Total Count dish were counted. Very small or “pin-point” colonies (smaller than a period) were not counted. Note: It was easier to count a quarter or a half of the culture and then multiply to get an estimated colony count. 17. The number of colonies on the Total Count dish was recorded in Table 1. 18. All the purple colonies on the Coliscan dish were counted. Any white or light blue colonies were not counted. Again it was ensured that the plate was upside down and pin-point colonies were not counted. 19. The number of purple colonies as E. coli colonies was recorded in Table 1. 20. All the red, pink, and purple colonies on the Coliscan dish were counted. Any white or light blue colonies were not counted. It was ensured that the plate was upside down and pin-point colonies were not counted. 21. The number of red, pink, and purple colonies as coliform colonies was recorded in Table 1. 22. Steps 15–20 were repeated for the second sample collected. Calculations: 1. The equation below was used to determine the concentration of bacteria per 100 mL for each sample collected. The values were recorded in Table 2. 2. Once the concentrations were calculated for each sample, the two values were averaged together to determine the average concentration of bacteria per 100mL. The average values were recorded in Table 2. Data Collection/Results:
  • 59.
    57 A dilution factorof 1:6 was made as 1:1 to 1:5 resulted in Too many to Count (TMC) for each plate. Adjustments were made prior by the technician who advised a 1:8 dilution be used. Table 1: Results showing the Total Colonies of each site Site Medium type Inoculation volume Total count Coliscan – red, pink, & purple (coliforms) Coliscan – purple (E. colt) 1 Count for Sample 1 1 167 103 64 Count for Sample 2 1 177 108 69 Average 172 105.5 66.5 2 Count for Sample 1 1 180 107 73 Count for Sample 2 1 184 112 72 Average 182 109.5 72.5 3 Count for Sample 1 1 185 110 75 Count for Sample 2 1 187 114 73 Average 186 112 74 4 Count for Sample 1 1 197 113 84 Count for Sample 2 1 201 123 78 Average 199 118 81 Table 2: Results showing the Colonies per 100 mL of Water Medium type Site 1 Site 2 Site 3 Site 4 Average (colonies/100 mL) Total count 172 182 186 199 1.85E+08 Coliscan – purple (E. coli) 66.5 72.5 74 81 7.35E+07 Coliscan – red, pink, & purple (coliforms) 105.5 109.5 112 118 1.11E+08 Total Coliform /100 ml per site 8.60E+07 9.10E+07 9.30E+07 9.95E+07 Discussion: This lab was done to determine the amount of E. Coli present in the water samples taken from each of the four sites visited. E-coli is a form of faecal coliform which originates from the faeces of humans or animals. It is an indication of the level of pollution in a tilapia pond because coliforms are not the normal flora of bacteria in fish. Even though it doesn’t not directly harm the tilapia, it can harm persons who consume the infected fish. It
  • 60.
    58 was found thatthe total coliform per 100mL of sites “A”, “B”, “C” and “D” was 8.60E+07, 9.10E+07, 9.30E+07 and 9.95E+07 respectively. These values were similar and relatively high, thus indicating that the pond in general was highly polluted. Even though the tilapia may survive in the pond, if they are consumed by humans, it may result in infections and illness. Conclusions: The level of E-Coli, a form of Faecal Coliform, present in the four sites were investigated and determined. The Faecal Coliform per 100mL levels of sites “A”, “B”, “C” and “D” were 8.60E+07, 9.10E+07, 9.30E+07 and 9.95E+07 respectively. Tilapia may survive with these levels, however if they are consumed by humans, it may result in health issues to the persons. Limitations: To obtain a specific evaluation of whether or not the water quality was ideal for the growth and survival of tilapia, the level of E-Coli should have been tested for over a longer period of time to allow the true levels and fluctuations to be seen.