Solution to the Practice Test 3A, Normal Probability Distribution
•
0 likes•782 views

Please Subscribe to this Channel for more solutions and lectures http://www.youtube.com/onlineteaching Elementary Statistics Practice Test 3 Module 2: Chapter 6 - Normal Probability Distribution

Recommended
Recommended
More Related Content
What's hot
What's hot (20)
Similar to Solution to the Practice Test 3A, Normal Probability Distribution
Similar to Solution to the Practice Test 3A, Normal Probability Distribution (20)
More from Long Beach City College
More from Long Beach City College (15)
Recently uploaded
Recently uploaded (20)
Solution to the Practice Test 3A, Normal Probability Distribution
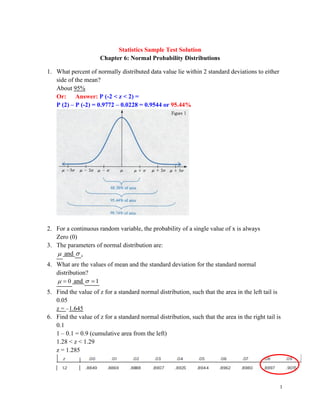
- 1. 1 Statistics Sample Test Solution Chapter 6: Normal Probability Distributions 1. What percent of normally distributed data value lie within 2 standard deviations to either side of the mean? About 95% Or: Answer: P (-2 < z < 2) = P (2) – P (-2) = 0.9772 – 0.0228 = 0.9544 or 95.44% 2. For a continuous random variable, the probability of a single value of x is always Zero (0) 3. The parameters of normal distribution are: and . 4. What are the values of mean and the standard deviation for the standard normal distribution? 0 = and 1 = 5. Find the value of z for a standard normal distribution, such that the area in the left tail is 0.05 z = –1.645 6. Find the value of z for a standard normal distribution, such that the area in the right tail is 0.1 1 – 0.1 = 0.9 (cumulative area from the left) 1.28 < z < 1.29 z = 1.285
- 2. 2 7. Find the following probability: P(z > –0.82) 1 – 0.2061 = 0.7939 8. The z-value for μ of normal distribution curve is always Zero, why? 9. Usually the normal distribution is used as an approximation to binomial distribution when np>5, and nq≥5 (In some texts: np > 10, and nq ≥ 10) 10. Three out of eight drinkers acquire the habit by age 20. If 300 drinkers are randomly selected, using normal approximation to the binomial distribution, find the probability that: Given: n = 300, p = 3/8 (0.375), q = 1 – p = 0.625 a. Exactly 100 acquire the habit by age 20 Binomial Distribution (BD): P(x = 100) Normal Distribution (ND): P = P ( 99.5 < x < 100.5) 𝜇 = 𝑛𝑝 = 300 ( 3 8 ) = 112.5 𝜎 = √𝑛𝑝𝑞 = √300 ( 3 8 ) ( 5 8 ) = 8.3853
- 3. 3 𝑧 = 𝑥 − 𝜇 𝜎 = 99.5 − 112.5 8.3853 = −1.55 𝑧 = 𝑥−𝜇 𝜎 = 100.5−112.5 8.3853 = −1.43 Standard Normal Distribution (SND): P(-1.5503 < z < -1.4311) = 0.0764 – 0.0606 = 0.0158 b. At least 125 acquired the habit by age 20 BD: P (x ≥ 125) = ND: P(x > 124.5) 𝑧 = 𝑥−𝜇 𝜎 = 124.5−112.5 8.3853 = 1.4311 SND: =P(z > 1.4311) = 1 – 0.9236 = 0.0764 c. At most 165 acquired the habit by age 20 BD: P(x ≤ 165) = ND: P(x < 165.5) 𝑧 = 𝑥−𝜇 𝜎 = 165.5−112.5 8.3853 = 6.3206
- 4. 4 above 3.5 in the Z-table SND: = P(z < 6.3206) = 0.9999 11. IQ scores are normally distributed with a mean of 100 and a standard deviation of 15. a. What percentage of people has an IQ score above 120? Given: normal distribution: μ = 100 σ = 15 P(x > 120) 𝑧 = 𝑥−𝜇 𝜎 = 120−100 15 = 1.33 P(x > 120) = P(z > 1.33) = 1 – 0.9082 = 0.0918, 9.18% b. What is the maximum IQ score for the bottom 30%? need to find x when area under the curve corresponds to 0.3 𝑧 = 𝑥 − 𝜇 𝜎 → 𝑥 = 𝜇 + 𝑍𝜎 – 0.53 < z < – 0.52 x = 100 + (– 0.525) ( 15) = 92.125 maximum IQ score for the bottom 30% is 92.125 12. Men have head breaths that are normally distributed with a mean of 6.0 in and a standard deviation of 1.0 in.
- 5. 5 a. If a man is randomly selected, find the probability that his head breadth is less than 6.2 in. Given: normal distribution, n = 1, : μ = 6.0 in., σ = 1.0 in. P( x < 6.2) 𝑧 = 𝑥−𝜇 𝜎 = 6.2−6.0 1 = 0.2 Answer: P (x < 6.2) = P (z < 0.2) = 0.5793 b. If 100 men are randomly selected, find the probability that their head breadth mean is less than 6.2 in. Given: n = 100 6.0 x in = = / x n = = 1.0/√𝟏𝟎𝟎 = 0.1, 𝑧 = 𝑥̅− μ σ/√𝑛 = 6.2−6.0 0.1 = 2 P ( x < 6.2) = P (z < 2) = 0.9772 13. Find the area of the shaded region. The graph depicts the standard normal distribution of bone density scores with mean 0 and standard deviation 1.
- 6. 6 Answer: p ( Z > − 0.93) = 0.8238 14. Assume that a randomly selected subject is given a bone density test. Those test scores are normally distributed with a mean of 0 and a standard deviation of 1. Find the probability that a given score is between −2.13 and 3.77 and draw a sketch of the region. Answer: p (− 2.13 < Z < 3.77) = 0.9833 15. Assume that a randomly selected subject is given a bone density test. Bone density test scores are normally distributed with a mean of 0 and a standard deviation of 1. Draw a graph and find P19, the 19th percentile. This is the bone density score separating the bottom 19% from the top 81 %.
- 7. 7 Table: 𝑨𝒍 = 𝟎. 𝟏𝟗𝟐𝟐 → 𝒁 = ─ 𝟎. 𝟖𝟕 & 𝑨𝒍 = 𝟎. 𝟏𝟖𝟗𝟒 → 𝒁 = ─ 𝟎. 𝟖𝟖 Answer: ─ 𝟎. 𝟖𝟖 𝒐𝒓 − 𝟎. 𝟖𝟕𝟓 16. Find the area of the shaded region. The graph to the right depicts IQ scores of adults, and those scores are normally distributed with a mean of 100 and a standard deviation of 15. 𝑧 = 𝑥 − μ σ = 106 − 100 15 = 0.4 & 𝑧 = 𝑥 − μ σ = 132 − 100 15 = 2.133 𝑷( 𝟏𝟎𝟔 < 𝒙 < 𝟏𝟑𝟐) = 𝑷( 𝟎. 𝟒 < 𝒁 < 𝟐. 𝟏𝟑𝟑) = 𝟎. 𝟗𝟖𝟑𝟒 ─ 𝟎. 𝟔𝟓𝟓𝟒 = 𝟎. 𝟑𝟐𝟖𝟎 𝑶𝒓 𝟎. 𝟑𝟐𝟖𝟏 17. The assets (in billions of dollars) of the 4 wealthiest people in a particular country are 33, 29, 16, 11. Assume that samples of size 𝒏 = 𝟐 are randomly selected with replacement from this population of 4 values. a. After identifying the 𝟏𝟔 = 𝟐𝟒 different possible samples and finding the mean of each sample, construct a table representing the sampling distribution of the sample mean. In the table, values of the sample mean that are the same have been combined. Answer: Sample 33,33 33,29 33, 16 33,11 29,33 29,29 29,16 29,11 Continue 𝑥̅ 33 31 24.5 22 31 29 22.5 20 … 𝑝(𝑥 ̅̅̅̅̅) 1/16 1/16 1/16 1/16 1/16 1/16 1/16 1/16 …
- 8. 8 b. Compare the mean of the population to the mean of the sampling distribution of the sample mean. Answer: 𝜇 = ∑ 𝑥 𝑁 = 33 + 29 + 16 + 11 4 = 22.25 𝜇𝑥̅ = ∑ 𝑥̅ 𝑃(𝑥̅) = 33 ( 1 16 ) + 31 ( 2 16 ) + ⋯ + 11( 1 16 ) = 22.25 The mean of the population: 𝜇 = 22.25 Is Equal To: The mean of the sample means: 𝜇𝑥̅ = 22.25 c. Do the sample means target the value of the population mean? In general, do sample means make good estimates of population means? Why or why not? Answer: Yes, the sample means do target the population mean. In general, sample means make good estimates of population means because the mean is an unbiased estimator. An unbiased estimator is the one such that the expected value or the mean of the estimates obtained from samples of a given size is equal to the parameter being estimated. In this case: 𝜇𝑥̅ = 𝜇 = 22.25
- 9. 9 18. The population of current statistics students has ages with mean μ and standard deviation σ. Samples of statistics students are randomly selected so that there are exactly 44 students in each sample. For each sample, the mean age is computed. What does the central limit theorem tell us about the distribution of those mean ages? Answer: σ √𝑛 = σ √44 19. A boat capsized and sank in a lake. Based on an assumption of a mean weight of 137 lb., the boat was rated to carry 50 passengers(so the load limit was 6,850 lb.). After the boat sank, the assumed mean weight for similar boats was changed from 137 lb. to 170 lb. a. Assume that a similar boat is loaded with 50 passengers, and assume that the weights of people are normally distributed with a mean of 174.1 lb. and a standard deviation of 35.1 lb. Find the probability that the boat is overloaded because the 50 passengers have a mean weight greater than 137 lb. Given: n = 50, μ = 174.1 σ = 35.1 P(𝑥̅ ≥ 137) = P (z > – 7.474) =1 𝑧 = 𝑥̅ − μ σ/√𝑛 = 137 − 174.1 35.1/√50 = −7.474 – 7.471 Answer: Almost 1.0000.
- 10. 10 b. The boat was later rated to carry only 15 passengers, and the load limit was changed to 2,550 lb. Find the probability that the boat is overloaded because the mean weight of the passengers is greater than 170 (so that their total weight is greater than the maximum capacity of 2,550 lb). Given: n = 15, μ = 174.1 σ = 35.1 P(𝑥̅ > 170) = 𝑧 = 𝑥̅ − μ σ/√𝑛 = 170 − 174.1 35.1/√15 = −0.4524 P(𝑥̅ > 170) = P (z > – 0.4524) =0.6736 or 0.6772 Technology Answer: 0.6745. c. Do the new ratings appear to be safe when the boat is loaded with 15 passengers? Answer: Because there is a high probability of overloading, the new ratings do not appear to be safe when the boat is loaded with 15 passengers. 20. At an airport, passengers arriving at the security checkpoint have waiting times that are uniformly distributed between 0 minutes and 10 minutes. All of the different possible waiting times are equally likely. Find the probability that a randomly selected passenger has a waiting time of at least 7 minutes. Given: The total area under the curve = 1.00, 𝒘𝒊𝒅𝒕𝒉 = 𝟏𝟎
- 11. 11 Height (the probability) = 1 𝑤𝑖𝑑𝑡ℎ → ℎ = 1 10 = 0.1 P (wait time of at least 7 min) = P(x ≥ 7) = = height × width of shaded area in the figure = 0.1 × 3 = 0.3