Download to read offline


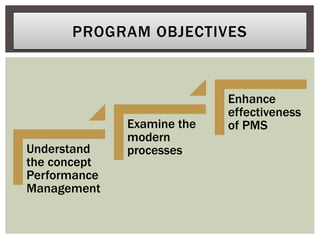
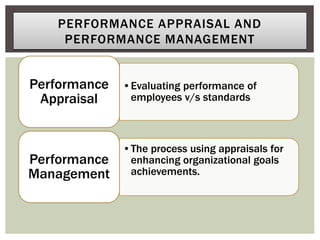


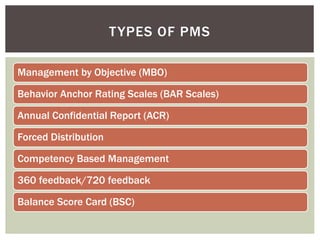

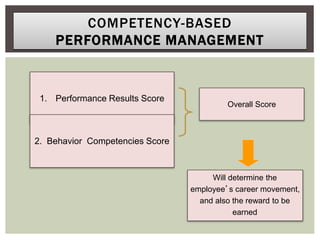

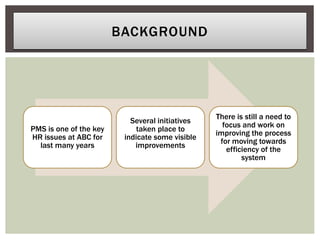
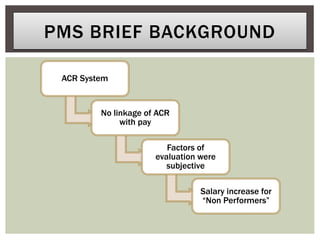
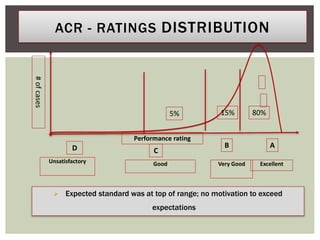
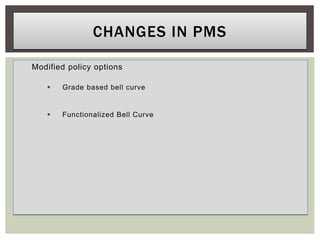
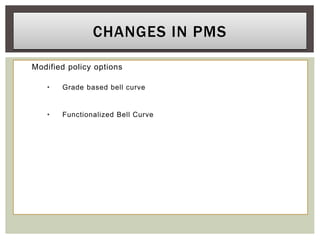

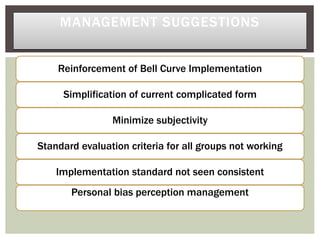

This document discusses performance management. It outlines the objectives of understanding the concept of performance management and examining modern processes. It describes the difference between performance appraisal and performance management, with appraisal focusing on evaluating employee performance against standards, and management using appraisals to enhance organizational goals. The document then discusses various methods of performance management like management by objectives and balanced scorecards. It uses an example of implementing a performance management system at ABC Bank, outlining issues with their previous appraisal system and changes made, including introducing a bell curve distribution and modified policies. Suggestions are provided for further improving the system.


