


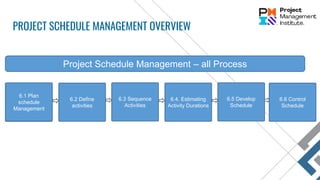


![PLAN SCHEDULE MANAGEMENT: OUTPUTS
Schedule Management Plan
Project schedule model development.
Release and iteration length. When using an adaptive life cycle, the time-boxed periods for releases, waves, and iterations are specified.
Level of accuracy. The level of accuracy specifies the acceptable range used in determining realistic activity duration estimates and may include an amount for
contingencies.
Units of measure. Each unit of measurement (such as staff hours, staff days, or weeks for time measures, or meters, liters, tons, kilometers, or cubic yards for
quantity measures) is defined for each of the resources.
Organizational procedures links. The work breakdown structure (WBS) (Section 5.4) provides the framework for the schedule management plan, allowing for
consistency with the estimates and resulting schedules.
Project schedule model maintenance. The process used to update the status and record progress of the project in the schedule model during the execution of the
project is defined.
Control thresholds. Variance thresholds for monitoring schedule performance may be specified to indicate an agreed-upon amount of variation to be allowed
before some action needs to be taken. Thresholds are typically expressed as percentage deviations from the parameters established in the baseline plan.
Rules of performance measurement. Earned value management (EVM) rules or other physical measurement rules of performance measurement are set. For
example, the schedule management plan may specify:
- Rules for establishing percent complete,
- EVM techniques (e.g., baselines, fixed-formula, percent complete, etc.) to be employed (for more specific information, refer to the Practice Standard for Earned
Value Management [17]), and
- Schedule performance measurements such as schedule variance (SV) and schedule performance index (SPI) used to assess the magnitude of variation to the
original schedule baseline.
Reporting formats. The formats and frequency for the various schedule reports are defined.](https://image.slidesharecdn.com/pmp-schedulemanagementarea-210215192718/85/PMP-Schedule-Management-area-11-320.jpg)


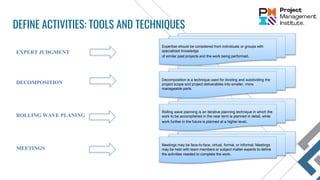
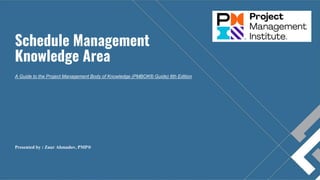
![SEQUENCE ACTIVITIES: TOOLS AND TECHNIQUES
PRECEDENCE DIAGRAMMING METHOD
Constructing a schedule model in which activities are represented by nodes and are graphically linked by one or more logical relationships to show the
sequence in which the activities are to be performed.
Finish-to-start (FS) > [Most common used]
Finish-to-finish (FF)
Start-to-start (SS)
Start-to-finish (SF) > [Very rarely used ]
Activity A Activity B
Finish-to-start (FS)
Activity A Activity A
Activity B
Start-to-start (SS)
Activity B
Finish-to-finish (FF)
Activity A Activity B
Start-to-Finish (SF)
Precedence Diagramming Method (PDM) Relationship Types
Dependency Determination and Integration
Mandatory dependencies >
Sometimes called: hard logic or hard dependencies
Discretionary dependencies >
Sometimes called: preferred logic, preferential logic, or soft logic
External dependencies > (Out of project team control)
Internal dependencies > (Under project team control)](https://image.slidesharecdn.com/pmp-schedulemanagementarea-210215192718/85/PMP-Schedule-Management-area-17-320.jpg)


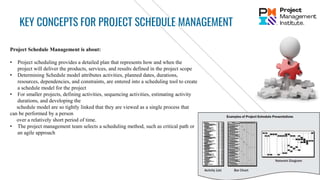
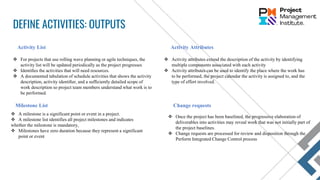
![Estimate Activity Durations : TOOLS & TECHNIQUES
Bottom-UP Estimating / Exact estimating on WBS based
More accurate and detailed estimating
Duration of each work packages are estimating
Takes huge time but most accurate and reliable.
Why Bottom-Up ? Because it’s estimating each work package duration from bottom to top.
Data Analysis [Alternatives analysis and Reserve analysis]
Alternatives analysis : Alternatives analysis is used to compare various levels of resource capability or skills; scheduling
compression techniques, different tools and make, rent, or buy decisions regarding the resources.
Reserve analysis : Reserve analysis is used to determine the amount of contingency and management reserve needed for
the project.](https://image.slidesharecdn.com/pmp-schedulemanagementarea-210215192718/85/PMP-Schedule-Management-area-25-320.jpg)


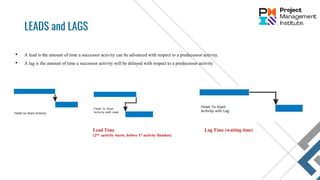
The document provides information on key concepts and processes for project schedule management according to the PMBOK Guide. It discusses defining activities, sequencing activities, estimating durations, and developing the project schedule. It outlines various inputs, tools/techniques, and outputs for each process. Trends in scheduling mentioned include iterative scheduling with a backlog and on-demand scheduling. Considerations for agile environments include short planning cycles, rapid feedback, prioritizing backlogs, and welcoming change.