Download to read offline
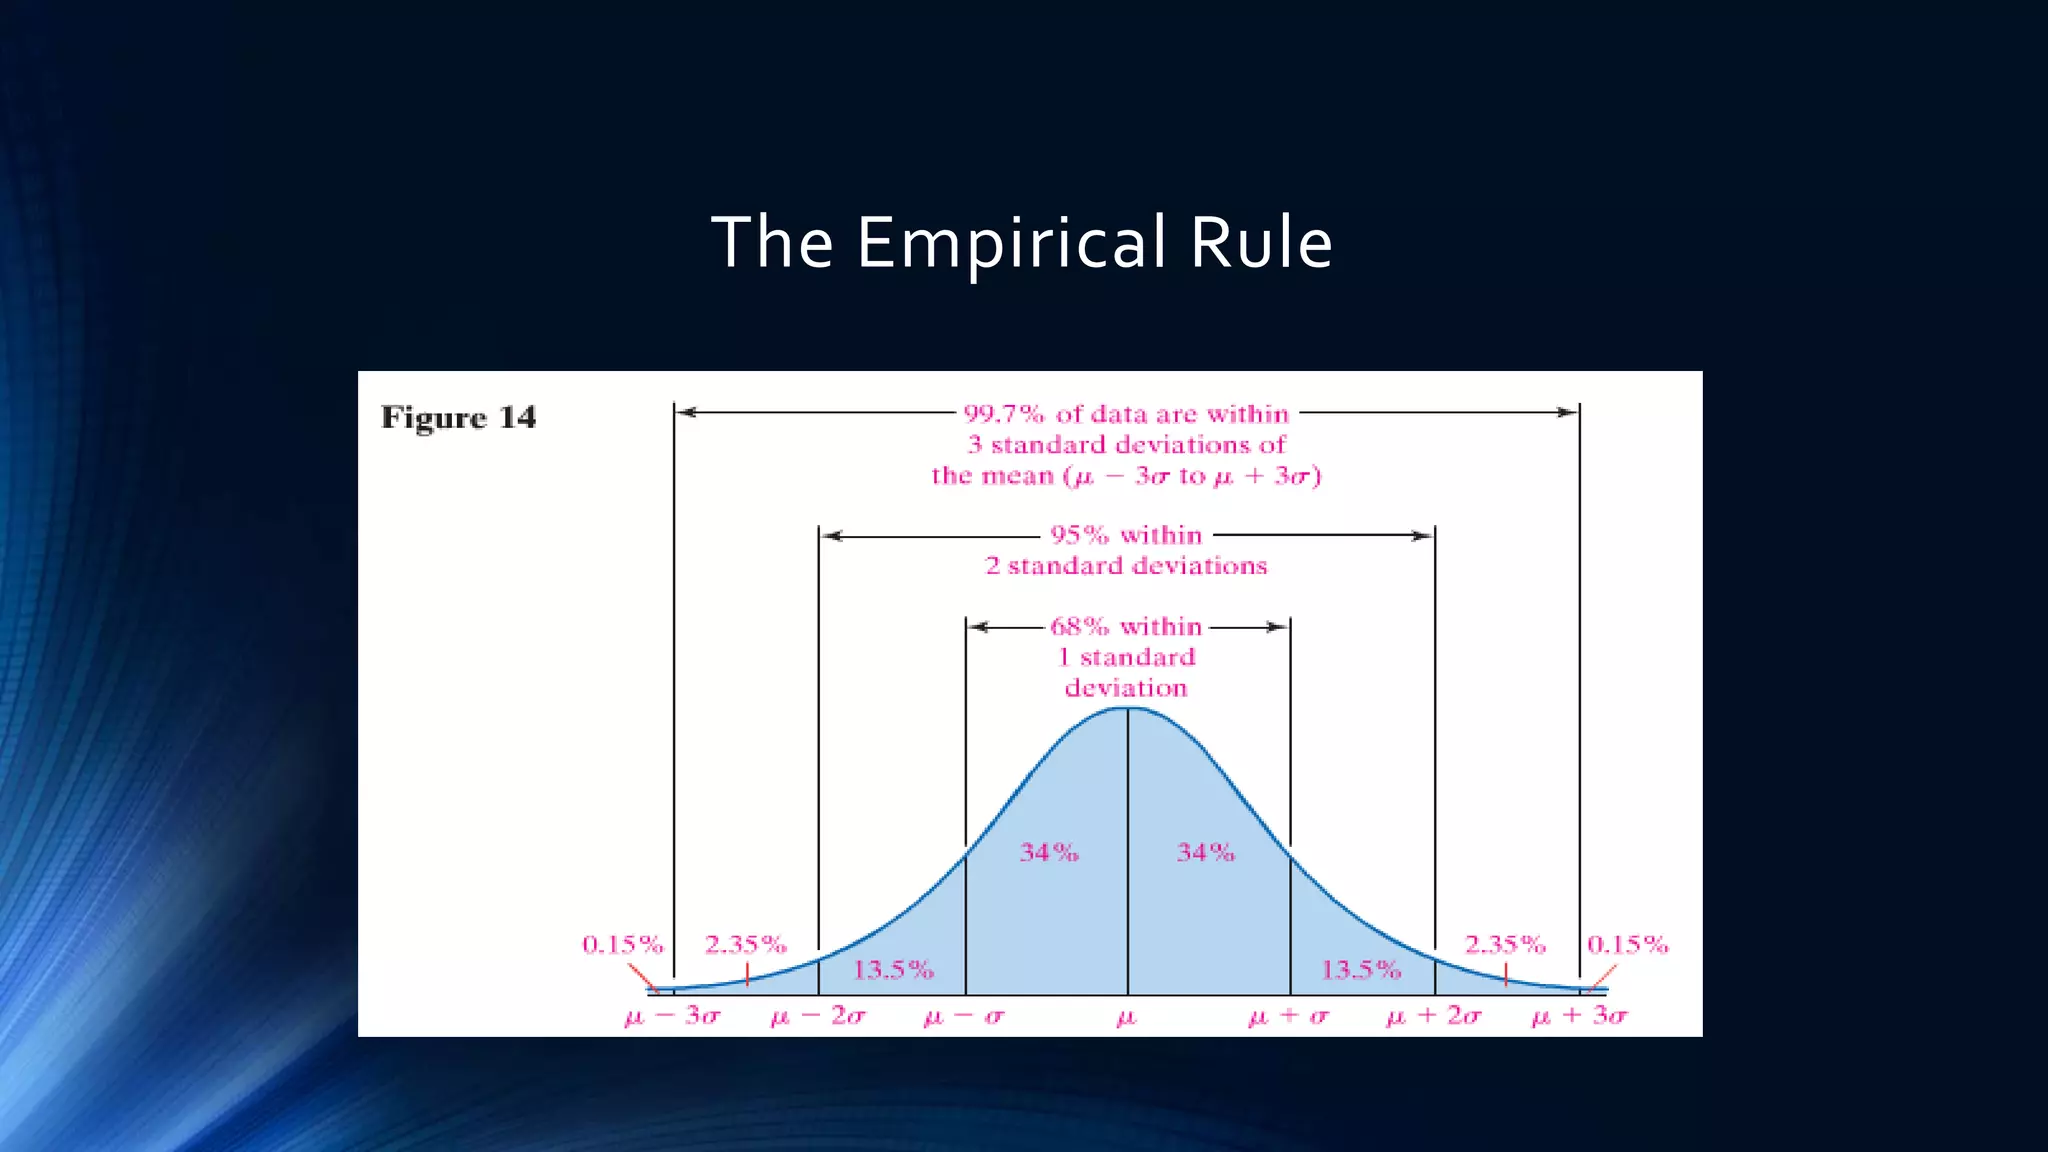
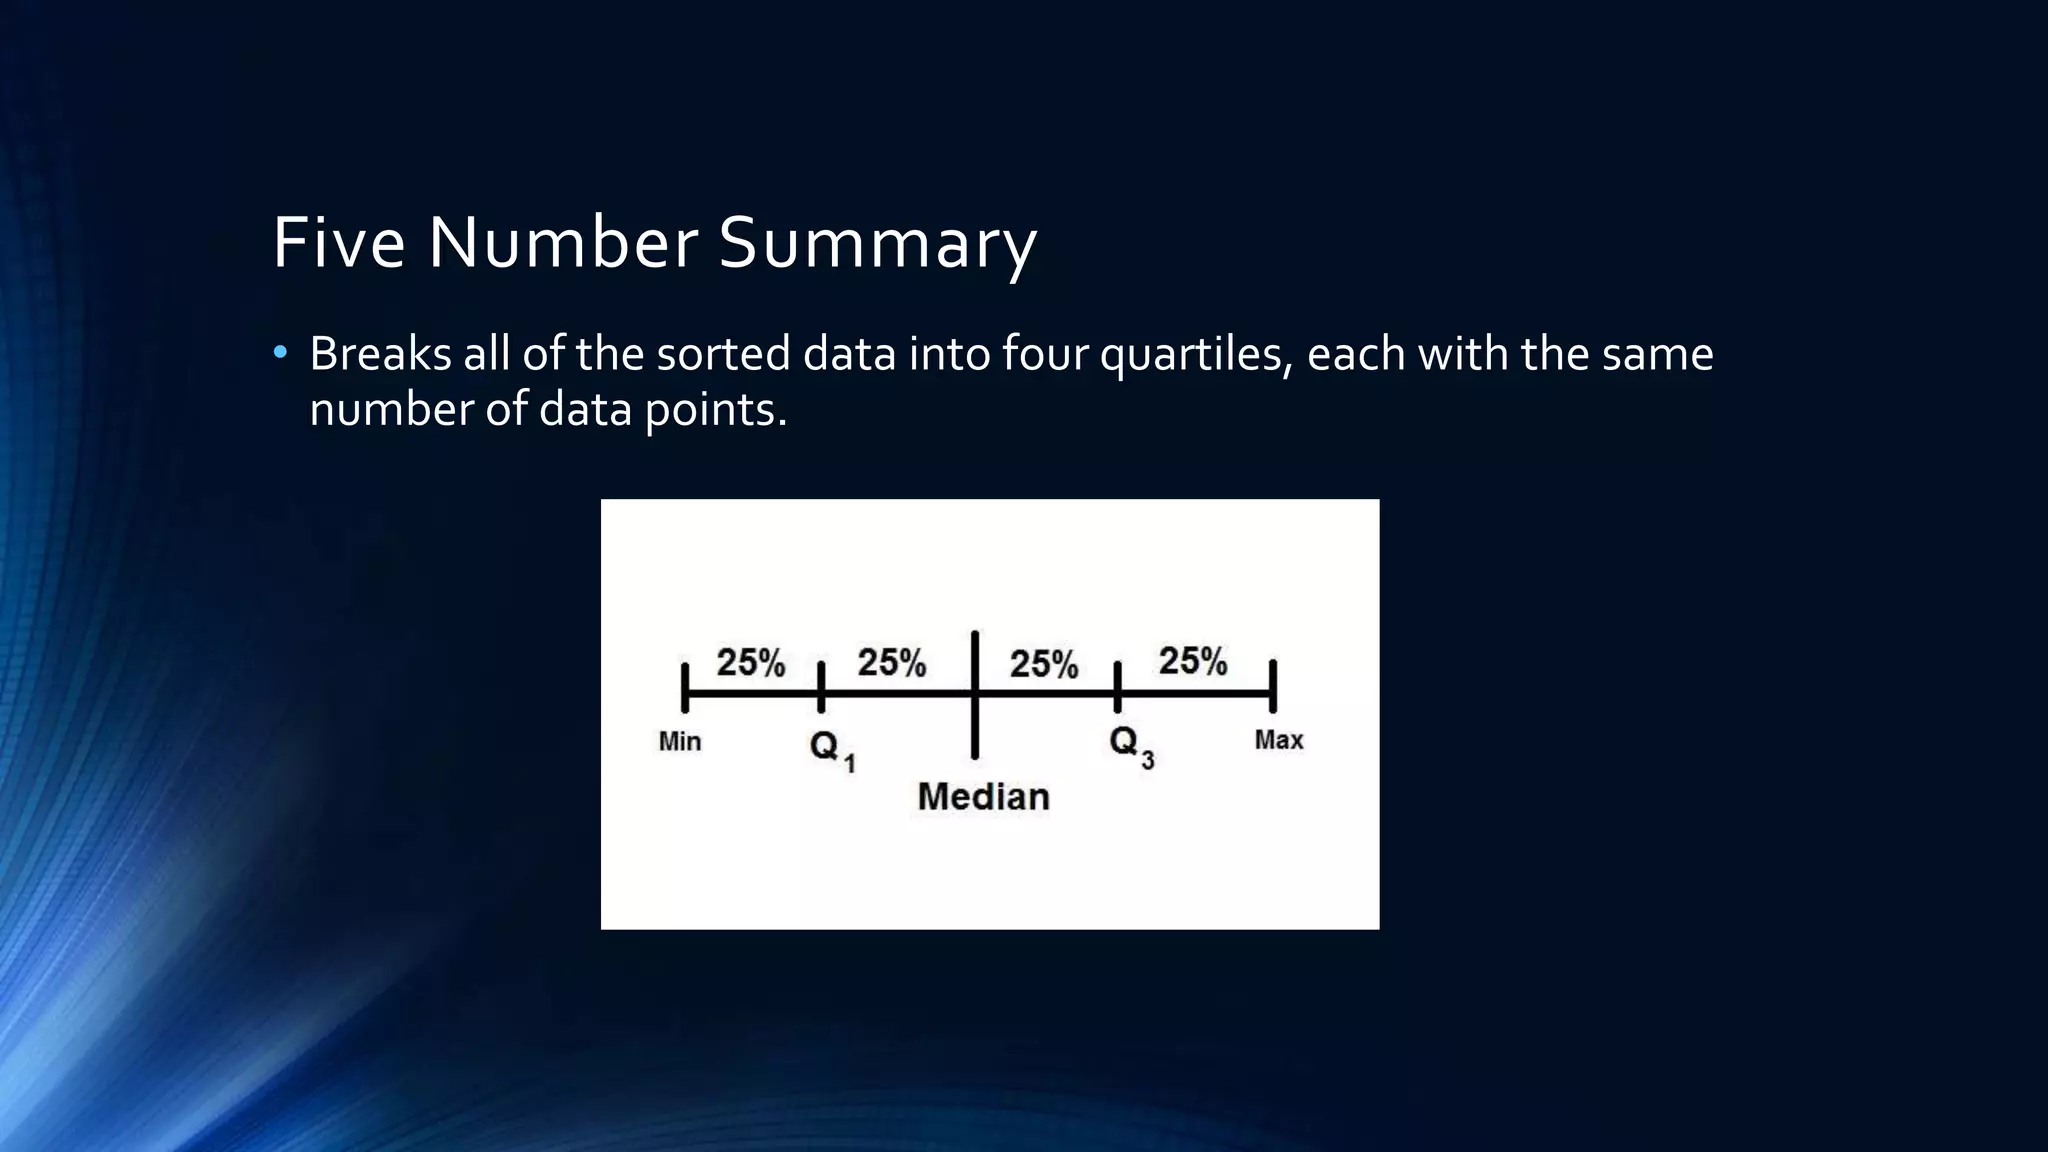
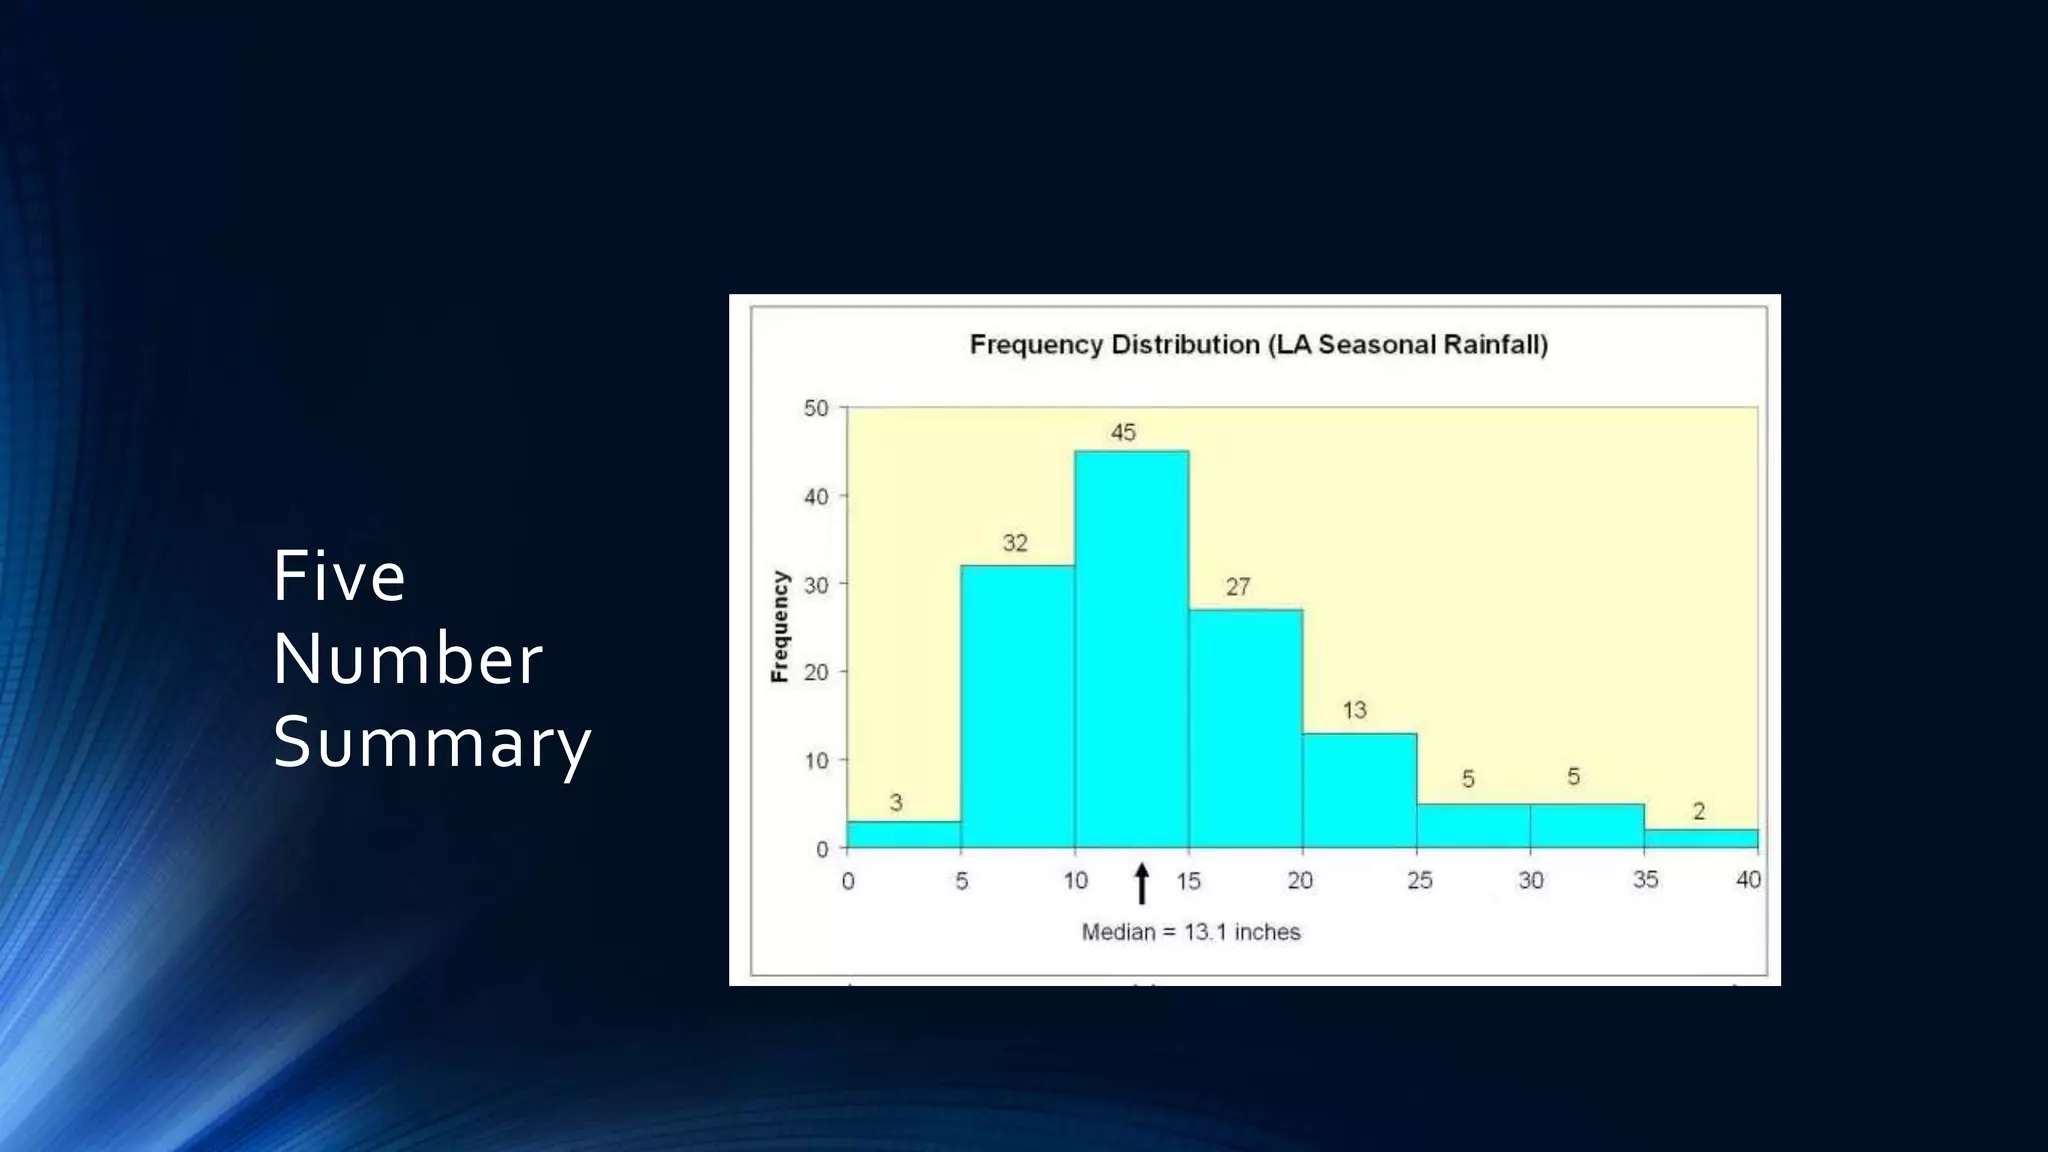
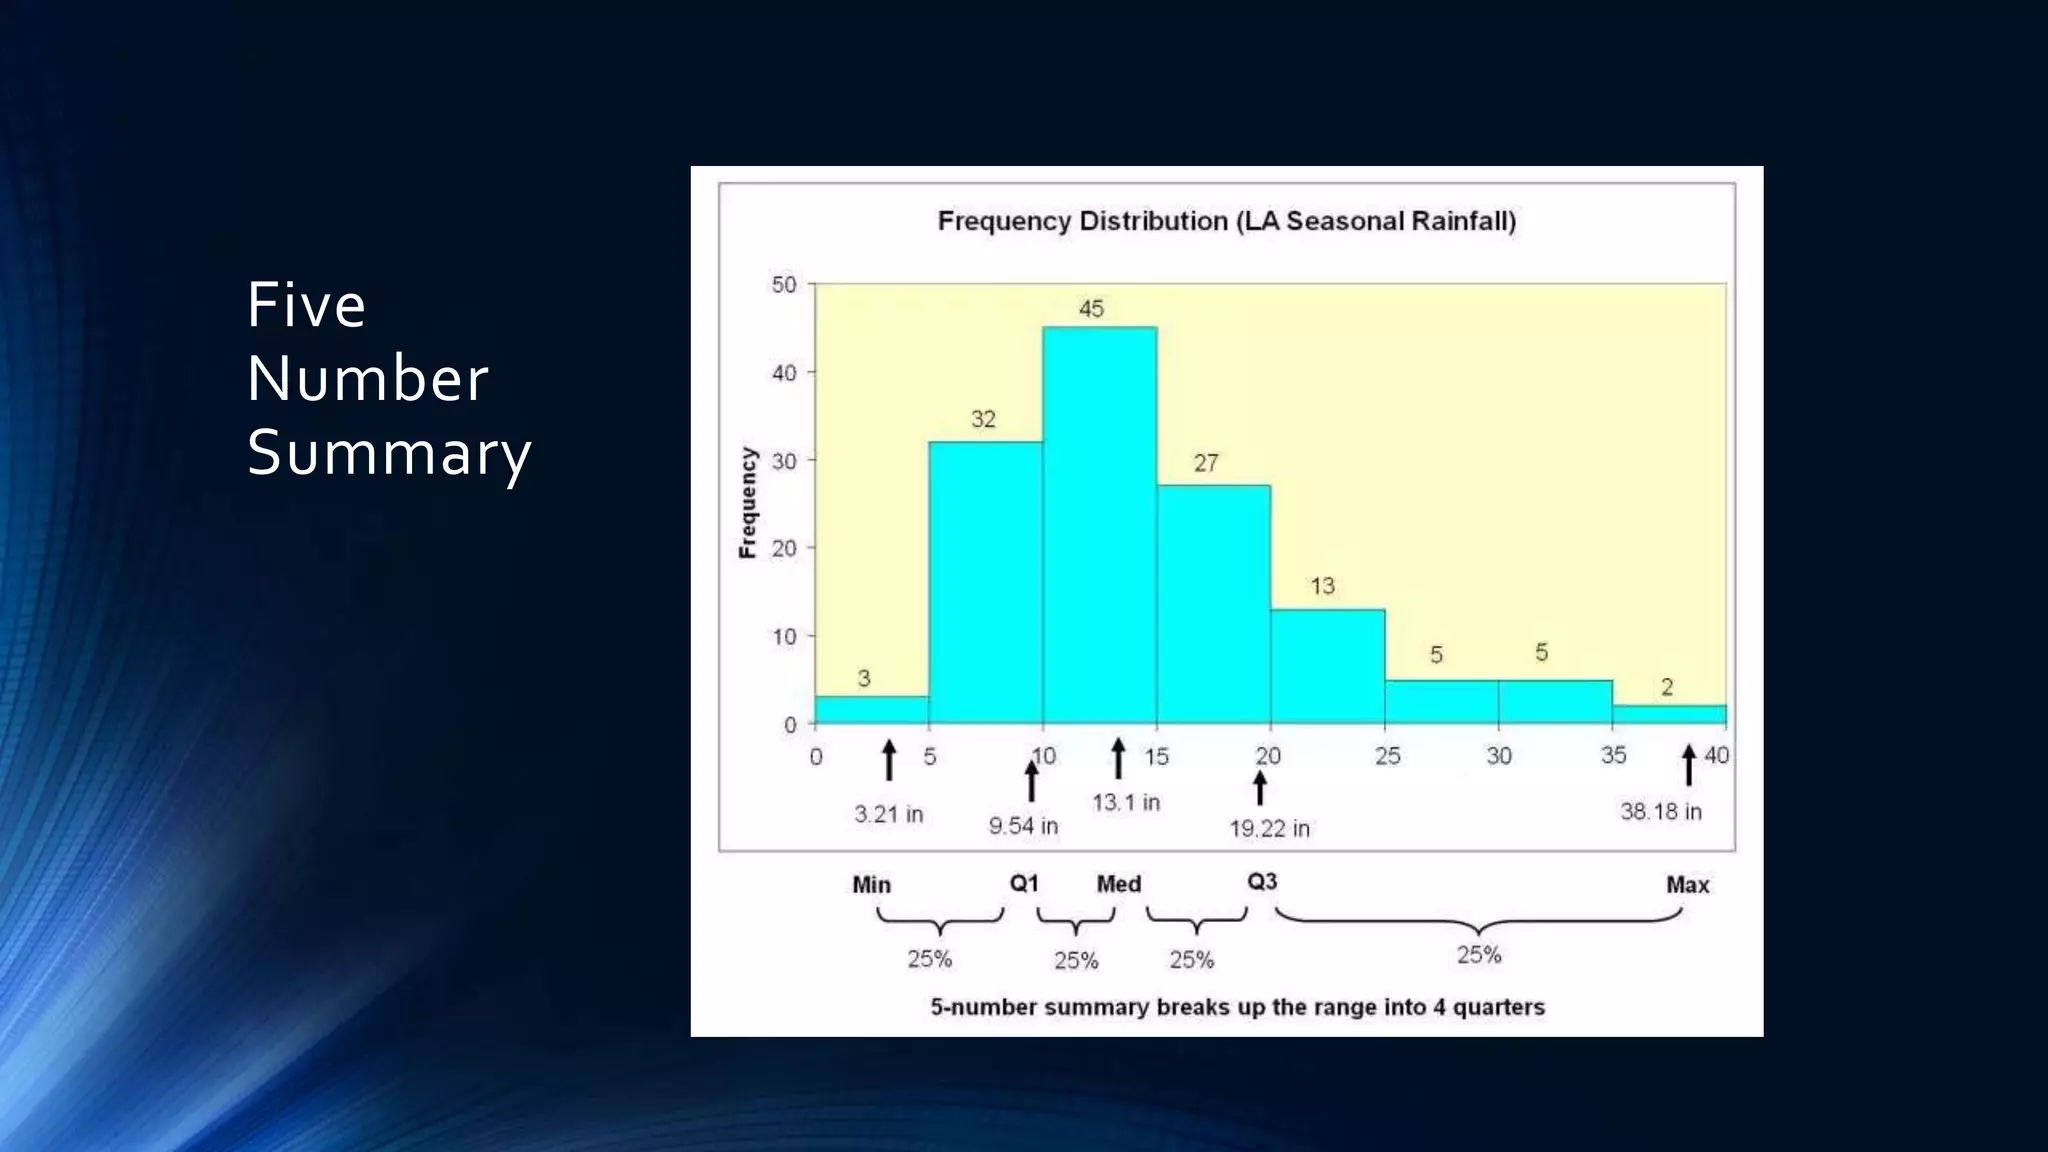
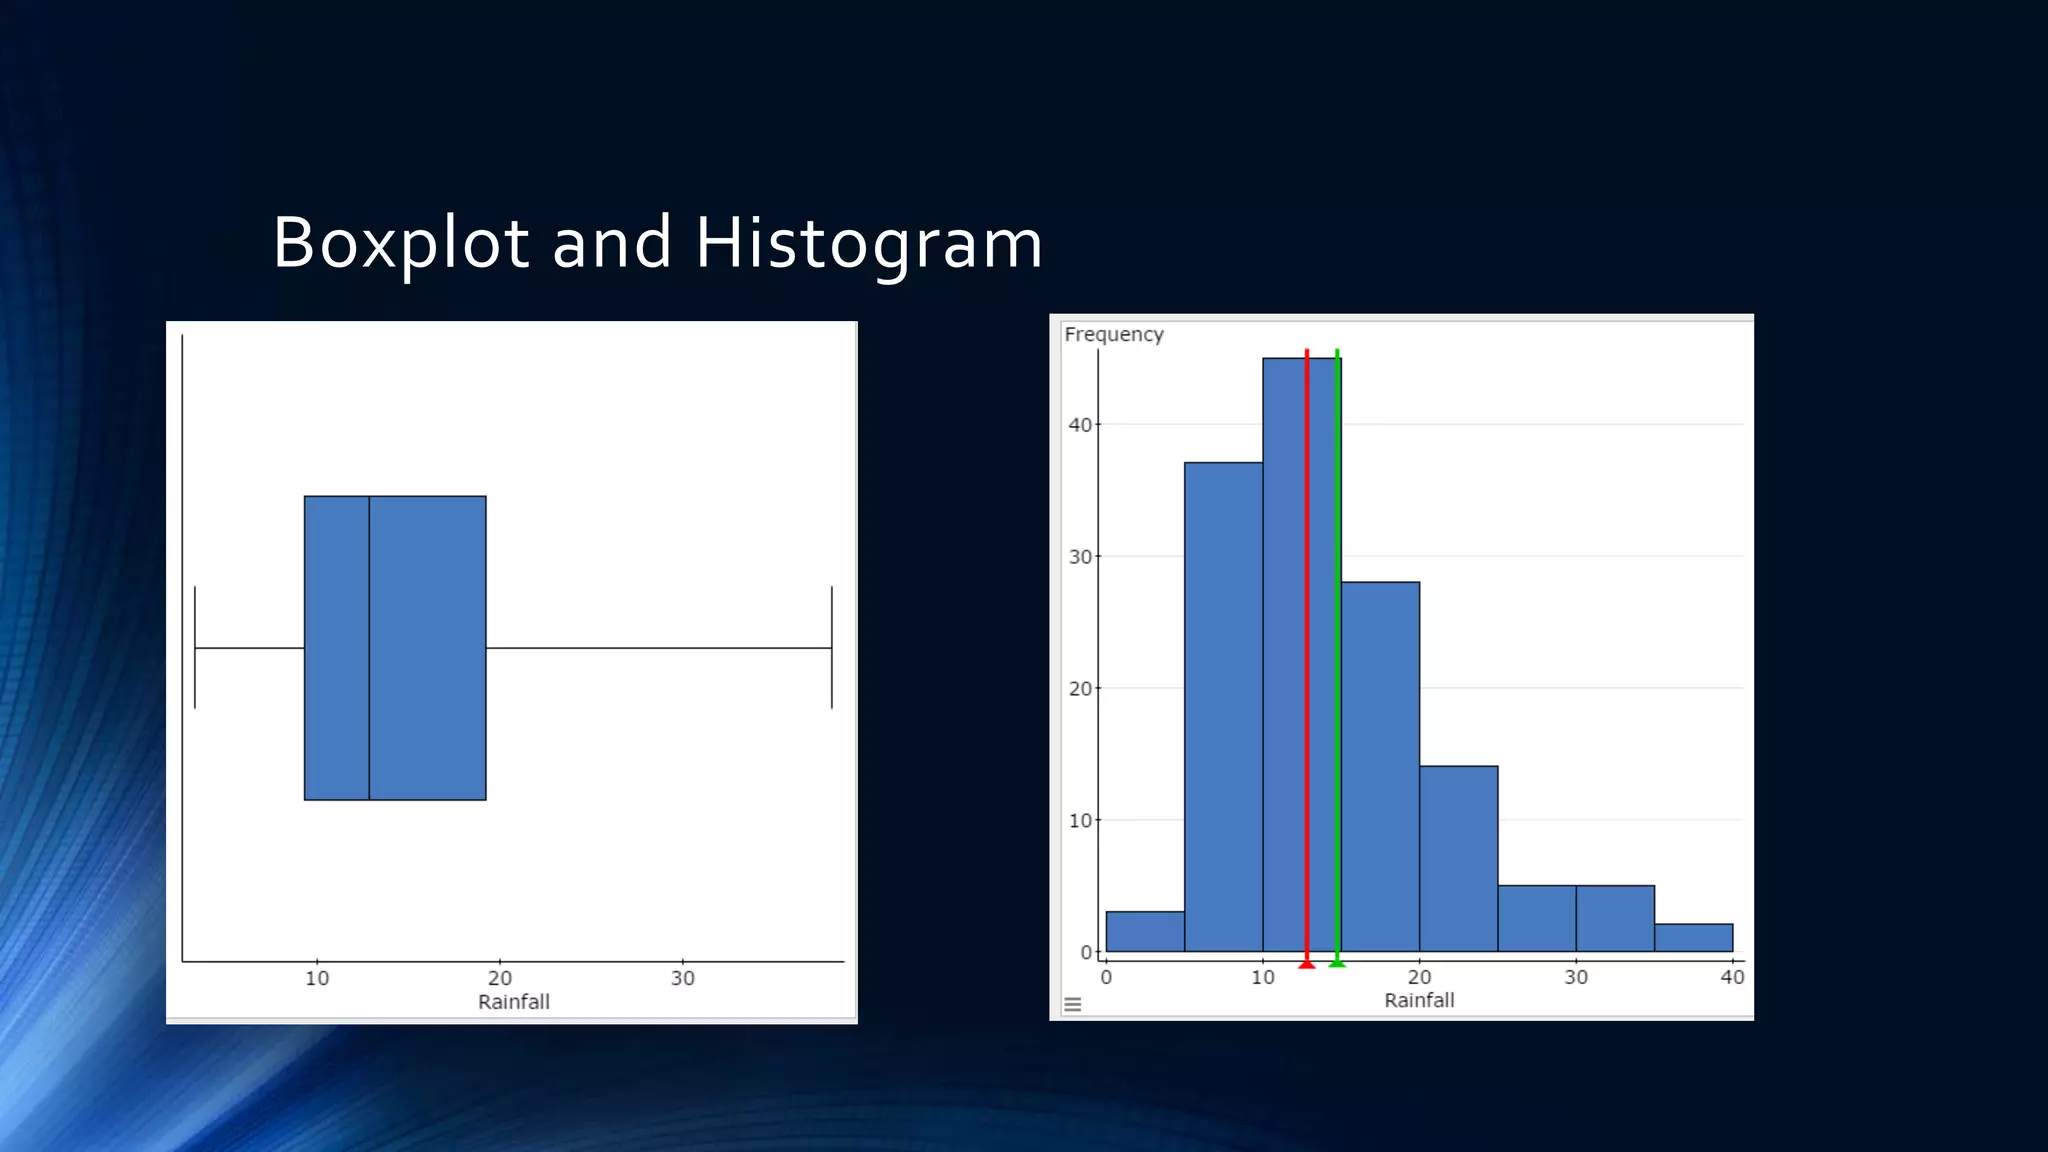
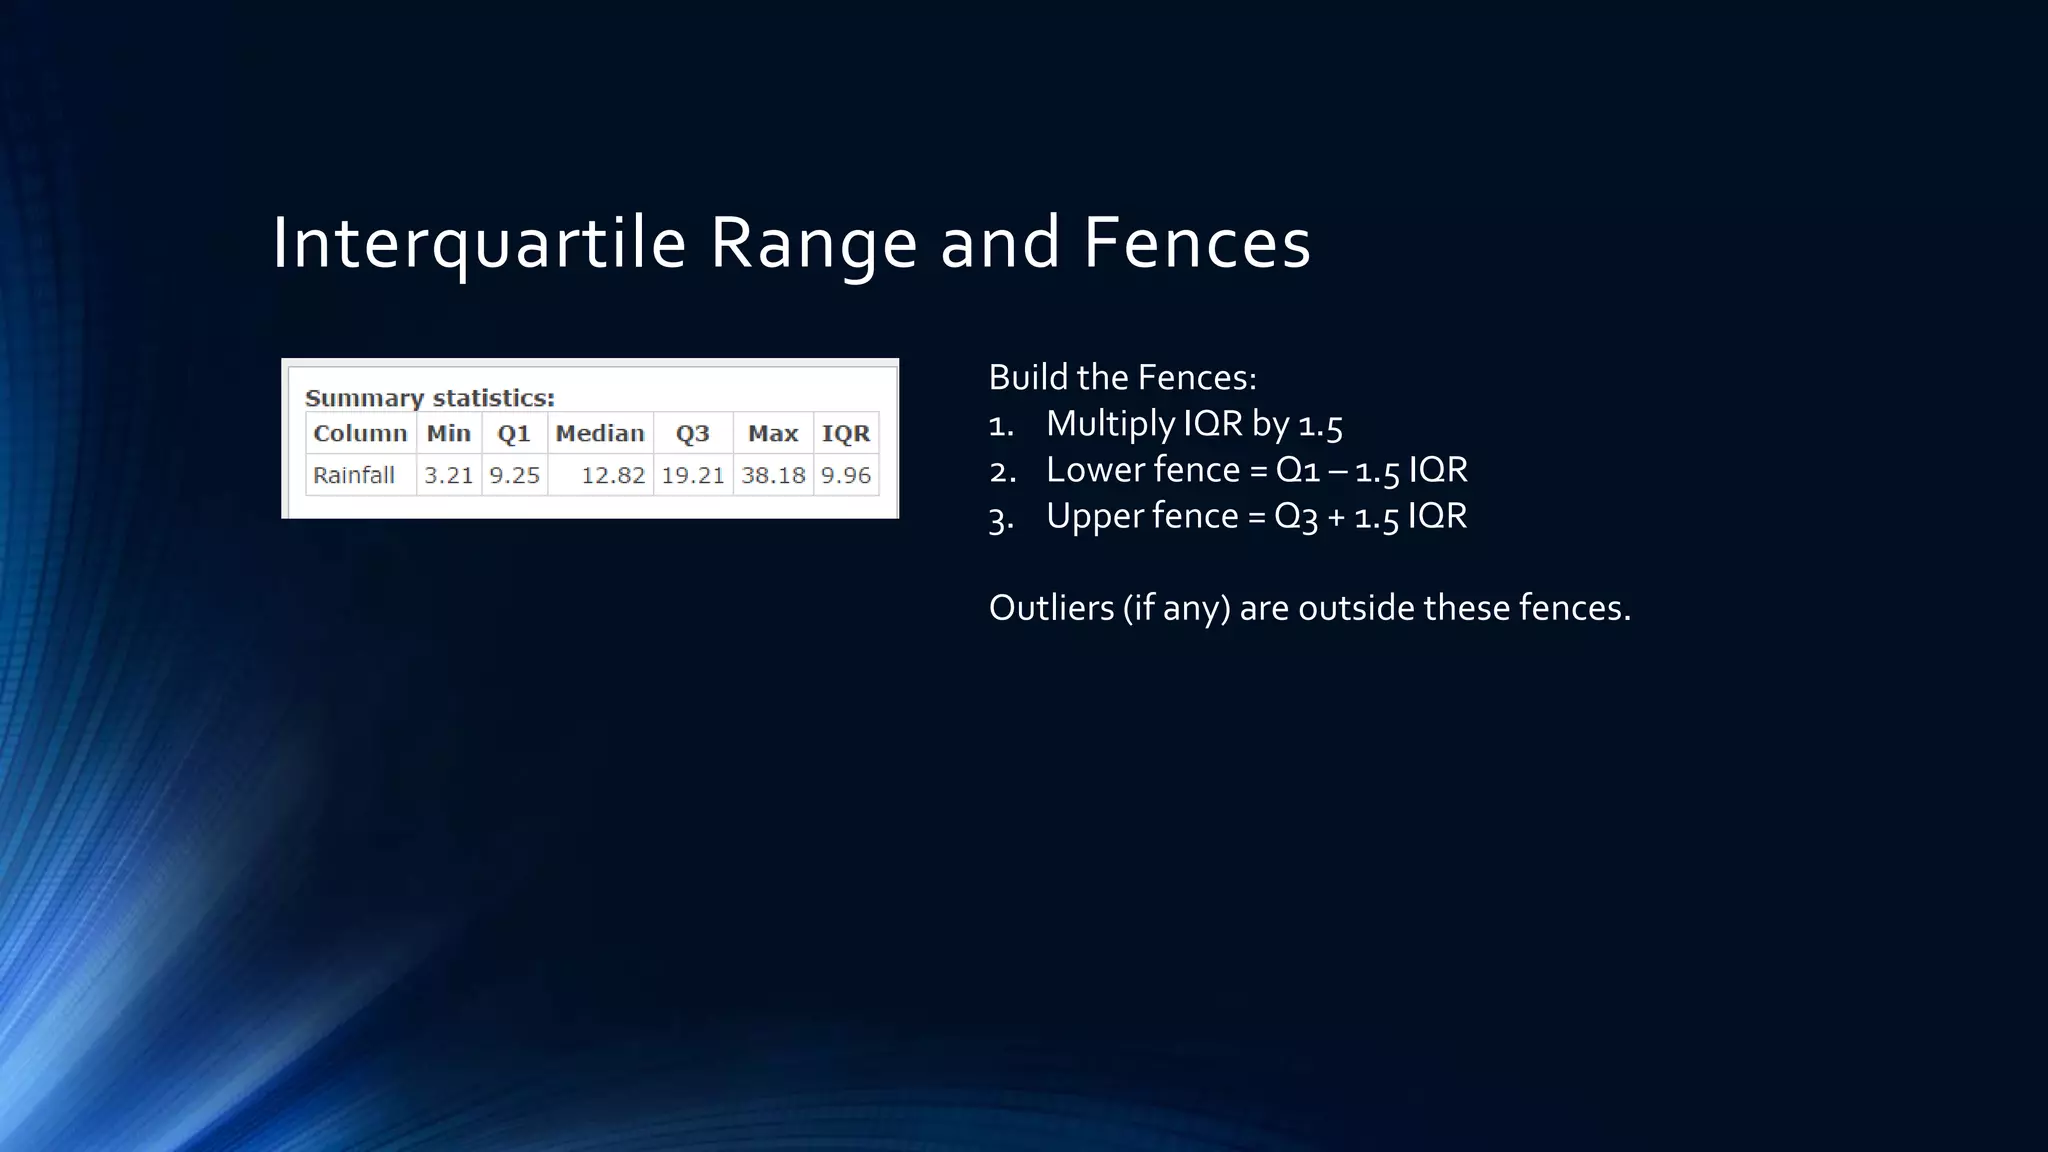
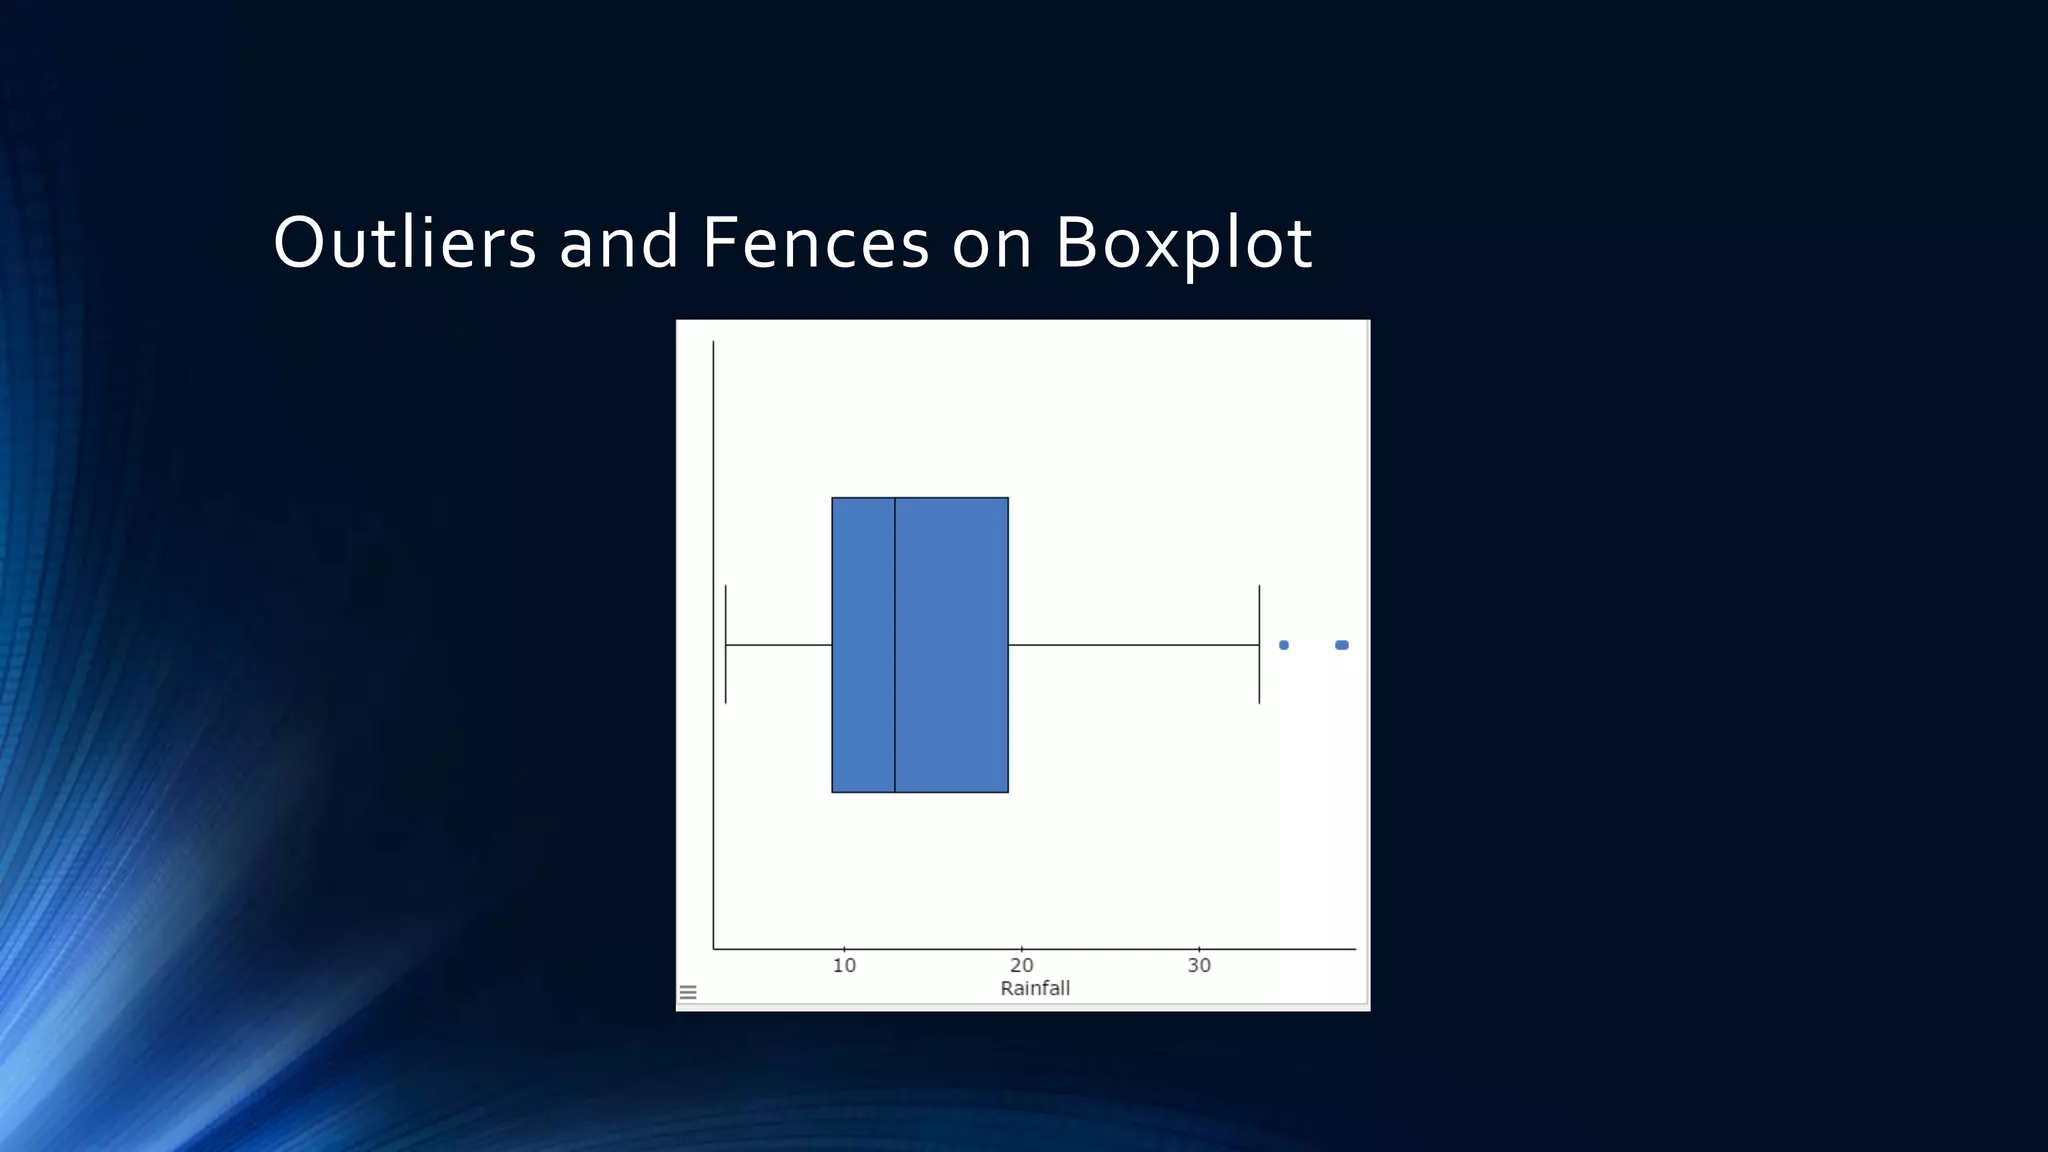
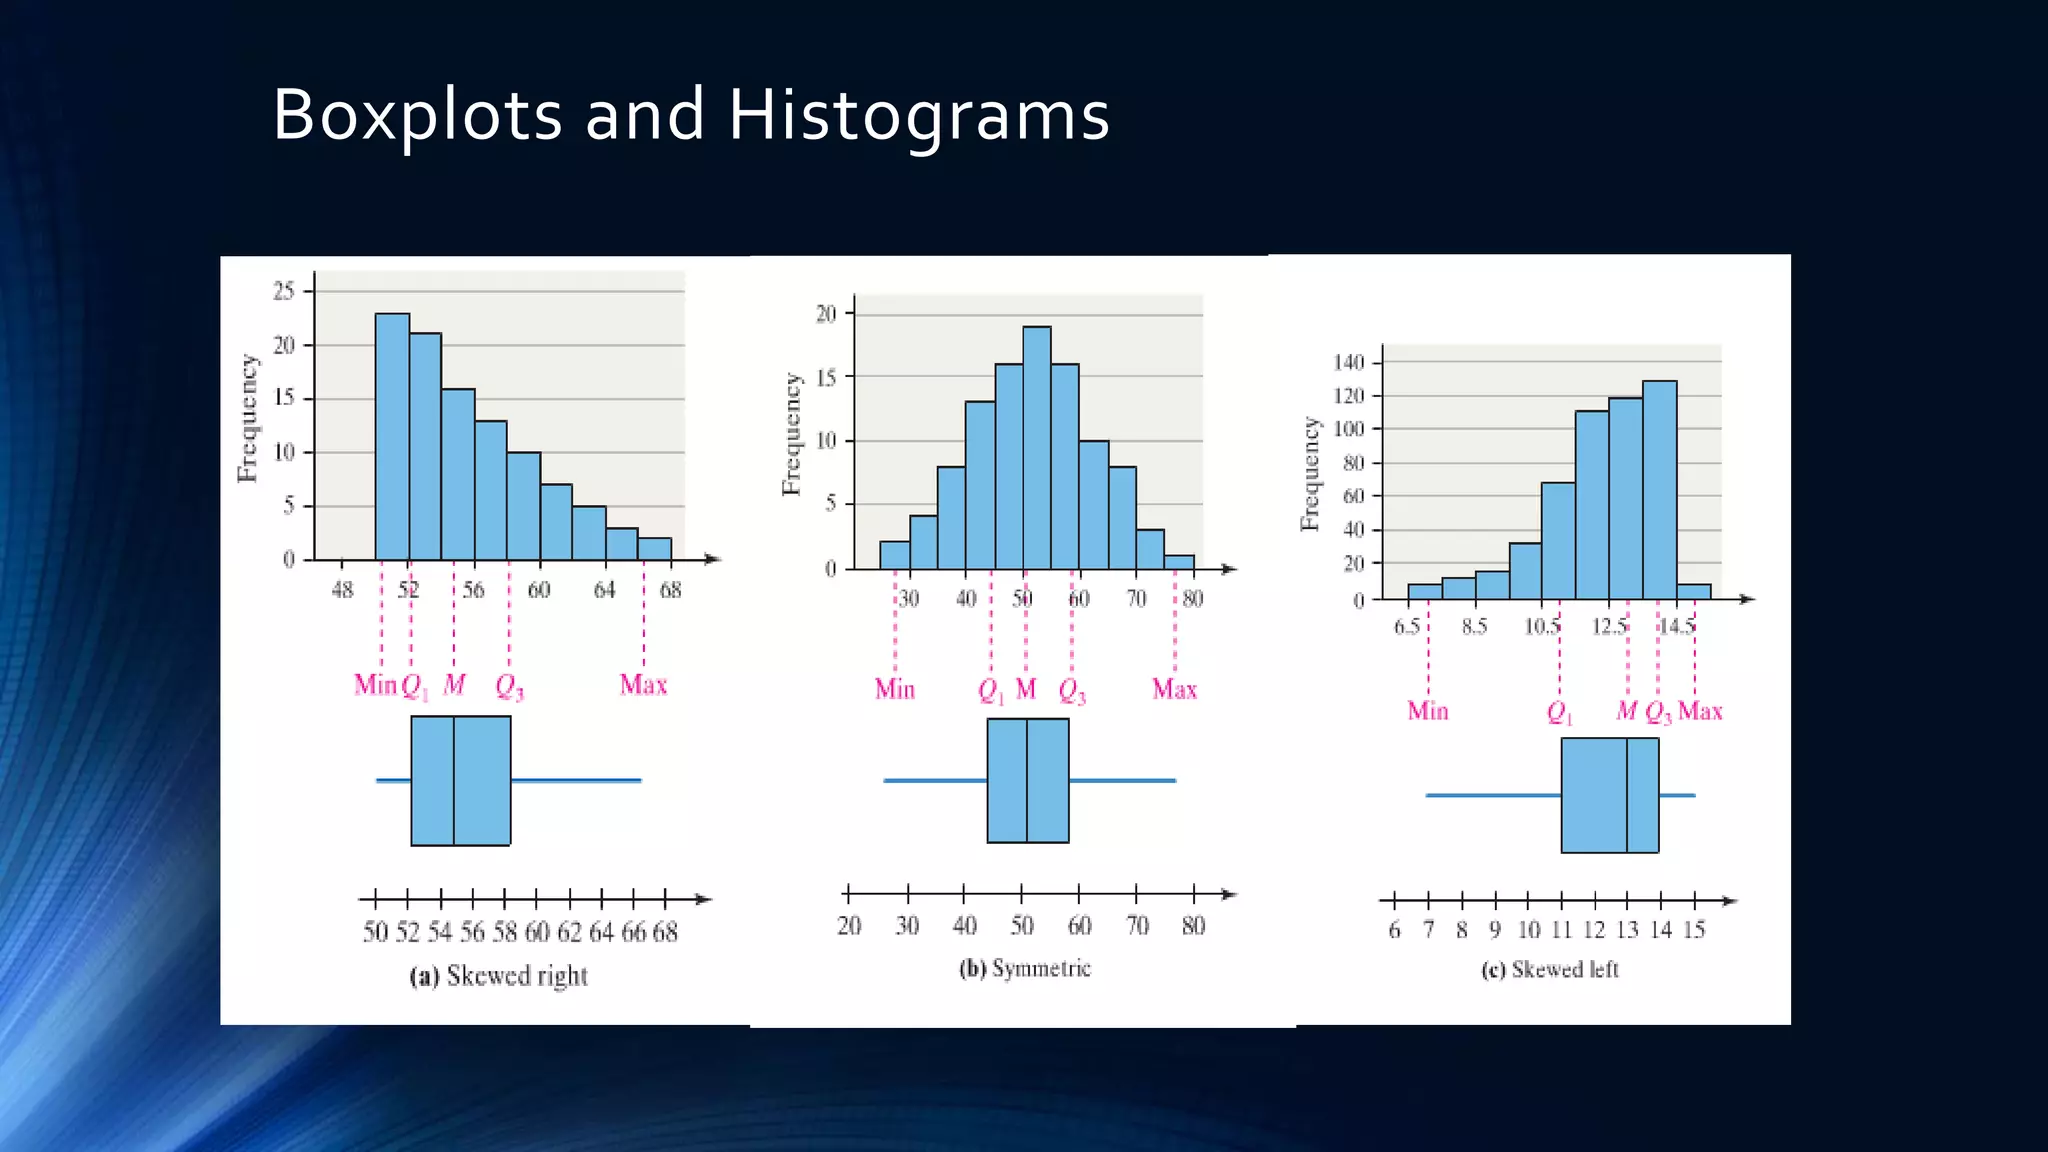
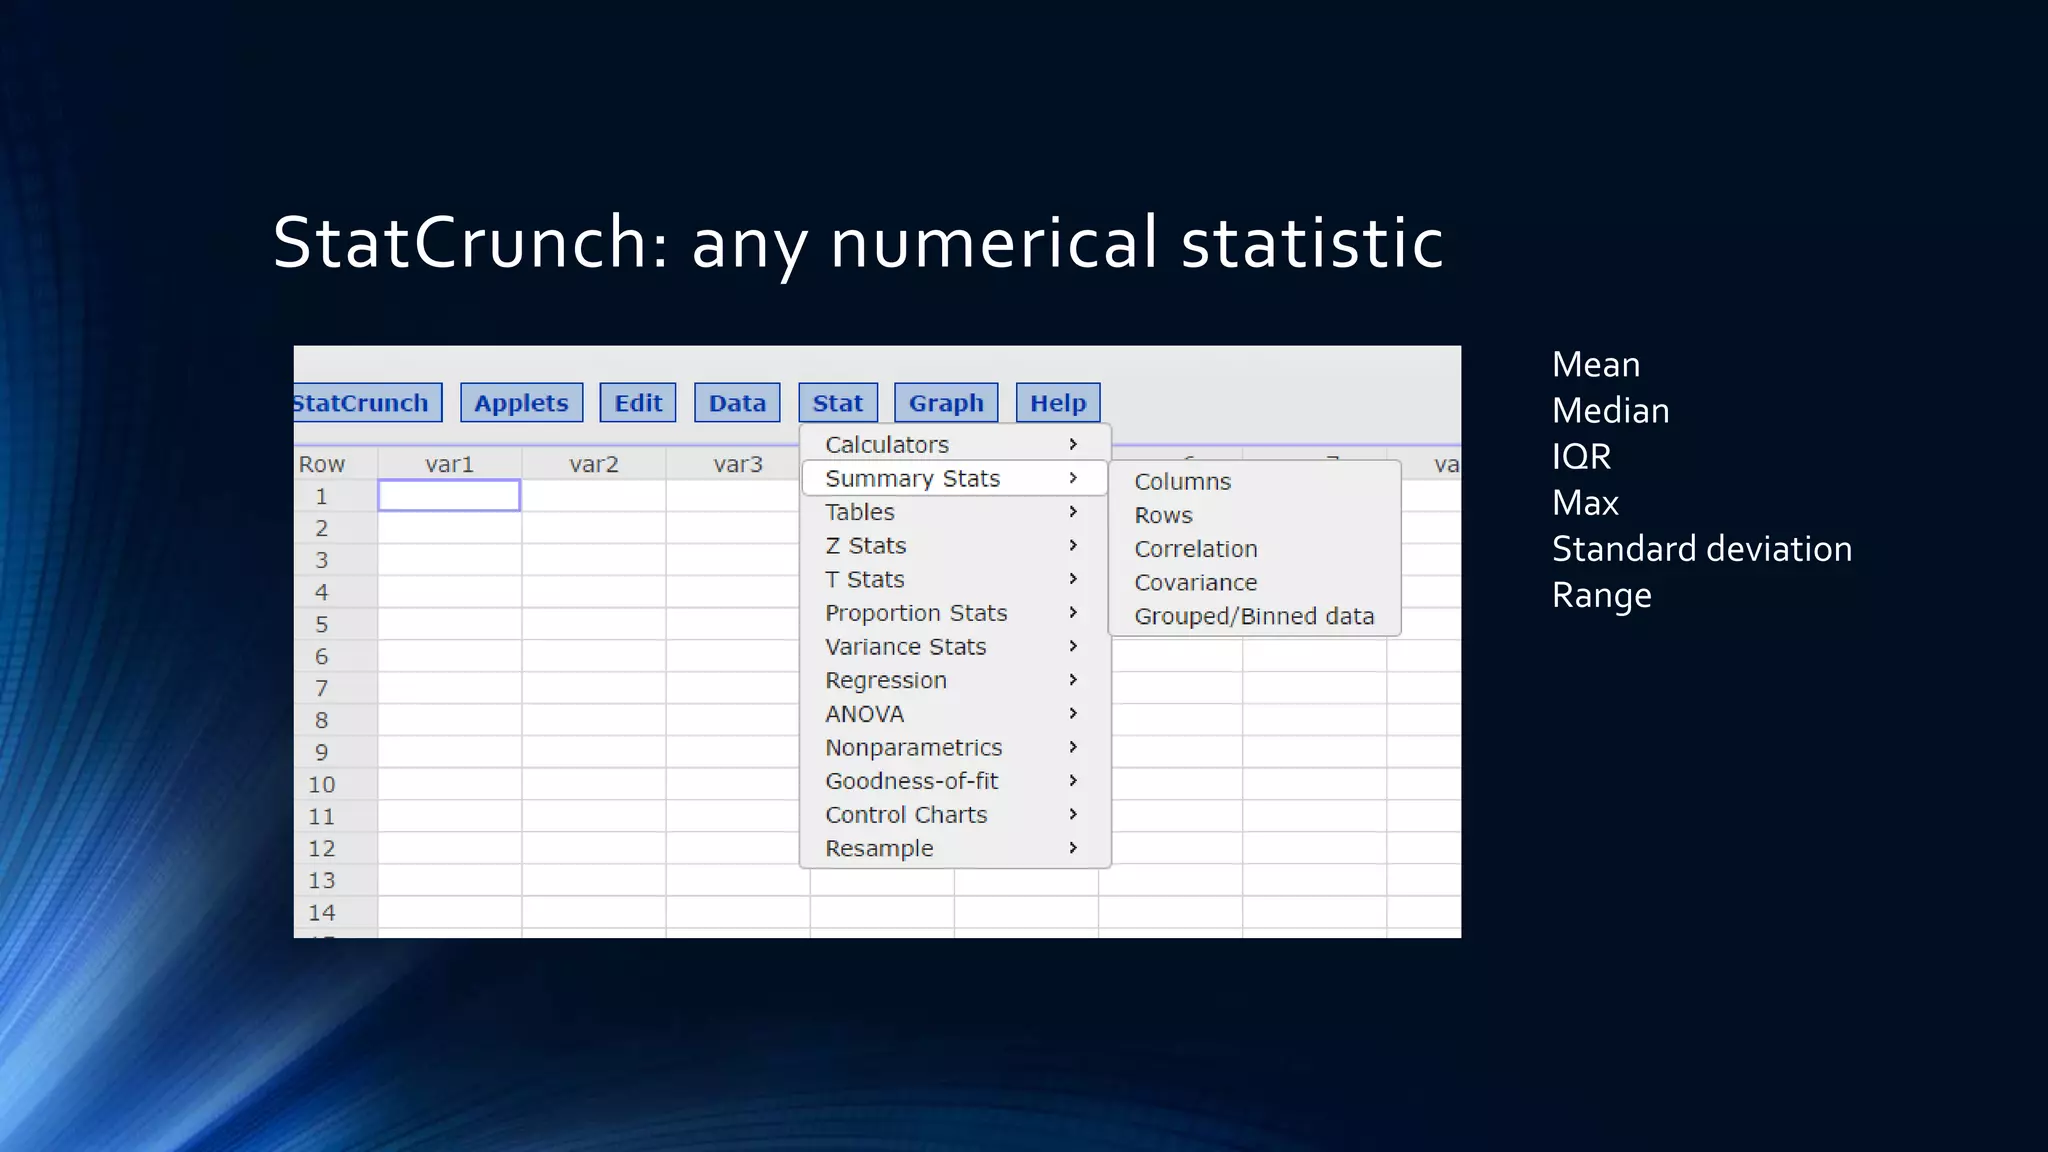
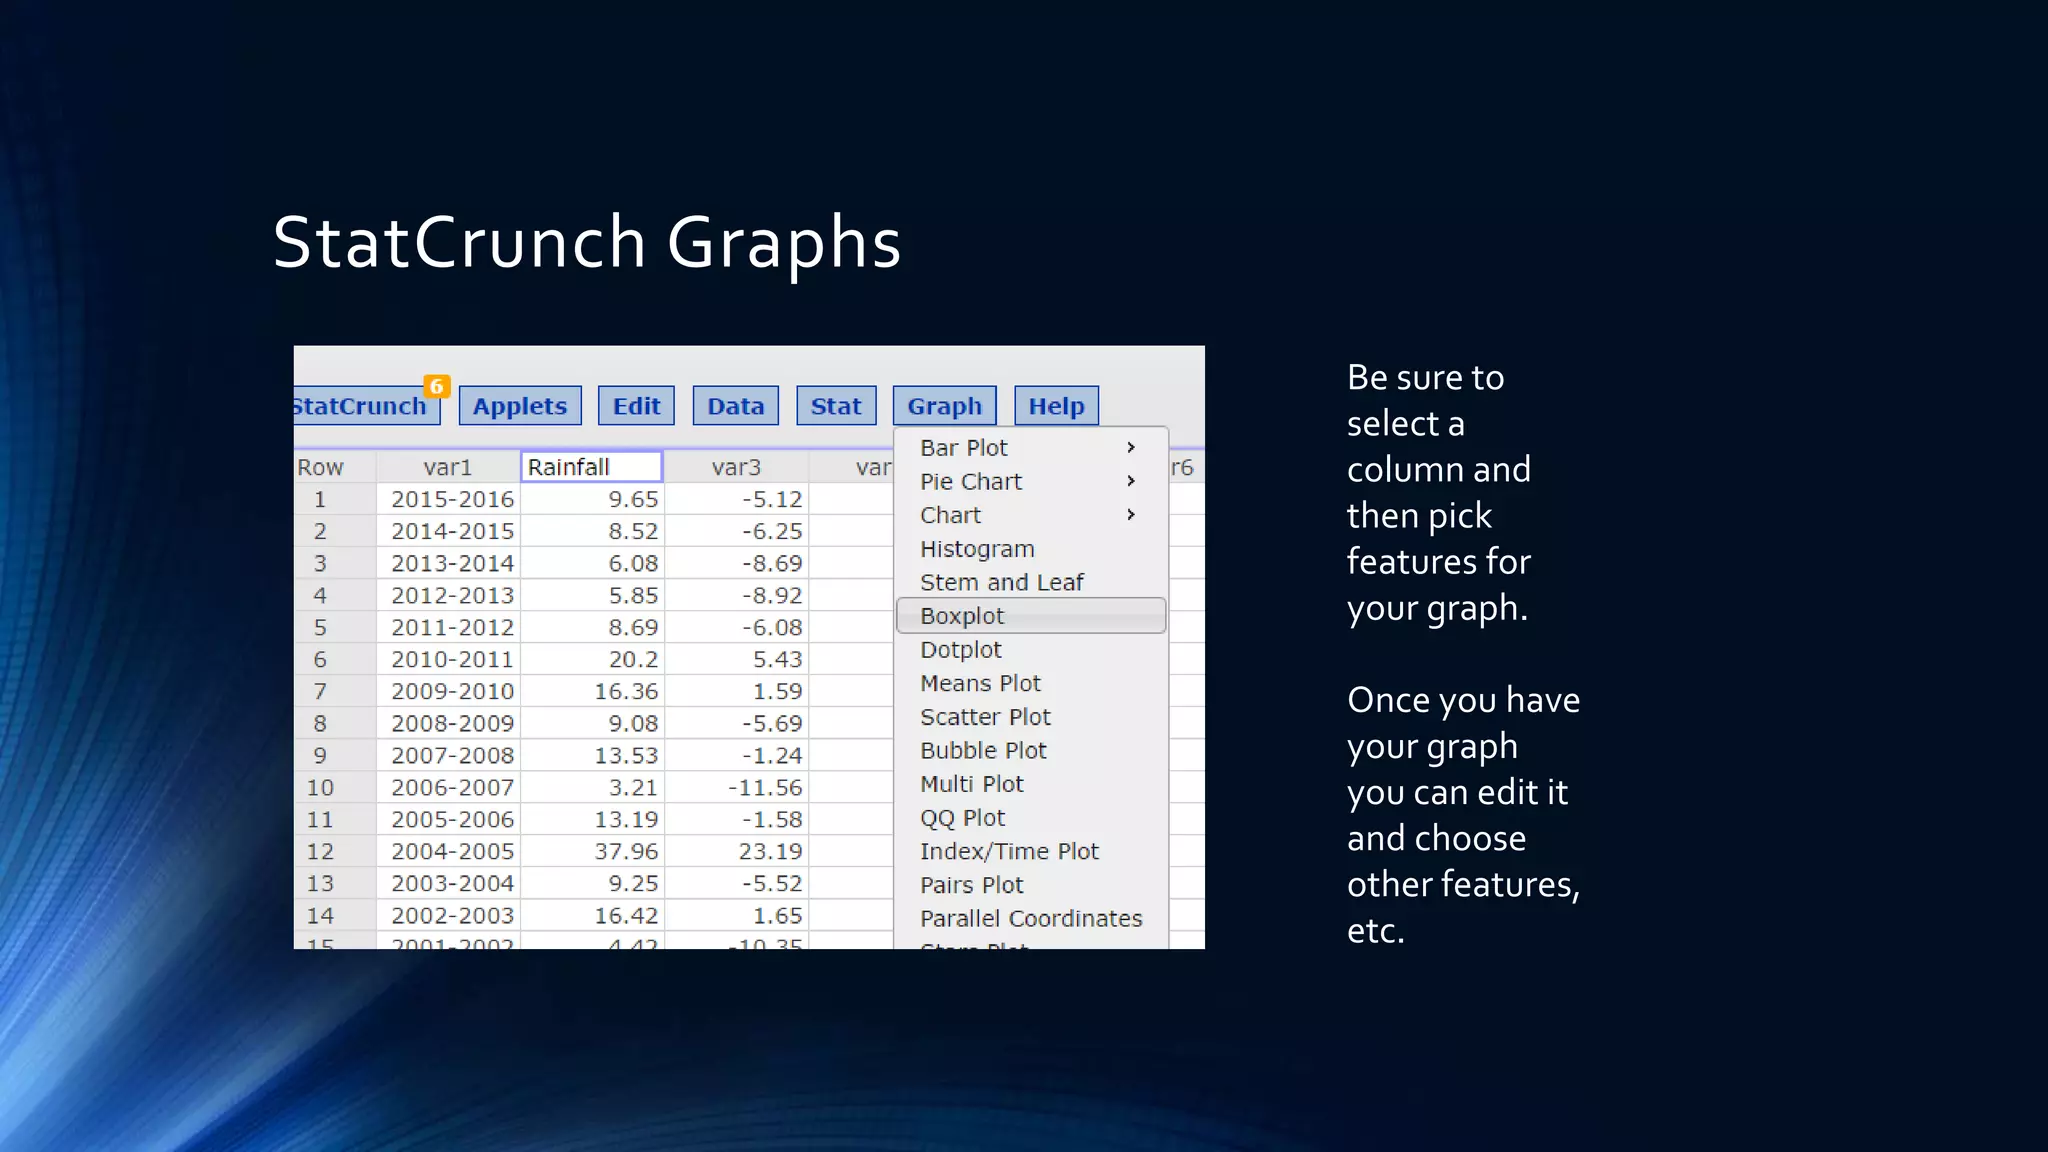


This document summarizes key topics from a math honors class, including measures of central tendency, descriptive statistics projects, and how to use the StatCrunch software. It discusses measures like mean, median, interquartile range, and standard deviation. It also covers the empirical rule, five number summary, boxplots, histograms, outliers, and how to generate graphs in StatCrunch. Students are instructed to work on a descriptive statistics project analyzing real data and calculating various metrics.