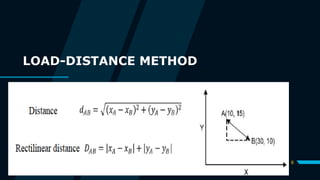
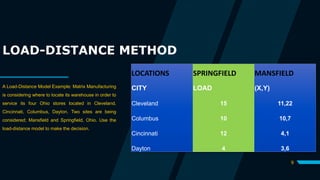
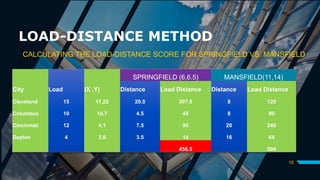
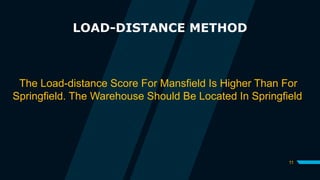
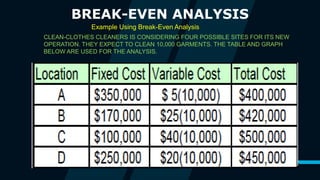
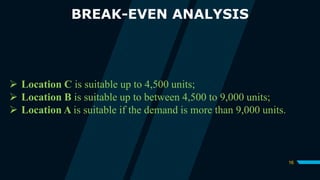
PLANT LOCATION
MODELS
27 November,
2019
GROUP MEMBERS
MOSES KOLLEH SESAY LY20191199
HAILU DESBELE HAGOS LY2019206
KIPROTICH EVANS LY2019192
2
INTRODUCTION
3
Various models are available which help to identify
the ideal location. Some of the popular models are:
1. Factor rating method
2. Weighted factor rating method
3. Load-distance method
4. Centre of gravity method
5. Break even analysis
FACTOR RATING
METHOD
Locating a Fabric manufacturing site using
Factor Rating Method
4
Rating
No Location Factors Factor Rating Location 1 Location 2
1 Demand 10 5 6
2 Material 8 7 6
3 Labour 5 4 4
4 Transport 5 4 3
FACTOR RATING METHOD
Solution to the factor rating
Method Question
5
RATING
NO LOCATION
FACTORS
FACTOR
RATING
LOCATION 1 TOTAL
SCORE
LOCATION
2
TOTAL
SCOR
E
1 Demand 10 5 50 6 60
2 Material 8 7 56 6 48
3 Transport 5 4 20 4 20
4 Labour 5 4 20 3 15
5 TOTAL 146 Total 143
WEIGHTED FACTOR RATING METHOD
Choosing A Warehouse Location For Shop At Home Using Weighted Factor
Rating Method
6
NO LOCATION FACTORS WEIGHT
SCORE OUT OF 100
LOCATION A LOCATION B LOCATION C
1 Easy Access 0.15 86 72 80
2 Parking Facilities 0.2 72 77 90
3 Display Area 0.15 86 90 80
4 Walking Traffic 0.1 94 86 76
5 Transportation Cost 0.15 99 89 98
6 Operation Cost 0.25 96 85 90
WEIGHTED FACTOR RATING
METHOD
7
NO LOCATION FACTORS WEIGHT
SCORE OUT OF 100 WEIGHTED SCORE
LOCATION A LOCATION B LOCATION C LOCATION A LOCATION B LOCATION C
1 Easy Access 0.15 86 72 80 12.9 10.8 12
2 Parking Facilities 0.2 72 77 90 14.4 15.4 18
3 Display Area 0.15 86 90 80 12.9 13.5 12
4 Walking Traffic 0.1 94 86 76 9.4 8.6 7.6
5 Transportation Cost 0.15 99 89 98 14.85 13.35 14.7
6 Operation Cost 0.25 96 85 90 24 21.25 22.5
TOTAL 88.45 82.9 86.8
8
LOAD-DISTANCE METHOD
A Load-Distance Model Example: Matrix Manufacturing
is considering where to locate its warehouse in order to
service its four Ohio stores located in Cleveland,
Cincinnati, Columbus, Dayton. Two sites are being
considered; Mansfield and Springfield, Ohio. Use the
load-distance model to make the decision.
9
LOCATIONS SPRINGFIELD MANSFIELD
CITY LOAD (X,Y)
Cleveland 15 11,22
Columbus 10 10,7
Cincinnati 12 4,1
Dayton 4 3,6
LOAD-DISTANCE METHOD
CALCULATING THE LOAD-DISTANCE SCORE FOR SPRINGFIELD VS. MANSFIELD
10
City Load (X ,Y)
SPRINGFIELD (6,6.5) MANSFIELD(11,14)
Distance Load Distance Distance Load Distance
Cleveland 15 11,22 20.5 307.5 8 120
Columbus 10 10,7 4.5 45 8 80
Cincinnati 12 4,1 7.5 90 20 240
Dayton 4 3,6 3.5 14 16 64
456.5 504
LOAD-DISTANCE METHOD
11
The Load-distance Score For Mansfield Is Higher Than For
Springfield. The Warehouse Should Be Located In Springfield.
12
CENTER OF GRAVITY
CITY LOAD LI COORDINATES (XI,YI)
Cleveland 15 11,22
Columbus 10 10,7
Cincinnati 12 4,1
Dayton 4 3,6
41
This Approach Requires That The Analyst Find The Center Of Gravity
Of The Geographic Area Being Considered
13
CENTER OF GRAVITY
CITY LOAD LI (XI,YI) LIXI LIYI
Cleveland 15 11,22 165 330
Columbus 10 10,7 100 70
Cincinnati 12 4,1 48 12
Dayton 4 3,6 12 24
41 325 436
𝑙𝑜𝑐𝑎𝑡𝑖𝑜𝑛 𝑥 =
∑LiXi
∑𝐿𝑖
=325/41= 7.9
𝑙𝑜𝑐𝑎𝑡𝑖𝑜𝑛 𝑦 =
∑LiYi
∑𝐿𝑖
=436/41=10.6
Computing the Center of Gravity for Matrix Manufacturing
14
BREAK-EVEN ANALYSIS
Example Using Break-Even Analysis
CLEAN-CLOTHES CLEANERS IS CONSIDERING FOUR POSSIBLE SITES FOR ITS NEW
OPERATION. THEY EXPECT TO CLEAN 10,000 GARMENTS. THE TABLE AND GRAPH
BELOW ARE USED FOR THE ANALYSIS.
15
BREAK-EVEN ANALYSIS
Break Even Graph For Clean Cloth Cleaners
Most Suitable
16
BREAK-EVEN ANALYSIS
 Location C is suitable up to 4,500 units;
 Location B is suitable up to between 4,500 to 9,000 units;
 Location A is suitable if the demand is more than 9,000 units.
Plant Location Models

Plant Location Models

  • 1.
  • 2.
    GROUP MEMBERS MOSES KOLLEHSESAY LY20191199 HAILU DESBELE HAGOS LY2019206 KIPROTICH EVANS LY2019192 2
  • 3.
    INTRODUCTION 3 Various models areavailable which help to identify the ideal location. Some of the popular models are: 1. Factor rating method 2. Weighted factor rating method 3. Load-distance method 4. Centre of gravity method 5. Break even analysis
  • 4.
    FACTOR RATING METHOD Locating aFabric manufacturing site using Factor Rating Method 4 Rating No Location Factors Factor Rating Location 1 Location 2 1 Demand 10 5 6 2 Material 8 7 6 3 Labour 5 4 4 4 Transport 5 4 3
  • 5.
    FACTOR RATING METHOD Solutionto the factor rating Method Question 5 RATING NO LOCATION FACTORS FACTOR RATING LOCATION 1 TOTAL SCORE LOCATION 2 TOTAL SCOR E 1 Demand 10 5 50 6 60 2 Material 8 7 56 6 48 3 Transport 5 4 20 4 20 4 Labour 5 4 20 3 15 5 TOTAL 146 Total 143
  • 6.
    WEIGHTED FACTOR RATINGMETHOD Choosing A Warehouse Location For Shop At Home Using Weighted Factor Rating Method 6 NO LOCATION FACTORS WEIGHT SCORE OUT OF 100 LOCATION A LOCATION B LOCATION C 1 Easy Access 0.15 86 72 80 2 Parking Facilities 0.2 72 77 90 3 Display Area 0.15 86 90 80 4 Walking Traffic 0.1 94 86 76 5 Transportation Cost 0.15 99 89 98 6 Operation Cost 0.25 96 85 90
  • 7.
    WEIGHTED FACTOR RATING METHOD 7 NOLOCATION FACTORS WEIGHT SCORE OUT OF 100 WEIGHTED SCORE LOCATION A LOCATION B LOCATION C LOCATION A LOCATION B LOCATION C 1 Easy Access 0.15 86 72 80 12.9 10.8 12 2 Parking Facilities 0.2 72 77 90 14.4 15.4 18 3 Display Area 0.15 86 90 80 12.9 13.5 12 4 Walking Traffic 0.1 94 86 76 9.4 8.6 7.6 5 Transportation Cost 0.15 99 89 98 14.85 13.35 14.7 6 Operation Cost 0.25 96 85 90 24 21.25 22.5 TOTAL 88.45 82.9 86.8
  • 8.
  • 9.
    LOAD-DISTANCE METHOD A Load-DistanceModel Example: Matrix Manufacturing is considering where to locate its warehouse in order to service its four Ohio stores located in Cleveland, Cincinnati, Columbus, Dayton. Two sites are being considered; Mansfield and Springfield, Ohio. Use the load-distance model to make the decision. 9 LOCATIONS SPRINGFIELD MANSFIELD CITY LOAD (X,Y) Cleveland 15 11,22 Columbus 10 10,7 Cincinnati 12 4,1 Dayton 4 3,6
  • 10.
    LOAD-DISTANCE METHOD CALCULATING THELOAD-DISTANCE SCORE FOR SPRINGFIELD VS. MANSFIELD 10 City Load (X ,Y) SPRINGFIELD (6,6.5) MANSFIELD(11,14) Distance Load Distance Distance Load Distance Cleveland 15 11,22 20.5 307.5 8 120 Columbus 10 10,7 4.5 45 8 80 Cincinnati 12 4,1 7.5 90 20 240 Dayton 4 3,6 3.5 14 16 64 456.5 504
  • 11.
    LOAD-DISTANCE METHOD 11 The Load-distanceScore For Mansfield Is Higher Than For Springfield. The Warehouse Should Be Located In Springfield.
  • 12.
    12 CENTER OF GRAVITY CITYLOAD LI COORDINATES (XI,YI) Cleveland 15 11,22 Columbus 10 10,7 Cincinnati 12 4,1 Dayton 4 3,6 41 This Approach Requires That The Analyst Find The Center Of Gravity Of The Geographic Area Being Considered
  • 13.
    13 CENTER OF GRAVITY CITYLOAD LI (XI,YI) LIXI LIYI Cleveland 15 11,22 165 330 Columbus 10 10,7 100 70 Cincinnati 12 4,1 48 12 Dayton 4 3,6 12 24 41 325 436 𝑙𝑜𝑐𝑎𝑡𝑖𝑜𝑛 𝑥 = ∑LiXi ∑𝐿𝑖 =325/41= 7.9 𝑙𝑜𝑐𝑎𝑡𝑖𝑜𝑛 𝑦 = ∑LiYi ∑𝐿𝑖 =436/41=10.6 Computing the Center of Gravity for Matrix Manufacturing
  • 14.
    14 BREAK-EVEN ANALYSIS Example UsingBreak-Even Analysis CLEAN-CLOTHES CLEANERS IS CONSIDERING FOUR POSSIBLE SITES FOR ITS NEW OPERATION. THEY EXPECT TO CLEAN 10,000 GARMENTS. THE TABLE AND GRAPH BELOW ARE USED FOR THE ANALYSIS.
  • 15.
    15 BREAK-EVEN ANALYSIS Break EvenGraph For Clean Cloth Cleaners Most Suitable
  • 16.
    16 BREAK-EVEN ANALYSIS  LocationC is suitable up to 4,500 units;  Location B is suitable up to between 4,500 to 9,000 units;  Location A is suitable if the demand is more than 9,000 units.