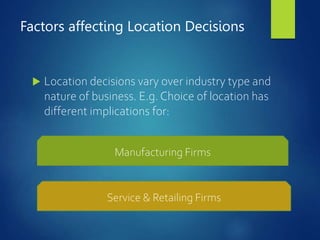
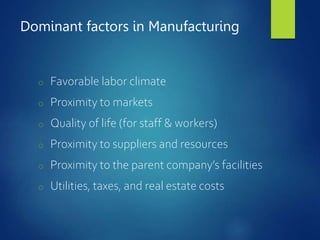
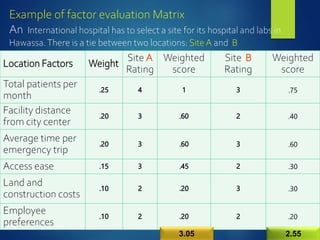
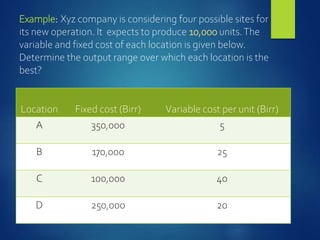
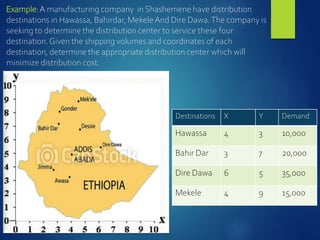
FACILITY LOCATION
CHAPTER 4
Facility Location
o Refers to the process of determining geographic sites
for a firm’s operations.
o Facility location is the process of identifying the best
geographic location for a service or production facility
It can be for:
 Entire organization
 A division, or
 Any form of establishment for manufacturing and/or
service activities
Impacts of location
 Location choice have a profound impact on the
firm’s ability to
o Improve productivity and quality
o Reduce costs
o Identify quality materials and vendors
o Identify requiredTechnology
o Serve customers in a better way
o Find required labor skills
Location Decisions
 Location decisions affect processes and
departments
o Marketing
o Human resources
o Accounting and finance
o Production & Operations
o Research & Development
o International operations
Factors affecting Location Decisions
 Location decisions vary over industry type and
nature of business. E.g. Choice of location has
different implications for:
Manufacturing Firms
Service & Retailing Firms
Dominant factors in Manufacturing
o Favorable labor climate
o Proximity to markets
o Quality of life (for staff & workers)
o Proximity to suppliers and resources
o Proximity to the parent company’s facilities
o Utilities, taxes, and real estate costs
Other factors
 Investment requirement for construction & set-up
 Available technology
 Available modes of transportation & infrastructure
 Community attitude
 Local & regional laws & legislation
Dominant factors in services
 Proximity to customers
 Transportation costs and proximity to markets
 Location of competitors
 Site-specific factors
o Traffic flows & visibility
o Availability of parking facility
o Population density
Geographic Information Systems &
Location Decisions
 GIS is a system of computer
software, hardware, and data
 Use to manipulate, analyze,
and present information
relevant to a location
decision
o Create a visual
representation of a firm’s
location choices
o Useful decision-making tool
Selecting a New Facility locations
Step 1: Identify the important location factors and
categorize them as dominant or secondary
Step 2: Consider alternative regions; then narrow to
alternative communities and finally specific
sites
Step 3: Collect data on the alternatives
Step 4: Analyze the data by quantitative methods
Step 5: Bring the qualitative factors pertaining to each
site into the evaluation
Methods of evaluating Location
Alternatives
 Common techniques are:
1. Locational cost-volume-profit analysis
2. Transportation model
3. Factor rating
4. Center of gravity method
Factor rating /Evaluation Matrix
a) List key factors (10-20)
b) Assign weight to each showing relative important of each
factor over others (0 to 1.0): Sum of all weights = 1.0
c) Assign a Rating (1-5) to each factor based on the
attractiveness or the suitability of each factor for the firm.
1 = not attractive at all
2 = below average attractive
3=Average attractiveness
4 = Above average attractiveness
5 = very attractive
Factor Evaluation Matrix…
d) Multiply each factor’s weight by its rating
 Produces a weighted score
e) Sum the weighted scores for each
 Determines the total weighted score for
each site.
Example of factor evaluation Matrix
An International hospital has to select a site for its hospital and labs in
Hawassa.There is a tie between two locations: SiteA and B
Location Factors Weight
Site A
Rating
Weighted
score
Site B
Rating
Weighted
score
Total patients per
month
.25 4 1 3 .75
Facility distance
from city center
.20 3 .60 2 .40
Average time per
emergency trip
.20 3 .60 3 .60
Access ease .15 3 .45 2 .30
Land and
construction costs
.10 2 .20 3 .30
Employee
preferences
.10 2 .20 2 .20
3.05 2.55
Cost-Profit-Volume Analysis method
 Locational cost-profit-volume analysis is a method of
determining the volume of production where a company
breaks even with costs and profits.
 It takes into account both variable and fixed factors that
influence the overall production costs.
 CPV uses a linear formula that recognizes total costs equal
to fixed costs plus variable costs.
Cost-Profit-Volume Analysis method
Steps
a) Determine the fixed and variable costs for each
alternative and calculate total cost at Zero and expected
out put level
b) Plot the total-cost lines for all alternatives on the same
graph
c) Determine the location that will have the lowest total
cost (or highest profit) for the expected level of output
Locational Cost-Profit-Volume
Analysis
Assumptions
1. Fixed costs are constant for the range of output
2. Variable costs are linear for the range of output
3. The required level of output can be closely
estimated
4. Only one product is involved
Example: Xyz company is considering four possible sites for
its new operation. It expects to produce 10,000 units.The
variable and fixed cost of each location is given below.
Determine the output range over which each location is the
best?
Location Fixed cost (Birr) Variable cost per unit (Birr)
A 350,000 5
B 170,000 25
C 100,000 40
D 250,000 20
Location FC VC TC@Q=0 TC@Q=10,000
A 350,000 5 350,000
350,000+5(0)
400,000
350,000+5(10,000)
B 170,000 25 170,000
170,000+25(0)
420,000
170,000+25(10,000)
C 100,000 40 100,000
100,000+40(0)
500,000
100,000+40(10,000)
D 250,000 20 250,000
250,000+20(0)
450,000
250,000+20(10,000)
Solution: calculateTc at Q=0 and at expected
quantity level(Q=10000 units)
Graph
Center of Gravity Method
 Method for locating a distribution center that minimizes
distribution costs
o The method includes the use of a map that shows the
locations of destinations
o Treats distribution costs as a linear function of the distance
and the quantity shipped
o The quantity to be shipped to each destination is assumed
to be fixed
o The map must be accurate and drawn to scale
o A coordinate system is overlaid on the map to determine
relative locations
Example: Center of Gravity
Center of Gravity Method Formulas
C =
d V
V
x
ix i
i


Cx = X coordinate of center of gravity
Cy = X coordinate of center of gravity
dix = X coordinate of the ith location
diy =Y coordinate of the ith location
Vi = volume of goods moved to or from ith location
C =
d V
V
y
iy i
i


Example:A manufacturing company in Shashemene have distribution
destinations in Hawassa, Bahirdar, MekeleAnd Dire Dawa.The company is
seeking to determine the distribution center to service these four
destination.Given the shipping volumes and coordinates of each
destination, determine the appropriate distribution center which will
minimize distribution cost.
Destinations X Y Demand
Hawassa 4 3 10,000
Bahir Dar 3 7 20,000
Dire Dawa 6 5 35,000
Mekele 4 9 15,000

facility location.ppt

  • 1.
  • 2.
    Facility Location o Refersto the process of determining geographic sites for a firm’s operations. o Facility location is the process of identifying the best geographic location for a service or production facility It can be for:  Entire organization  A division, or  Any form of establishment for manufacturing and/or service activities
  • 3.
    Impacts of location Location choice have a profound impact on the firm’s ability to o Improve productivity and quality o Reduce costs o Identify quality materials and vendors o Identify requiredTechnology o Serve customers in a better way o Find required labor skills
  • 4.
    Location Decisions  Locationdecisions affect processes and departments o Marketing o Human resources o Accounting and finance o Production & Operations o Research & Development o International operations
  • 5.
    Factors affecting LocationDecisions  Location decisions vary over industry type and nature of business. E.g. Choice of location has different implications for: Manufacturing Firms Service & Retailing Firms
  • 6.
    Dominant factors inManufacturing o Favorable labor climate o Proximity to markets o Quality of life (for staff & workers) o Proximity to suppliers and resources o Proximity to the parent company’s facilities o Utilities, taxes, and real estate costs
  • 7.
    Other factors  Investmentrequirement for construction & set-up  Available technology  Available modes of transportation & infrastructure  Community attitude  Local & regional laws & legislation
  • 8.
    Dominant factors inservices  Proximity to customers  Transportation costs and proximity to markets  Location of competitors  Site-specific factors o Traffic flows & visibility o Availability of parking facility o Population density
  • 9.
    Geographic Information Systems& Location Decisions  GIS is a system of computer software, hardware, and data  Use to manipulate, analyze, and present information relevant to a location decision o Create a visual representation of a firm’s location choices o Useful decision-making tool
  • 10.
    Selecting a NewFacility locations Step 1: Identify the important location factors and categorize them as dominant or secondary Step 2: Consider alternative regions; then narrow to alternative communities and finally specific sites Step 3: Collect data on the alternatives Step 4: Analyze the data by quantitative methods Step 5: Bring the qualitative factors pertaining to each site into the evaluation
  • 11.
    Methods of evaluatingLocation Alternatives  Common techniques are: 1. Locational cost-volume-profit analysis 2. Transportation model 3. Factor rating 4. Center of gravity method
  • 12.
    Factor rating /EvaluationMatrix a) List key factors (10-20) b) Assign weight to each showing relative important of each factor over others (0 to 1.0): Sum of all weights = 1.0 c) Assign a Rating (1-5) to each factor based on the attractiveness or the suitability of each factor for the firm. 1 = not attractive at all 2 = below average attractive 3=Average attractiveness 4 = Above average attractiveness 5 = very attractive
  • 13.
    Factor Evaluation Matrix… d)Multiply each factor’s weight by its rating  Produces a weighted score e) Sum the weighted scores for each  Determines the total weighted score for each site.
  • 14.
    Example of factorevaluation Matrix An International hospital has to select a site for its hospital and labs in Hawassa.There is a tie between two locations: SiteA and B Location Factors Weight Site A Rating Weighted score Site B Rating Weighted score Total patients per month .25 4 1 3 .75 Facility distance from city center .20 3 .60 2 .40 Average time per emergency trip .20 3 .60 3 .60 Access ease .15 3 .45 2 .30 Land and construction costs .10 2 .20 3 .30 Employee preferences .10 2 .20 2 .20 3.05 2.55
  • 15.
    Cost-Profit-Volume Analysis method Locational cost-profit-volume analysis is a method of determining the volume of production where a company breaks even with costs and profits.  It takes into account both variable and fixed factors that influence the overall production costs.  CPV uses a linear formula that recognizes total costs equal to fixed costs plus variable costs.
  • 16.
    Cost-Profit-Volume Analysis method Steps a)Determine the fixed and variable costs for each alternative and calculate total cost at Zero and expected out put level b) Plot the total-cost lines for all alternatives on the same graph c) Determine the location that will have the lowest total cost (or highest profit) for the expected level of output
  • 17.
    Locational Cost-Profit-Volume Analysis Assumptions 1. Fixedcosts are constant for the range of output 2. Variable costs are linear for the range of output 3. The required level of output can be closely estimated 4. Only one product is involved
  • 18.
    Example: Xyz companyis considering four possible sites for its new operation. It expects to produce 10,000 units.The variable and fixed cost of each location is given below. Determine the output range over which each location is the best? Location Fixed cost (Birr) Variable cost per unit (Birr) A 350,000 5 B 170,000 25 C 100,000 40 D 250,000 20
  • 19.
    Location FC VCTC@Q=0 TC@Q=10,000 A 350,000 5 350,000 350,000+5(0) 400,000 350,000+5(10,000) B 170,000 25 170,000 170,000+25(0) 420,000 170,000+25(10,000) C 100,000 40 100,000 100,000+40(0) 500,000 100,000+40(10,000) D 250,000 20 250,000 250,000+20(0) 450,000 250,000+20(10,000) Solution: calculateTc at Q=0 and at expected quantity level(Q=10000 units)
  • 20.
  • 21.
    Center of GravityMethod  Method for locating a distribution center that minimizes distribution costs o The method includes the use of a map that shows the locations of destinations o Treats distribution costs as a linear function of the distance and the quantity shipped o The quantity to be shipped to each destination is assumed to be fixed o The map must be accurate and drawn to scale o A coordinate system is overlaid on the map to determine relative locations
  • 22.
  • 23.
    Center of GravityMethod Formulas C = d V V x ix i i   Cx = X coordinate of center of gravity Cy = X coordinate of center of gravity dix = X coordinate of the ith location diy =Y coordinate of the ith location Vi = volume of goods moved to or from ith location C = d V V y iy i i  
  • 24.
    Example:A manufacturing companyin Shashemene have distribution destinations in Hawassa, Bahirdar, MekeleAnd Dire Dawa.The company is seeking to determine the distribution center to service these four destination.Given the shipping volumes and coordinates of each destination, determine the appropriate distribution center which will minimize distribution cost. Destinations X Y Demand Hawassa 4 3 10,000 Bahir Dar 3 7 20,000 Dire Dawa 6 5 35,000 Mekele 4 9 15,000

Editor's Notes

  • #19 From the graph you can see that the two lowest cost intersections occur between C & B (4667 units) and B & A (9000 units) The best alternative up to 4667 units is C, between 4667 and 9000 units the best is B, and above 9000 units the best site is A
  • #24 12