Downloaded 720 times
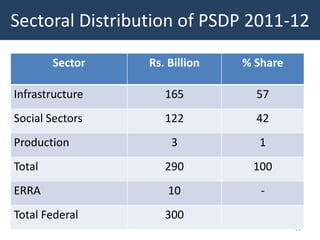
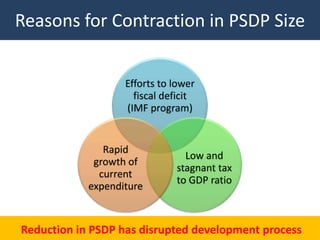
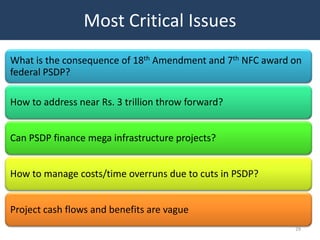
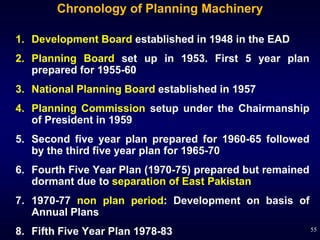
![Why is PSDP Falling?
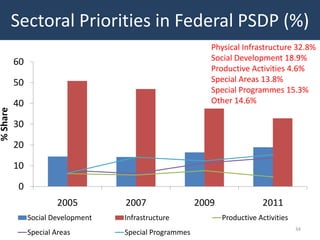
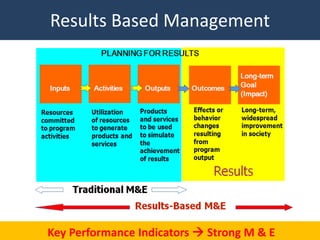
Size of PSDP [Federal + Provincial] Share of PSDP in Overall Expenditure
Current Expenditure Crowding out Development Expenditure25](https://image.slidesharecdn.com/planningprocess16jan122-120306022809-phpapp02/85/Planning-Process-for-Economic-Development-in-Pakistan-25-320.jpg)
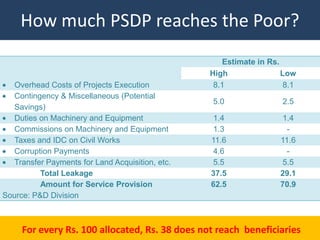
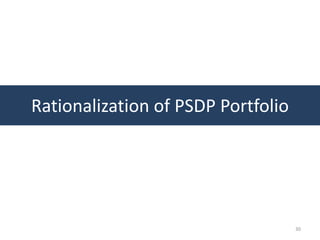

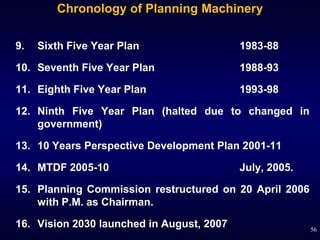
![Minimizing the Leakages
Project management costs should be minimized (including
corruption)
Dedicated Project Directors Required [current incentives
distorted]
Consultancy charges should be rationalized
Contingencies should be reduced
Public sector projects should be exempted from GST
50](https://image.slidesharecdn.com/planningprocess16jan122-120306022809-phpapp02/85/Planning-Process-for-Economic-Development-in-Pakistan-50-320.jpg)

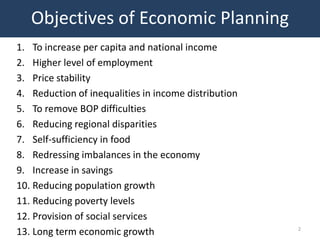
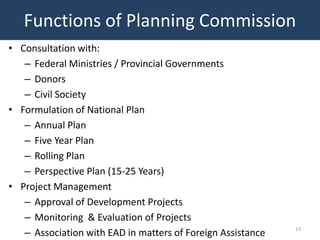
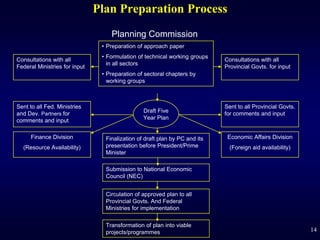
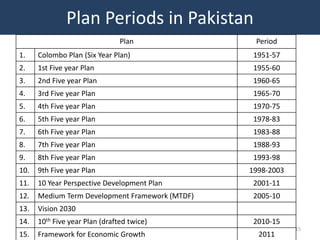
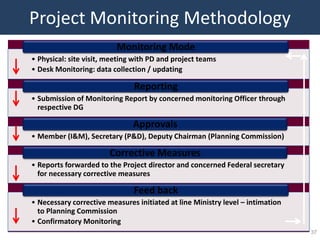
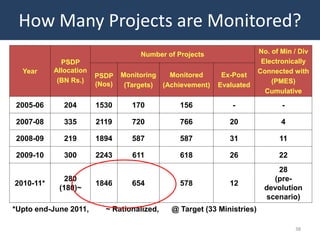
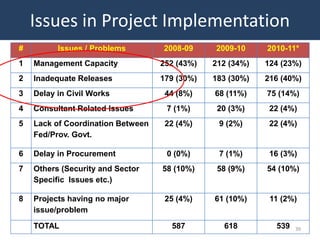
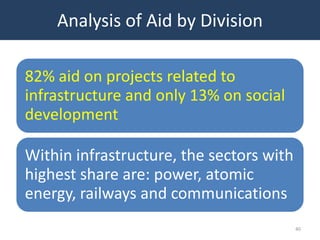
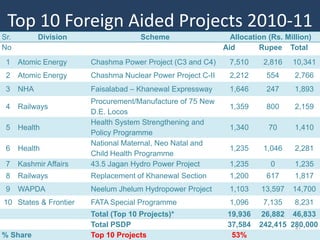
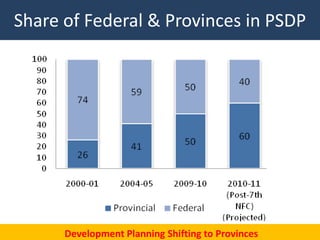
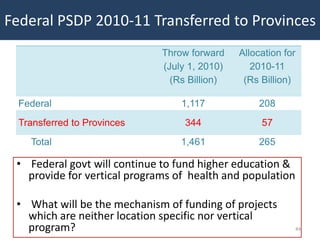
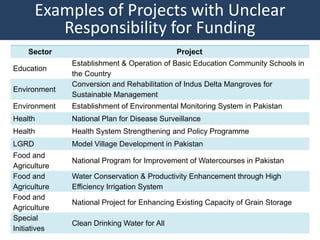
The document discusses Pakistan's economic planning process. It outlines objectives of economic planning such as increasing income and employment while ensuring price stability. It also discusses myths around economic planning and compares Pakistan's model to South Korea's. The planning machinery in Pakistan is described, including the functions of the Planning Commission and the project approval process. Challenges facing economic planning like a contracting public sector development program size are also analyzed.


